

Key Points
Using a novel mouse model mimicking MCL patient mutations, the loss of HECT domain of UBR5 causes alterations in B-cell development.
UBR5 mutations lead to stabilization of UBR5 and spliceosome components.

Abstract
Coordination of a number of molecular mechanisms including transcription, alternative splicing, and class switch recombination are required to facilitate development, activation, and survival of B cells. Disruption of these pathways can result in malignant transformation. Recently, next-generation sequencing has identified a number of novel mutations in mantle cell lymphoma (MCL) patients including mutations in the ubiquitin E3 ligase UBR5. Approximately 18% of MCL patients were found to have mutations in UBR5, with the majority of mutations within the HECT domain of the protein that can accept and transfer ubiquitin molecules to the substrate. Determining if UBR5 controls the maturation of B cells is important to fully understand malignant transformation to MCL. To elucidate the role of UBR5 in B-cell maturation and activation, we generated a conditional mutant disrupting UBR5′s C-terminal HECT domain. Loss of the UBR5 HECT domain leads to a block in maturation of B cells in the spleen and upregulation of proteins associated with messenger RNA splicing via the spliceosome. Our studies reveal a novel role of UBR5 in B-cell maturation by stabilization of spliceosome components during B-cell development and suggests UBR5 mutations play a role in MCL transformation.
Introduction
Mantle cell lymphoma (MCL) is a rare, aggressive form of non-Hodgkin lymphoma (NHL).1 Although MCL represents only ∼6% of NHL lymphoma cases, it has one of the highest mortality rates of all lymphomas with only a 50% 5-year survival.2 Given the high mortality rate and propensity for recurrence, understanding mutations found in MCL and disease development in B cells will open avenues for identifying new therapies. Recently, monoallelic mutations in the ubiquitin protein ligase E3 component n-recognin 5 (UBR5) were found in ∼18% of patients with MCL.3,4 Approximately 60% of mutations identified in UBR5 were frame shift mutations within its HECT domain, which can accept and transfer ubiquitin molecules to the substrate, leading to a premature stop codon before the cysteine residue associated with ubiquitin transfer.
UBR5 is a large ∼300 kDa protein HECT E3 ligase with a conserved carboxyl terminal HECT domain. In HECT E3 ligases, the N-terminal portion (N-lobe) of the enzyme interacts with E2 ubiquitin-conjugating enzymes and determines substrate specificity, whereas the C-terminal HECT domain (C-lobe) contains a catalytic cysteine residue that binds ubiquitin.5 The 2 lobes are connected by a flexible linker that allows for shifting orientation between N- and C-lobes during ubiquitin transfer to allow for efficient movement of ubiquitin from the E3 ligase to the substrate protein. UBR5 regulates a number of cellular processes including metabolism, apoptosis, angiogenesis, gene expression, and genome integrity.6-11 Overexpression of UBR5 has been found in a number of cancers including ovarian, breast, hepatocellular, squamous cell carcinoma, and melanoma.12-15
Determining if, and at what stage (transcriptional, translational, or proteomic) UBR5 controls maturation of B cells is important for fully understanding B-cell development and lymphoma transformation. To elucidate the role of UBR5 in B-cell maturation and activation, we generated a conditional mutant disrupting the C-terminal HECT domain mimicking mutations found in MCL. Loss of the HECT domain leads to a block in maturation of B cells with follicular B cells that are phenotypically abnormal with low expression of immunoglobulin D (IgD) and high expression of IgM. Upon immune stimulation, B cells lacking the HECT domain show decreased germinal center (GC) formation and reduced antibody producing plasma cells, suggesting functional defects. Proteomic studies reveal upregulation of proteins associated with messenger RNA (mRNA) splicing via the spliceosome and indicates that UBR5 interacts with splicing factors (SF3B3, PRPF8, DHX15, SNRNP200, and EFTUD2). Our studies reveal a novel role of UBR5 in B-cell maturation and suggest UBR5 mutations in MCL contribute to disease initiation.
Methods
Mice
Ubr5 HECT mutant (Ubr5ΔHECT) mice were developed in C57BL/6 mice using Easi-CRISPR as previously published16 and crossed with E2ACRE mice (Jackson Laboratory, Bar Harbor, ME) or Mb1CRE mice (kind gift of Dr. Michael Reth) on C57BL/6 background. Eμ-CyclinD1 mice were a kind gift from Dr. Samuel Katz.17 Targeted alleles were validated by polymerase chain reaction (PCR). For immune stimulation, mice were injected intraperitoneally with 1 × 10⁸ sheep red blood cells (SRBC) (Innovative Research, Novi, MI). All mice were housed in a pathogen-free facility and procedures were approved by Institutional Animal Care and Use Committee of University of Nebraska Medical Center in accordance with National Institutes of Health guidelines.
B-cell isolation and culture
Total bone marrow (BM) and splenocytes were isolated from 6-week-old mice. B220+ or CD23+ cells were isolated using MojoSort Streptavidin Nanobeads (BioLegend, San Diego, CA) following manufacturer’s protocol. B cells were cultured in RPMI1640 (Hyclone/GE Healthcare, Chicago, IL), 10% fetal bovine serum, 2 mM l-glutamine (Corning, Corning, NY), 50 µM 2-mercaptoethanol (Corning), 20 mM N-2-hydroxyethylpiperazine-N′-2-ethanesulfonic acid (Hyclone/GE Healthcare), 1X penicillin/streptomycin, and 10 µg/mL lipopolysaccharide (MilliporeSigma, Burlington, MA). Cells were treated with 200 µg/mL cycloheximide (MilliporeSigma) and/or 20 µg/mL MG132 (Cell Signaling Technologies, Danvers, MA) for 4 hours. For irradiation experiments, CD23+ splenocytes were given 10 Gy X-ray and collected after 1-hour recovery.
Flowcytometry analysis
For flow cytometry, cells were stained for 1 hour in 3% fetal bovine serum in phosphate-buffered saline (PBS). For cell-cycle analysis, cells were fixed and permeabilized following BioLegend intracellular staining protocol and stained with Ki67 and DAPI (4′,6-diamidino-2-phenylindole).
ELISA and ELISpot
Mice were bled on days 0 and 8 following immune stimulation. For enzyme-linked immunosorbent assay (ELISA), serum was collected following Abcam ELISA sample preparation guide, diluted 1:10 with PBS. SRBC was diluted 1:10 as a control. ELISA was performed with positive reference antigen mixture and PBS as a negative control according to manufacture (BD Pharmingen, San Jose, CA). ELISpot was performed using MabTech Kit for mouse IgG ELISpotBASIC (ALP; Cincinnati, OH) following manufacturer’s protocol. A total of 1.76 × 10⁶ SRBC and 75 000 splenocytes were plated on polyvinyl fluoride plates. BCIPNBT substrate was from Promega (Madison, WI).
Histological staining
Spleen sections were stained with UBR5 antibody and Ki67. For GC analysis, spleen sections from immunized mice were stained with biotinylated peanut agglutinin (PNA) antibody.
Nuclear fractionation
Nuclei from 293Ts (ATCC, Manassas, VA) were collected as described previously.18 Nuclei were lysed in 10 mM Tris-HCl pH7.4, 0.2 mM MgCl2, and 1% Triton-X 100 containing protease and phosphatase inhibitors for 15 minutes at 4°C. Continuous 10% to 30% glycerol gradients were prepared as previously described.19 Samples were spun at 28 000g for 13 hours at 4°C.
Quantitative real-time PCR
Total RNA was harvested using QIAGEN RNeasy Kit (QIAGEN, Hilden, Germany). Complementary DNA (cDNA) was synthesized using High Capacity RNA-to-cDNA Kit (Thermo Fisher Scientific, Waltham, MA), followed by quantitative real-time PCR (qRT-PCR) using iTaq Universal SYBR Green (BioRad, Hercules, CA).
Mass spectrometry
For global proteome quantification, B220+ splenocytes were isolated from 3 mice per genotype. Samples were prepared and tandem mass tag (TMT) labeled (TMT10plex Mass Tag Labeling Kits; Thermo Fisher Scientific) as previously described.20 Data are available via ProteomeXchange with identifier PXD014307.
For immunoprecipitation, cells were lysed in 20 mM Tris pH 7.5, 150 mM NaCl, 1 mM EDTA, and protease and phosphatase inhibitors. Immunoprecipitation was performed overnight at 4°C using anti-UBR5 antibody (Abcam, Cambridge, MA) or rabbit IgG control (Cell Signaling Technologies, Danvers, MA) and using protein A agarose beads (Cell Signaling Technologies) for IgG pulldown.
Statistical analysis
All experiments were performed in triplicate unless noted and statistical analyses were performed using an unpaired, 2-tailed Student t test. *P < .05, **P < .01, ***P < .001, ****P < .0001.
Additional materials and methods
Antibodies, primers, and additional methods are provided in supplemental Data, available on the Blood Web site.
Results
Ubr5 mutations are specific to MCL
Meissner et al originally identified UBR5 mutations in ∼18% of MCL patients.4 In recent cross-sectional genomic profiling of multiple lymphoma subtypes, we identified UBR5 as 1 of 8 genes that had a significantly higher frequency of mutation in MCL compared with other lymphoma subtypes. These monoallelic mutations were observed in 34 of 196 MCL tumors (15.8%) and 15 of 559 tumors (2.7%) of other subtypes. However, mutations within the HECT domain were found only in MCL tumors (Figure 1A).3 Patients with UBR5 mutations had between 4 and 12 additional mutations, but did not significantly cooccur with other mutations (Figure 1B).3 These findings suggest that HECT domain mutations of UBR5 are a disease-specific genetic feature of MCL.
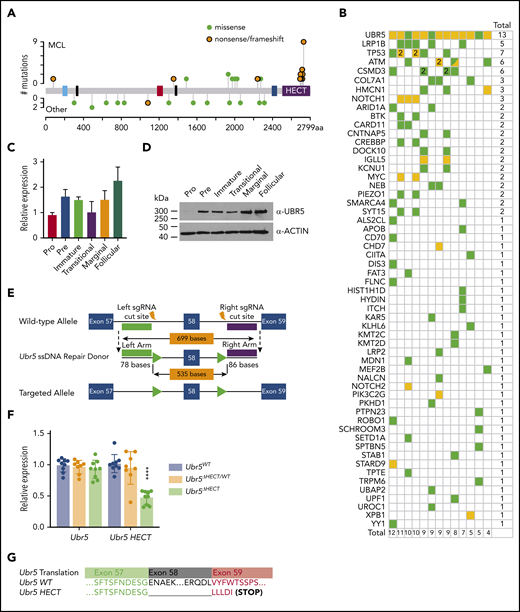
Expression of Ubr5 in B cells and generation of conditional Ubr5 HECT domain knockout model. (A) UBR5 domain map (blue = UBA, black = NLS, red = UBR, blue = MLLE, and purple = HECT) showing the frequency of UBR5 mutations in lymphoma patients. Orange = nonsense/frameshift; green = missense. (B) Frequency of all genes mutated in addition to UBR5 mutations in MCL patients. (C) Relative qRT-PCR and (D) western blot expression of UBR5 within different B-cell populations: pro-B cells (B220+IgM−ckit+), pre-B cells (B220+IgM−CD25+), immature B cells (B220+IgMloIgD−) from the BM, and transitional (B220+CD93+), marginal zone B cells (B220+CD21+CD23−), and follicular B cells (B220+CD21+CD23+) isolated from the spleen of 6-week-old WT C57Bl6 mice. (E) Schematic of targeting strategy used to insert loxP sites flanking exon 58 of Ubr5. (F) Relative expression of Ubr5 and Ubr5 HECT domain by qRT-PCR in spleen B220+ cells. (G) Sequencing data of exons 57-59 of Ubr5 from Ubr5 WT and Ubr5 HECT mice.
Expression of Ubr5 in B cells and generation of conditional Ubr5 HECT domain knockout model. (A) UBR5 domain map (blue = UBA, black = NLS, red = UBR, blue = MLLE, and purple = HECT) showing the frequency of UBR5 mutations in lymphoma patients. Orange = nonsense/frameshift; green = missense. (B) Frequency of all genes mutated in addition to UBR5 mutations in MCL patients. (C) Relative qRT-PCR and (D) western blot expression of UBR5 within different B-cell populations: pro-B cells (B220+IgM−ckit+), pre-B cells (B220+IgM−CD25+), immature B cells (B220+IgMloIgD−) from the BM, and transitional (B220+CD93+), marginal zone B cells (B220+CD21+CD23−), and follicular B cells (B220+CD21+CD23+) isolated from the spleen of 6-week-old WT C57Bl6 mice. (E) Schematic of targeting strategy used to insert loxP sites flanking exon 58 of Ubr5. (F) Relative expression of Ubr5 and Ubr5 HECT domain by qRT-PCR in spleen B220+ cells. (G) Sequencing data of exons 57-59 of Ubr5 from Ubr5 WT and Ubr5 HECT mice.
Generation of a conditional UBR5 HECT mutant
Because the role of Ubr5 in lymphopoiesis is unknown, we evaluated the expression of Ubr5 in B-cell subgroups during development by purifying pro-, pre-, and immature B cells from BM of C57/BL6 wild-type (WT) mice. Additionally, transitional, follicular, and marginal zone B-cell populations were purified from spleens. The pro B-cell population showed lowest expression of Ubr5 at both the RNA and protein level, whereas the highest expression of Ubr5 was found in mature splenic populations (follicular and marginal) (Figure 1C-D). These studies imply a role for UBR5 during B-cell development.
To understand the role of UBR5 mutations in B-cell development, we generated a conditional allele targeting exon 58 that would lead to a truncated protein lacking the cysteine required for ubiquitin conjugation in the HECT domain and mimicking mutations found in MCL patients (Figure 1E).21 We first crossed our Ubr5ΔHECT mice to E2ACRE mice that delete in early embryogenesis.22,23 E2ACRE;Ubr5ΔHECT/WT mice were fertile and showed no physical abnormalities. In contrast to Ubr5-null mice that are not viable past E10.5,22 3 of 49 pups found at birth were E2ACRE;Ubr5ΔHECT/ΔHECT; however, the pups were not viable, indicating the HECT domain is not required for embryogenesis and fetal hematopoiesis (supplemental Figure 1A-B).
Because E2ACRE;Ubr5ΔHECT/ΔHECT mice die before or at birth, to study B-cell development we crossed Ubr5ΔHECT/ΔHECT mice to Mb1WT/CRE, which truncates UBR5 in early B-lymphocytes (supplemental Figure 1C).24 qRT-PCR showed no decrease in Ubr5 expression, but significant decrease in Ubr5 HECT domain expression (Figure 1F). Because of the size of UBR5 protein (∼300 kDa) we are unable to determine changes in protein size of the HECT mutant (∼290 kDa); therefore, we isolated RNA from splenic B cells from Mb1WT/CRE;Ubr5ΔHECT/ΔHECT mice and WT littermates and amplified cDNA followed by Sanger sequencing. Sequencing confirmed loss of exon 58 along with expected frame shift and early stop codon (Figure 1G).
Impaired B-cell maturation following deletion of UBR5 HECT domain
Early B-cell development occurs within the BM. In Mb1WT/CRE;Ubr5ΔHECT/WT and Mb1WT/CRE;Ubr5ΔHECT/ΔHECT mice, the number of total BM cells and frequency of B220+ B cells showed no significant difference compared with WT littermates (Figure 2A-C). Further analysis of specific subtypes of B cells revealed a striking decrease in IgD+ mature B-cell populations in both Mb1WT/CRE;Ubr5ΔHECT/ΔHECTand Mb1WT/CRE;Ubr5ΔHECT/WT mice (Figure 2D-F). Decreases in mature B cells were compensated in BM by a slight increase in pro/pre B-cell population, specifically in pro-B cells in the Mb1WT/CRE;Ubr5ΔHECT/ΔHECT cohort (Figure 2G-I). These studies demonstrate an impact to mature cells within BM, as well as changes to composition of pro-B cells following loss of HECT domain.
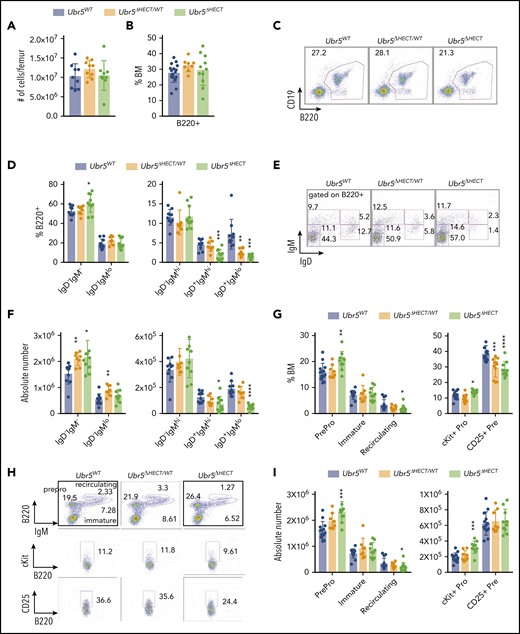
The loss of the HECT domain of Ubr5 leads to decreased numbers of mature B cells within the BM. (A) Bar graph of the total number of cells per femur. (B) Bar graph of the frequency of B220+ cells in the BM. (C) Representative flow cytometry plot of total B220+ in the BM. (D) Bar graphs of B-cell populations gated on B220+ cells for pro- and pre-B cells (B220+IgM−IgD−), immature B cells (B220+IgMloIgD−), transitional B cells (B220+IgM+IgD−), early mature B cells (B220+IgM+IgD+), and late mature B cells (B220+IgM−IgD+). (E) Representative flow cytometry plots for populations shown in panel D. (F) Absolute number of B-cell populations from panel D. (G) Bar graph of the population breakdown shown in panel H. (H) Representative flow cytometry plots gated for pro- and pre-B cells (B220+IgM−), immature B cells (B220+IgMlo), and recirculating B cells (B220+IgM+) (top). A representative flow cytometry plot gated on B220+ cells gating for pro-B cells (B220+IgM−c-kit+) (middle) and pre-B cells (B220+IgM−CD25+) (bottom). (I) Absolute number of B-cell populations from G (N = 10). *P < .05, **P < .01, ***P < .001.
The loss of the HECT domain of Ubr5 leads to decreased numbers of mature B cells within the BM. (A) Bar graph of the total number of cells per femur. (B) Bar graph of the frequency of B220+ cells in the BM. (C) Representative flow cytometry plot of total B220+ in the BM. (D) Bar graphs of B-cell populations gated on B220+ cells for pro- and pre-B cells (B220+IgM−IgD−), immature B cells (B220+IgMloIgD−), transitional B cells (B220+IgM+IgD−), early mature B cells (B220+IgM+IgD+), and late mature B cells (B220+IgM−IgD+). (E) Representative flow cytometry plots for populations shown in panel D. (F) Absolute number of B-cell populations from panel D. (G) Bar graph of the population breakdown shown in panel H. (H) Representative flow cytometry plots gated for pro- and pre-B cells (B220+IgM−), immature B cells (B220+IgMlo), and recirculating B cells (B220+IgM+) (top). A representative flow cytometry plot gated on B220+ cells gating for pro-B cells (B220+IgM−c-kit+) (middle) and pre-B cells (B220+IgM−CD25+) (bottom). (I) Absolute number of B-cell populations from G (N = 10). *P < .05, **P < .01, ***P < .001.
Following development in BM, B cells migrate to the spleen where they undergo maturation and activation.25 Mb1WT/CRE;Ubr5ΔHECT/ΔHECT mice have smaller spleens and a reduction in total splenocytes (Figure 3A; supplemental Figure 2A). Although mice had a reduction of splenocytes, frequency of B220+ cells in all genotypes was ∼45% (Figure 3B), and splenic architecture was unaltered following loss of the HECT domain (supplemental Figure 2B). Transitional B-cell populations in the spleen had no significant differences (supplemental Figure 2C-E). However, there was significant impact on mature B1 and B2 subsets within the spleen. We found in the B2 subset, marginal zone B cells were significantly reduced from approximately 10% of B220+ splenocytes to 2% in both Mb1WT/CRE;Ubr5ΔHECT/WT and Mb1WT/CRE;Ubr5ΔHECT/ΔHECT mice whereas the follicular B-cell compartment frequency was slightly increased, despite a reduction in absolute number of follicular B cells in Mb1WT/CRE;Ubr5ΔHECT/WT and Mb1WT/CRE;Ubr5ΔHECT/ΔHECT mice (Figure 3C-E).
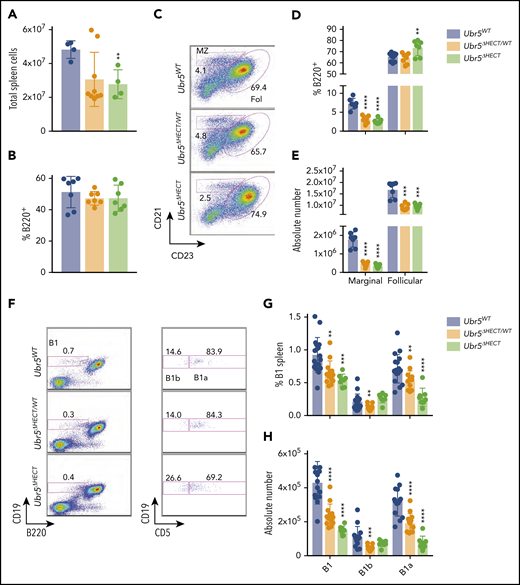
The loss of the HECT domain of Ubr5 leads to reduction in marginal and B1a splenic cells. (A) Bar graph of the total number of splenocytes (N ≥ 4). (B) Bar graph of frequency of B220+ cells per spleen (N = 7). (C) Representative flow cytometry plots gated on B220+ for follicular B cells (B220+CD21+CD23+) and marginal zone B cells (B220+CD21+CD23−) (N = 7). (D-E) Bar graphs of percentages and absolute number of follicular and marginal zone B cells within the spleen. (F) Representative flow cytometry plots gated for B1a (B220+CD19loCD5+) and B1b cells (B220+CD19loCD5−) (N ≥ 8). (G-H) Bar graph of percentages and absolute number of B1a and B1b cells. *P < .05, **P < .01, ***P < .001, ****P < .0001.
The loss of the HECT domain of Ubr5 leads to reduction in marginal and B1a splenic cells. (A) Bar graph of the total number of splenocytes (N ≥ 4). (B) Bar graph of frequency of B220+ cells per spleen (N = 7). (C) Representative flow cytometry plots gated on B220+ for follicular B cells (B220+CD21+CD23+) and marginal zone B cells (B220+CD21+CD23−) (N = 7). (D-E) Bar graphs of percentages and absolute number of follicular and marginal zone B cells within the spleen. (F) Representative flow cytometry plots gated for B1a (B220+CD19loCD5+) and B1b cells (B220+CD19loCD5−) (N ≥ 8). (G-H) Bar graph of percentages and absolute number of B1a and B1b cells. *P < .05, **P < .01, ***P < .001, ****P < .0001.
The B1 population plays a key role innate immunity. The splenic B1 population was reduced by approximately twofold in Mb1WT/CRE;Ubr5ΔHECT/WT and Mb1WT/CRE;Ubr5ΔHECT/ΔHECT mice and the reduction was exclusively in the B1a subpopulation (Figure 3F-H). Similarly, B1 populations in the peritoneal cavity was ∼75% reduced (supplemental Figure 2F-H). These findings demonstrate a significant loss of populations required for innate immunity with loss of B1 and marginal zone B cells following deletion of the HECT domain of Ubr5.
Alterations in phenotype and function of splenic B cells following loss of the HECT domain
Evaluating cell surface markers revealed Mb1WT/CRE;Ubr5ΔHECT/ΔHECT follicular B cells had abnormal expression with low IgD and high IgM compared with their WT littermates (Figure 4A-B). Follicular B cells also had high CD23 expression, but normal expression of CD5 and CD1d (Figure 4A-B). To further define alterations in the B-cell compartment, we analyzed cell cycle. Although follicular B cells are typically in the resting state, Mb1WT/CRE;Ubr5ΔHECT/ΔHECT cells are more quiescent with increased cells in G0 (supplemental Figure 3A). Additionally, staining with proliferation marker Ki67 showed a reduction of Ki67 staining, specifically in white pulp of spleens in Mb1WT/CRE;Ubr5ΔHECT/ΔHECT mice (supplemental Figure 3B). These studies demonstrated alterations in mature spleen cells with both phenotypic and cell-cycle alterations.
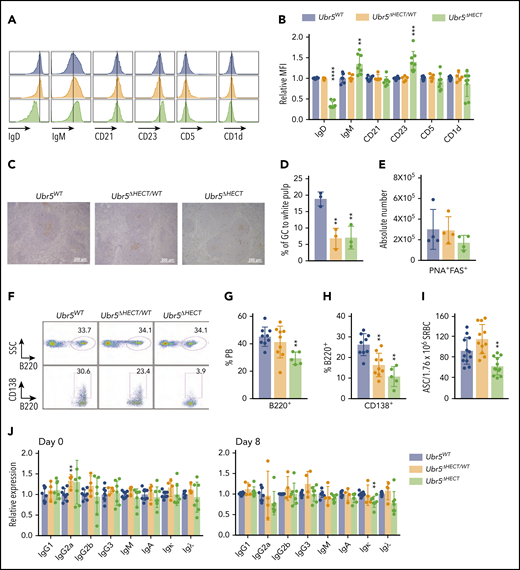
The follicular B cells in Ubr5ΔHECT mice have an altered phenotype and diminished differentiation capabilities. (A) Representative histogram of cell-surface markers of follicular B cells (B220+CD21+CD23+). (B) Bar graphs of relative MFI of follicular B cells depicted in panel A (N ≥ 5). (C) Representative PNA IHC staining of spleen 7 days poststimulation with SRBC (N = 3). (D) Percentage of GC staining to the white pulp within the spleen (N = 3). (E) Absolute number of germinal center cells (B220+PNA+CD95+) (N = 4). (F) Representative flow cytometry plots of B220+ and CD138+ plasma cells in the peripheral blood. (G-H) Bar graphs representing percentages of B220+ and CD138+ cells in the peripheral blood depicted in panel F (N ≥ 5). (I) Bar graph of ELISpot indicating number of antibody-secreting cells (ASC) from SRBC-activated splenocytes (N = 12). (J) Bar graphs of ELISA indicating relative expression for different immunoglobulin types before (day 0) and after (day 8) immune system stimulation with SRBC (N ≥ 4). *P < .05, **P < .01, ***P < .001, ****P < .0001.
The follicular B cells in Ubr5ΔHECT mice have an altered phenotype and diminished differentiation capabilities. (A) Representative histogram of cell-surface markers of follicular B cells (B220+CD21+CD23+). (B) Bar graphs of relative MFI of follicular B cells depicted in panel A (N ≥ 5). (C) Representative PNA IHC staining of spleen 7 days poststimulation with SRBC (N = 3). (D) Percentage of GC staining to the white pulp within the spleen (N = 3). (E) Absolute number of germinal center cells (B220+PNA+CD95+) (N = 4). (F) Representative flow cytometry plots of B220+ and CD138+ plasma cells in the peripheral blood. (G-H) Bar graphs representing percentages of B220+ and CD138+ cells in the peripheral blood depicted in panel F (N ≥ 5). (I) Bar graph of ELISpot indicating number of antibody-secreting cells (ASC) from SRBC-activated splenocytes (N = 12). (J) Bar graphs of ELISA indicating relative expression for different immunoglobulin types before (day 0) and after (day 8) immune system stimulation with SRBC (N ≥ 4). *P < .05, **P < .01, ***P < .001, ****P < .0001.
Activation of follicular B cells by T-dependent antigens leads to formation of GC in secondary lymphoid tissues and generation of antibody producing plasma cells. To determine if Mb1WT/CRE;Ubr5ΔHECT/ΔHECT follicular B cells have normal function, we immunized mice with SRBC. Eight days following immunization, we performed immunohistochemical (IHC) analysis on spleens with PNA, a GC marker. Staining revealed significant decrease in the proportion of GC to white pulp in Mb1WT/CRE;Ubr5ΔHECT/ΔHECT mice (Figure 4C-D). Quantification of GC B cells by flow cytometry showed a trend of decrease in Mb1WT/CRE;Ubr5ΔHECT/ΔHECT mice; however, it was not statistically significant (Figure 4E). We evaluated the ability of follicular B cells to terminally differentiate into plasma cells within the peripheral blood and found a ∼50% reduction of plasma cells in Mb1WT/CRE;Ubr5ΔHECT/ΔHECT mice, whereas Mb1WT/CRE;Ubr5ΔHECT/WT mice had ∼25% reduction in plasma cells (Figure 4F-H). Correlating with the decreased number of plasma cells, B cells isolated from Mb1WT/CRE;Ubr5ΔHECT/ΔHECT mice showed a decrease in antibody-producing cells (Figure 4I). Although we had a significant decrease in CD138+ antibody producing cells, levels of antibodies IgG, IgM, and IgA within sera were unaltered implying that Ubr5 HECT domain deletion does not affect basal antibody levels (Figure 4J). These studies indicate an important role of Ubr5 in the function and activation of B cells.
UBR5 in disease initiation and transformation
MCL is characterized by t(11;14)(q13;q32) translocation that leads to aberrant expression of CyclinD1 (CCND1).1 To determine whether Ubr5ΔHECT/ΔHECT drives lymphoma transformation, we crossed our Mb1CRE/WT;Ubr5ΔHECT/ΔHECT mice with CCND1 B-cell specific overexpression model (EµCCND1) to obtain Mb1CRE/WT;Ubr5ΔHECT/ΔHECT;EµCCND1 mice.17 We immune stimulated mice with SRBC biweekly for 4 months, and aged 12 months. Similar to Mb1CRE/WT;Ubr5ΔHECT/ΔHECT mice, Mb1CRE/WT;Ubr5ΔHECT/ΔHECT;EµCCND1 mice had decreased mature recirculating cells and plasma cells in the peripheral blood (supplemental Figure 4A-C). Interestingly, in the spleen, after the addition of EµCCND1, there was no difference in weight of the spleens or frequency of B220+ cells (supplemental Figure 4D-F). Strikingly, the addition of EµCCND1 rescued the loss of both marginal zone and B1 B cells (supplemental Figure 4G-H). Although mice did not show signs of disease at 12 months, spleen cells maintained the IgMhiIgDlo phenotype similar to phenotype commonly seen in MCL patients (supplemental Figure 4I).26,27 MCL patients are generally CD23−; however, a small subset are CD23+.28 Mb1CRE/WT;Ubr5ΔHECT/ΔHECT;EµCCND1 mice displayed varied CD23 expression compared with Mb1CRE/WT;Ubr5ΔHECT/ΔHECT with some mice expressing little to no CD23. UBR5 mutations affect the pre-GC B cells, the tumor population in MCL, but these findings propose additional mutations may be required for lymphoma transformation.
Loss of UBR5 HECT domain leads to increased expression of spliceosome components
The HECT domain of UBR5 is thought to be required for its ubiquitination activity, implicating deletion could lead to increased accumulation of UBR5 substrates targeted for degradation by the proteasome. To quantitatively determine protein differences in Mb1WT/CRE;Ubr5ΔHECT/ΔHECT vs WT littermates, we labeled splenic B220+ cells with TMT, combined samples in equal concentrations, and analyzed by mass spectrometry (MS) (Figure 5A). Proteomic analysis identified 15 584 unique peptides, 2797 quantifiable proteins, and 1675 proteins with ≥3 unique peptides. A total of 153 proteins were significantly changed in Mb1WT/CRE;Ubr5ΔHECT/ΔHECT splenocytes (Figure 5B; supplemental Table 2). Principal component analysis plot showed genotypes clustered together, and proteins identified were distributed throughout cellular compartments (Figure 5C-D). Of the differentially expressed proteins, 104 ≥1.3-fold significantly overexpressed were enriched for proteins associated with mRNA processing, and mRNA splicing via the spliceosome, whereas the 49 ≤0.70-fold significantly decreased from Mb1WT/CRE;Ubr5ΔHECT/ΔHECT were proteins associated with immune system process and protein transport (Figure 5E-G). As revealed by flowcytometry, IgD protein was the highest downregulated protein following deletion of Ubr5 HECT domain (Figure 5E). CD22, which is associated with B-cell activation, was also downregulated in Mb1WT/CRE;Ubr5ΔHECT/ΔHECT mice (Figure 5E). Intriguingly, the second highest expressed protein in Mb1WT/CRE;Ubr5ΔHECT/ΔHECT was UBR5 (Figure 5E-F). Proteomic profiling revealed an increase in UBR5 and proteins associated with mRNA splicing in B cells lacking HECT domain of UBR5, suggesting a novel role of UBR5 in mRNA splicing.
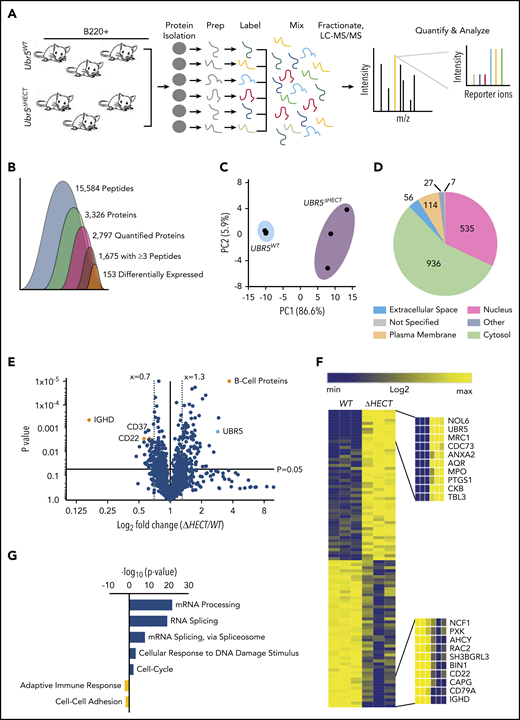
Loss of HECT domain results in a reduction in B-cell development proteins and an enrichment in proteins regulating mRNA splicing. (A) Schematic of sample preparation of spleens for TMT MS analysis (N = 3). (B) Quantification of identified peptides and proteins. (C) PCA using components 1 and 2 showing clustering of WT and ΔHECT samples for significantly upregulated proteins. (D) Pie chart of localizations for all 2797 proteins identified by mass spectometry. (E) Volcano plot of the log2 fold change ΔHECT/WT showing proteins significantly (P < .05) up- (≥1.3) and downregulated (≤0.7). (F) Heatmap of the significantly up- and downregulated proteins showing the top 10 upregulated and top 10 downregulated proteins. (G) Gene ontology analysis showing pathways known to be associated with significantly up- and downregulated proteins using DAVID 6.8 software. For upregulated proteins, includes pathways with ≥10 proteins associated and a P value ≤ .01. Downregulated proteins pathways with P value ≤ .05.
Loss of HECT domain results in a reduction in B-cell development proteins and an enrichment in proteins regulating mRNA splicing. (A) Schematic of sample preparation of spleens for TMT MS analysis (N = 3). (B) Quantification of identified peptides and proteins. (C) PCA using components 1 and 2 showing clustering of WT and ΔHECT samples for significantly upregulated proteins. (D) Pie chart of localizations for all 2797 proteins identified by mass spectometry. (E) Volcano plot of the log2 fold change ΔHECT/WT showing proteins significantly (P < .05) up- (≥1.3) and downregulated (≤0.7). (F) Heatmap of the significantly up- and downregulated proteins showing the top 10 upregulated and top 10 downregulated proteins. (G) Gene ontology analysis showing pathways known to be associated with significantly up- and downregulated proteins using DAVID 6.8 software. For upregulated proteins, includes pathways with ≥10 proteins associated and a P value ≤ .01. Downregulated proteins pathways with P value ≤ .05.
To identify interacting partners of UBR5 in MCL, we performed immunoprecipitation followed by MS using human MCL patient-derived cell lines, JEKO1 and MINO (Figure 6A).29,30 Of note, sequencing of MINO and JEKO1 revealed no mutations in UBR5. Using MCL cell lines allowed for a homogeneous B-cell population and circumvented limitations in protein quantity in primary cells for immunoprecipitation. We identified 115 proteins with ≥3 unique peptides and, similar to our TMT analysis, gene ontology analysis showed proteins enriched in mRNA splicing via the spliceosome (Figure 6B; supplementary Table 3). Comparing MS datasets revealed 89 proteins overlapping and 6 proteins were upregulated in the TMT study (Figure 6 C-E). Intriguingly, all 6 of the other identified proteins are associated with mRNA splicing (SF3B3, SMC2, PRPF8, DHX15, SNRNP200, and EFTUD2). These proteins are classified as core spliceosome components including U2 (SF3B3) and associated U5 small nuclear ribonucleoprotein (snRNP) complex (EFTUD2, SNRNP200, and PRPF8) (Figure 6E). Of the identified proteins, none have previously been characterized as UBR5 interactors or substrates, providing a novel pathway of UBR5 regulation.
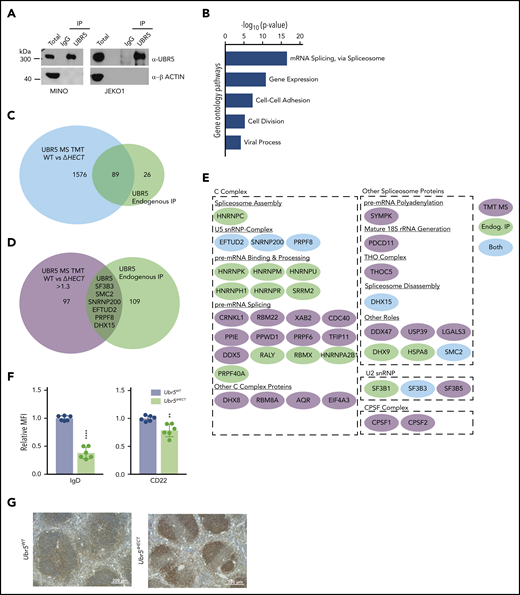
UBR5 interacts with spliceosome components. (A) Western blot of immunoprecipitation of UBR5 from MINO and JEKO1 MCL cell line used for MS analysis. MS experiment was performed in duplicate. (B) Gene ontology analysis of immunoprecipitated proteins. (C) Venn diagram showing the significant overlap of proteins identified in the TMT labeled UBR5WT and Ubr5ΔHECT MS and those identified in the UBR5 endogenous immunoprecipitation MS. (D) Venn diagram showing overlap of the proteins significantly upregulated (≥1.3, P < .05) in the Ubr5ΔHECT samples and those identified in the UBR5 endogenous IP. (E) Spliceosome-associated proteins found in endogenous immunoprecipitation and/or upregulated in spleen B220+ cells. (F) Bar graphs of relative MFI of cell surface markers of B220+ splenocytes (N = 6). (G) Representative immunohistochemistry staining of UBR5 in Ubr5WT and Ubr5ΔHECT spleens (N = 3). **P < .01, ****P < .0001.
UBR5 interacts with spliceosome components. (A) Western blot of immunoprecipitation of UBR5 from MINO and JEKO1 MCL cell line used for MS analysis. MS experiment was performed in duplicate. (B) Gene ontology analysis of immunoprecipitated proteins. (C) Venn diagram showing the significant overlap of proteins identified in the TMT labeled UBR5WT and Ubr5ΔHECT MS and those identified in the UBR5 endogenous immunoprecipitation MS. (D) Venn diagram showing overlap of the proteins significantly upregulated (≥1.3, P < .05) in the Ubr5ΔHECT samples and those identified in the UBR5 endogenous IP. (E) Spliceosome-associated proteins found in endogenous immunoprecipitation and/or upregulated in spleen B220+ cells. (F) Bar graphs of relative MFI of cell surface markers of B220+ splenocytes (N = 6). (G) Representative immunohistochemistry staining of UBR5 in Ubr5WT and Ubr5ΔHECT spleens (N = 3). **P < .01, ****P < .0001.
Alterations in splicing factors in B cells
Flow cytometry validated cell-surface markers associated with activation and maturation, CD22 and IgD, were significantly decreased in splenocytes (Figure 6F). UBR5 was the second highest expressed protein in MS; however, none of the identified peptides had coverage within the HECT domain. To confirm overexpression of UBR5 protein, we performed IHC and western blot analysis and found higher protein expression of UBR5 in Mb1WT/CRE;Ubr5ΔHECT/ΔHECT spleens (Figures 6G and7A). To determine if loss of HECT domain leads to stabilization of UBR5, we performed half-life analysis with cycloheximide. Mb1WT/CRE;Ubr5ΔHECT/ΔHECT CD23+ splenocytes had an increased protein half-life (Figure 7B). Stabilization of UBR5 could be due to loss of self-ubiquitination. To determine UBR5 ubiquitination, UBR5 was immunoprecipitated in Mb1WT/CRE;Ubr5WT/WT and Mb1WT/CRE;Ubr5ΔHECT/ΔHECT CD23+ splenocytes; however, changes in ubiquitin were not seen (supplemental Figure 5B). Further investigation is required to determine cause of UBR5 stabilization. Phosphorylation sites have been identified by MS on the C-terminus that are lost in the HECT mutant and may play a role in UBR5 stabilization (supplemental Figure 5C-D).31 These studies confirm that loss of the HECT domain leads to overexpression and stabilization of UBR5; however, the mechanism of UBR5 stabilization remains unknown.
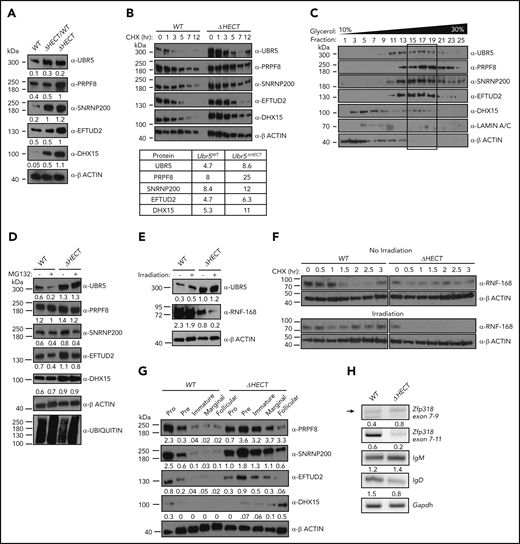
Loss of HECT domain leads to stabilization of U5 spliceosome. (A) Western blot of proteins identified in MS in splenic B cells (B220+) Mb1WT/CRE;Ubr5WT, Mb1WT/CRE;Ubr5ΔHECT/WT, and Mb1WT/CRE;Ubr5ΔHECT mice. (B) Western blot of UBR5 and spliceosome components in follicular B cells (B220+CD21+CD23+) Ubr5WT and Ubr5ΔHECT after treatment with cycloheximide with a table of average half-lives of UBR5 and spliceosome proteins. (C) 10% to 30% glycerol fractionation of nuclear lysate from HEK293T cells followed by western blot for UBR5 and spliceosome components. (D) Western blot of UBR5 and spliceosome components in follicular B cells (B220+CD21+CD23+) of Ubr5WT and Ubr5ΔHECT following MG132 treatment. (E) Western blot of UBR5 and known UBR5 substrate, RNF168, in follicular B cells (B220+CD21+CD23+) of Ubr5WT and Ubr5ΔHECT with or without irradiation exposure. (F) Half-life of RNF168 with cycloheximide treatment in follicular B cells (B220+CD21+CD23+) before and after irradiation exposure. (G) Western blot of spliceosome components in pro (B220+IgM−ckit+), pre (B220+IgM−CD25+), and immature (B220+IgMloIgD−) B-cell populations from the BM and marginal zone (B220+CD21+CD23−), and follicular (B220+CD21+CD23+) B-cell populations from the spleen. (H) RT-PCR of mRNA in Mb1WT/CRE;Ubr5WT and Mb1WT/CRE;Ubr5ΔHECT follicular B cells (B220+CD21+CD23+).
Loss of HECT domain leads to stabilization of U5 spliceosome. (A) Western blot of proteins identified in MS in splenic B cells (B220+) Mb1WT/CRE;Ubr5WT, Mb1WT/CRE;Ubr5ΔHECT/WT, and Mb1WT/CRE;Ubr5ΔHECT mice. (B) Western blot of UBR5 and spliceosome components in follicular B cells (B220+CD21+CD23+) Ubr5WT and Ubr5ΔHECT after treatment with cycloheximide with a table of average half-lives of UBR5 and spliceosome proteins. (C) 10% to 30% glycerol fractionation of nuclear lysate from HEK293T cells followed by western blot for UBR5 and spliceosome components. (D) Western blot of UBR5 and spliceosome components in follicular B cells (B220+CD21+CD23+) of Ubr5WT and Ubr5ΔHECT following MG132 treatment. (E) Western blot of UBR5 and known UBR5 substrate, RNF168, in follicular B cells (B220+CD21+CD23+) of Ubr5WT and Ubr5ΔHECT with or without irradiation exposure. (F) Half-life of RNF168 with cycloheximide treatment in follicular B cells (B220+CD21+CD23+) before and after irradiation exposure. (G) Western blot of spliceosome components in pro (B220+IgM−ckit+), pre (B220+IgM−CD25+), and immature (B220+IgMloIgD−) B-cell populations from the BM and marginal zone (B220+CD21+CD23−), and follicular (B220+CD21+CD23+) B-cell populations from the spleen. (H) RT-PCR of mRNA in Mb1WT/CRE;Ubr5WT and Mb1WT/CRE;Ubr5ΔHECT follicular B cells (B220+CD21+CD23+).
To evaluate protein overexpression of RNA splicing components, we performed western blot analysis on CD23+ splenocytes. Mb1WT/CRE;Ubr5ΔHECT/ΔHECT and Mb1WT/CRE;Ubr5ΔHECT/WT had increased protein expression of EFTUD2, SNRNP200, PRPF8, and DHX15 (Figure 7A). Of note, Mb1WT/CRE;Ubr5ΔHECT/WT spleens had increased UBR5 expression as well (Figure 7A). These findings are of significance because of MCL patient having monoallelic mutations of UBR5. Interestingly, MCL cell lines JEKO1 and MINO also express high levels of UBR5, EFTUD2, SNRNP200, PRPF8, and DHX15 protein compared with normal B cells, providing evidence that high expression is indicative of MCL (supplemental Figure 5A). Because 3 of the identified proteins (EFTUD2, SNRNP200, and PRPF8) are part of the U5 snRNP complex, we evaluated whether UBR5 elutes with the U5 complex. We performed a glycerol density gradient and found that EFTUD2, SNRNP200, PRPF8, and UBR5 eluted in fractions 15-19 alluding to components associating with 1 another (Figure 7C). Similar to Mb1WT/CRE;Ubr5ΔHECT/ΔHECT leading to increased half-life of UBR5, we determined that loss of the HECT domain leads to increased protein half-life of EFTUD2, SNRNP200, PRPF8, and DHX15 (Figure 7B). These combined findings propose that UBR5 interacts with the U5 complex and that loss of the HECT domain stabilizes the U5 complex.
To determine whether EFTUD2, SNRNP200, PRPF8, and DHX15 are ubiquitination targets of UBR5, we treated CD23+ splenocytes with MG132, a proteasome inhibitor. Upon MG132 treatment, accumulation of EFTUD2, SNRNP200, PRPF8, and DHX15 was not observed in WT nor Mb1WT/CRE;Ubr5ΔHECT/ΔHECT B cells (Figure 7D). Treatment with MG132 also did not increase the protein half-life of U5 components (supplemental Figure 5E). Immunoprecipitation of polyubiquitin using TR-TUBE agarose beads demonstrated decrease in polyubiquitinated SNRPN200 Mb1WT/CRE;Ubr5ΔHECT/ΔHECT B cells; however, it is unclear whether ubiquitin chain in K48 that would target the protein for proteasomal degradation (supplemental Figure 5F). The lack of accumulation of proteins following MG132 treatment or changes in protein half-life suggests UBR5 does not target the proteins for proteasomal degradation via K48 ubiquitin chains; however, other conjugation of K33, K63, K27, or K11 ubiquitin chains could potentially lead to stabilization of the protein.
Although the C-terminal cysteine of UBR5 in the HECT domain is lost in Mb1WT/CRE;Ubr5ΔHECT/ΔHECT mice, it is unclear whether catalytic activity is required for all UBR5 functions. It is known that UBR5 polyubiquitinates RNF168 in conjunction with E3 ligase TRIP12 following irradiation in the DNA damage response pathway.7 To determine whether mutant UBR5 is required for RNF168 ubiquitination, we irradiated CD23+ splenocytes and evaluated RNF168 expression. In Mb1WT/CRE;Ubr5ΔHECT/ΔHECT B cells, high UBR5 expression led to lower RNF168 expression that was further attenuated upon irradiation treatment (Figure 7E). Additionally, RNF168 half-life was significantly reduced in Mb1WT/CRE;Ubr5ΔHECT/ΔHECT B cells overexpressing UBR5 following irradiation and Mb1WT/CRE;Ubr5ΔHECT/ΔHECT B cells had increased in RNF168 polyubiquitination (Figure 7F; supplemental 5F). These studies demonstrate that UBR5 overexpression yields a similar phenotype to inhibition of RNF168 deubiquitinating enzyme USP34, supporting the conclusion that the catalytic cysteine in the UBR5 HECT domain is not required for RNF168 ubiquitin mediated degradation.32 Taken together, this suggests mutant UBR5 activity and function is substrate/complex dependent.
EFTUD2, SNRNP200, PRPF8, and DHX15 are expressed in early stages of B-cell development, predominantly in the pro/pre B cell stage, whereas in Mb1WT/CRE;Ubr5ΔHECT/ΔHECT B cells, they are more abundant in the immature and mature populations predicting alterations in splicing could affect B cells early in development (Figure 7G). Expression of IgM and IgD is regulated by alternative splicing of the Ig heavy chain locus. As shown in the follicular B-cell population, IgM and IgD have aberrant expression, suggesting defects in splicing. To confirm altered splicing, we isolated follicular B cells from Mb1WT/CRE;Ubr5ΔHECT/ΔHECT and WT littermates for analysis of transcript levels. PCR confirmed increased IgM and decreased IgD transcripts in Mb1WT/CRE;Ubr5ΔHECT/ΔHECT (Figure 7H). It was previously shown that mRNA of Zinc Finger Protein 318 (Zfp318) has 2 known splice variants.33 We found decreased expression of transcript spliced from exons 7-11, and decreased transcript containing exons 7-9, suggesting expression of Zfp318 splice variants may also be contributing to B-cell defects (Figure 7H). These studies demonstrate that over-expression of spliceosome components in UBR5 mutant B cells promote aberrant splicing.
Discussion
In this report, we demonstrate that ubiquitin E3 ligase UBR5 plays a key role in B-cell maturation and activation. Although UBR5 is present in all B-cell populations, deletion of Ubr5 HECT domain impacted specifically maturation of B cells within the spleen. The follicular B-cell population is phenotypically abnormal and has a reduced capacity to generate plasma cells. The block in differentiation of pre-GC B cells corresponds to the MCL tumor population. Although expression of EµCCND1 in the UBR5 mutant mice did not lead to lymphoma transformation, MCL patients with UBR5 mutations had between 4 and 12 additional mutations indicating additional mutations may be required for transformation. In addition, expression of EµCCND1 alone does not lead to lymphoma. Previous studies demonstrated Bim deletion in EµCCND1 mice resulted in an MCL-like disease. However, disease was found at a low frequency in mice >12 months old, further supporting additional mutations are required to drive disease.17 MCL is a pre-GC lymphoma and patients can vary in phenotype but are commonly IgMhiIgDloCD5+CD23−.26,27 Interestingly, pre-GC B cells express high levels of IgD, whereas MCL is IgDlo suggesting our mouse model, which is IgMhiIgDlo, has phenotypical characteristics of MCL. Of note, when we cross our mouse with EµCCND1 mice, a number of mice lose CD23 expression, similar to MCL, and the B1 population is rescued.
Interrogation of global proteomic changes in the splenic B-cell population suggests a novel role of UBR5 in mRNA splicing via the spliceosome. The spliceosome plays an important role in providing genetic diversity. In immune cells, alternative splicing is suggested to play a key role in B-cell differentiation, activation, and survival.34 In human B cells, ∼90% of genes with multiple exons undergo alternative splicing.35 Recurrent splicing mutations have been found in chronic lymphocytic leukemia (CLL) patients, another pre-GC B-cell malignancy where approximately 10% to 15% of patients have mutations to the U2 spliceosome component SF3B1. Interestingly, SF3B1 mutations lead to defects in B-cell development, suggesting that the U2 complex plays a key role in proper B-cell development.36,37 CLL patients have mutations at low frequency in other splicing components including PRPF8 and EFTUD2.38,39 The striking phenotype of IgD in HECT domain mutants supports defects in splicing since IgM and IgD are generated from alternative splicing of the heavy chain gene.40 It is well established that IgM and IgD play a key role in immunity and are required for B-cell receptor signaling and immune response, but little is known regarding how alternative splicing of IgD and IgM occur.
UBR5 has been mainly associated with ubiquitin dependent functions, but also plays a role in ubiquitin independent functions. Molecular pathways regulated by UBR5 include DNA damage repair, microRNA silencing, transcription, and translation.6,7,11,41-43 Our findings suggest mutant UBR5 interacts with the U5 spliceosome complex and mutations lead to stabilization of EFTUD2, SNRNP200, PRPF8, and DHX15. Although our data allude to interaction of UBR5 with the U5 spliceosome, we do not find alterations in ubiquitination of U5 in mutant UBR5; however, this does not exclude a direct ubiquitin dependent or independent effect of UBR5 on U5 spliceosome components. Further investigation is required to decipher the mechanism promoting stabilization of U5 and the role of UBR5. UBR5 is found in complex with additional E3 ligases and although the ubiquitin conjugating cysteine in the HECT is lost, we found UBR5 does not always require its catalytic cysteine for substrate ubiquitination; and in the case of RNF168, overexpression of mutant UBR5 leads to increased ubiquitination where the ubiquitin is potentially transfered from another component of the complex.7,44 This suggests the gain of function vs loss of function of mutant UBR5 is substrate/complex dependent.
Patient mutations in UBR5 are monoallelic indicating the Mb1WT/CRE;Ubr5ΔHECT/WT mouse phenotype would be more representative to patient mutations. As with Mb1WT/CRE;Ubr5ΔHECT/ΔHECT, Mb1WT/CRE;Ubr5ΔHECT/WT mice had defects in B-cell maturation and overexpressed spliceosome components indicating the mutant protein acts as a dominant negative over the WT protein. UBR5 is commonly overexpressed in solid tumors that correlates with data presented herein where HECT mutations lead to protein stabilization and overexpression indicating Ubr5ΔHECT/ΔHECT mouse model could provide additional clues to the role of UBR5 in cancer.12,14,15 Overall, our findings reveal a novel mechanism of regulation by UBR5 in B-cell maturation and provides a key understanding of the role of UBR5 mutations in MCL.
The mass spectrometry proteomics data have been deposited to the ProteomeXchange Consortium via the PRIDE partner repository with the dataset identifier PXD014307.
The online version of this article contains a data supplement.
The publication costs of this article were defrayed in part by page charge payment. Therefore, and solely to indicate this fact, this article is hereby marked “advertisement” in accordance with 18 USC section 1734.
Acknowledgments
The authors thank M. Reth for the use of the Mb1CRE mice, S. Korolov for helpful discussions and providing Mb1CRE mice, S. Katz for EµCCND1 mice, and P. Swanson (Creighton University, Omaha, NE), for helpful discussions. The authors also thank the UNMC Flowcytometry Research Facility, UNMC Mouse Genome Engineering Core Facility, and UNMC Mass Spectrometry and Proteomics Core Facility for expert assistance.
The core facilities are administrated through the Office of the Vice Chancellor for Research and supported by state funds from the Nebraska Research Initiative and The Fred and Pamela Buffett Cancer Center's National Cancer Institute Cancer Support Grant. This work was supported by the National Institutes of Health, National Institute of General Medical Sciences (P20GM121316) (S.M.B., N.T.W.), an American Cancer Society institutional grant, the Frances E. Lageschulte & Evelyn B. Weese New Frontiers Medical Research Fund, a UNMC National Institutes of Health National, Cancer Institute training grant (5T32CA009476-23) (W.H.S.), and the Fred & Pamela Buffett Cancer Center Support Grant from the National Institutes of Health, National Cancer Institute (P30 CA036727).
Authorship
Contribution: S.A.S., T.J.G., and S.M.B. conceived and designed the experiments; S.A.S., T.J.G., H.V., J.H.G., M.R.G., and S.M.B. performed experiments and analysis; S.A.S., T.J.G., R.W.H.-S., and S.M.B. wrote the manuscript; H.C.-H.L., C.A., and N.T.W. provided technical and material support; and all authors reviewed the manuscript before submission.
Conflict-of-interest disclosure: The authors declare no competing financial interests.
Correspondence: Shannon M. Buckley, Department of Genetics, Cell Biology, and Anatomy, University of Nebraska Medical Center, 985805 Nebraska Medical Center, Omaha, NE 68198; e-mail: shannon.buckley@unmc.edu.

This feature is available to Subscribers Only
Sign In or Create an Account Close Modal