

Key Points
Measurable residual disease monitoring is of prognostic relevance in NPM1mut acute myeloid leukemia patients.
Gemtuzumab ozogamicin given to intensive therapy led to better clearance of NPM1mut transcript level, resulting in a lower relapse rate.

Abstract
Monitoring of measurable residual disease (MRD) provides prognostic information in patients with Nucleophosmin1-mutated (NPM1mut) acute myeloid leukemia (AML) and represents a powerful tool to evaluate treatment effects within clinical trials. We determined NPM1mut transcript levels (TLs) by quantitative reverse-transcription polymerase chain reaction and evaluated the prognostic impact of NPM1mut MRD and the effect of gemtuzumab ozogamicin (GO) on NPM1mut TLs and the cumulative incidence of relapse (CIR) in patients with NPM1mut AML enrolled in the randomized phase 3 AMLSG 09-09 trial. A total of 3733 bone marrow (BM) samples and 3793 peripheral blood (PB) samples from 469 patients were analyzed. NPM1mut TL log10 reduction ≥ 3 and achievement of MRD negativity in BM and PB were significantly associated with a lower CIR rate, after 2 treatment cycles and at end of treatment (EOT). In multivariate analyses, MRD positivity was consistently revealed to be a poor prognostic factor in BM and PB. With regard to treatment effect, the median NPM1mut TLs were significantly lower in the GO-Arm across all treatment cycles, resulting in a significantly greater proportion of patients achieving MRD negativity at EOT (56% vs 41%; P = .01). The better reduction in NPM1mut TLs after 2 treatment cycles in MRD positive patients by the addition of GO led to a significantly lower CIR rate (4-year CIR, 29.3% vs 45.7%, P = .009). In conclusion, the addition of GO to intensive chemotherapy in NPM1mut AML resulted in a significantly better reduction in NPM1mut TLs across all treatment cycles, leading to a significantly lower relapse rate.
Introduction
Nucleophosmin1 mutations (NPM1mut) represent one of the most frequent recurrent gene mutations in acute myeloid leukemia (AML).1-3 Based on characteristic clinical and biological features,1 NPM1mut AML has been incorporated into the revised 2016 World Health Organization classification4 as a defined disease entity. NPM1mut has been shown to be a stable marker over time and, in most cases, is maintained at relapse.5,6 AMLs with NPM1mut frequently carry mutations in DNA methylation and hydroxymethylation genes, most frequently DNMT3A, followed by IDH1 and IDH2R140, as well as in signaling genes (FLT3, NRAS, PTPN11).2,3 One of the most clinically relevant comutations was internal tandem duplications (ITDs) of the FLT3 gene (FLT3-ITD). Distinct NPM1mut/FLT3-ITD genotypes have been defined by the 2017 European LeukemiaNet (ELN) classification,7 categorizing NPM1mut AML as favorable (if associated with FLT3-ITD low [<0.5] allelic ratio) or as intermediate risk (high [≥0.5] ITD allelic ratio).
Because of its homogeneous mutation pattern, NPM1mut represent an ideal target for monitoring of measurable residual disease (MRD). Several studies have demonstrated the prognostic impact of NPM1mut transcript levels (TLs), which provide information that is independent of the genetic risk profile at diagnosis.8-14 According to the 2017 ELN AML recommendations7 and the consensus document of the ELN MRD Working Party,15 MRD monitoring should be performed in NPM1mut AML patients at defined time points: after 2 cycles of intensive therapy, at the end of treatment (EOT), and during follow-up (FU). Based on the prognostic significance of MRD data,16-18 the 2017 ELN recommendations7 introduced a new response criterion: complete remission (CR) with MRD negativity.
In addition to its prognostic relevance, assessment of MRD provides a powerful tool to evaluate treatment effects within clinical trials investigating novel therapies.7,15 In a companion study of the French ALFA-0701 trial, which randomized patients 50 to 70 years of age to induction chemotherapy with or without fractionated doses of gemtuzumab ozogamicin (GO), followed by 2 cycles of consolidation with daunorubicin and cytarabine with or without GO, the proportion of patients achieving MRD negativity was significantly higher in patients treated with GO, both after induction and at EOT.14,19
We recently reported the first results from the AMLSG 09-09 study,20 in which 588 evaluable patients with newly diagnosed NPM1mut AML were randomized to intensive chemotherapy plus all-trans retinoic acid (ATRA), with or without GO. The trial did not reach its primary end point, a significant improvement in event-free survival; however, the cumulative incidence of relapse (CIR) was reduced significantly by GO. In this study, we assessed the clinical relevance of NPM1mut MRD in patients randomized for the addition of GO within the AMLSG 09-09 trial.
Materials and methods
Patient selection
The AMLSG 09-09 trial (NCT00893399)20 was a prospective randomized open-label multi-institutional study of the German-Austrian AML Study Group (AMLSG) for patients ≥18 years of age with newly diagnosed NPM1mut AML considered eligible for intensive chemotherapy.
Treatment on the Standard-Arm included 2 cycles of induction therapy with ATRA, idarubicin, cytarabine, and etoposide, followed by up to 3 consolidation cycles of high-dose cytarabine with ATRA. On the GO-Arm, GO was given on day 1 (3 mg/m2) during the 2 induction cycles and the first consolidation cycle.20
Patients were included in this MRD study based on the availability of a diagnostic sample and ≥1 subsequent bone marrow (BM) or peripheral blood (PB) sample and the achievement of a CR or CR with incomplete blood count recovery (CRi) after induction therapy.
All patients gave informed consent according to the Declaration of Helsinki. Approval was obtained from the institutional review boards of the participating AMLSG institutions.
Detection of NPM1mut TLs and mutational analysis
The NPM1mut status was determined at diagnosis as part of the fast molecular screening within the AMLSG BiO Registry (NCT01252485) by locked nucleic acid–based polymerase chain reaction (PCR) at the time of diagnosis.7,21,22 For quantification of NPM1mut ribonucleic acid, we applied and modified the quantitative reverse-transcription PCR (RQ-PCR) assay designed by Gorello et al,23 using a common forward primer and probe in combination with mutation-specific reverse primers. This resulted in highly specific amplification of the NPM1 mutation; no unspecific amplification of wild-type NPM1 was seen in >50 control samples. The control gene was Abelson 1 (ABL1).24 NPM1mut TLs were defined as (NPM1mut transcripts/ABL1 transcripts) × 104. The sensitivity of our assay was 10−5 (type 4) up to 10−6 (types A, B, C, D, Jt, Qm, Nm, and Km). A detailed description of the RQ-PCR protocol is included in the supplement (available on the Blood Web site). For sample availability, see supplemental Table 1. DNMT3A (DNMT3Amut) and FLT3-ITD mutation screening was performed as described.25,26
Statistical analyses
We performed landmark analyses with regard to the prognostic impact of NPM1mut MRD status at the recommended time points: after 2 treatment cycles and at EOT. The primary end point of interest was CIR, which was defined according to recommended criteria.7 Differences between groups were evaluated using Gray’s test.27 CIR was evaluated as an exploratory end point, because the primary objective of the trial has not been met. Multivariate analyses were performed to identify prognostic variables for the competing events relapse and death in CR/CRi. Pairwise comparisons were performed using the Mann-Whitney U test for continuous variables and Fisher’s exact test for categorical variables. The Wilcoxon signed-rank test was used for paired comparisons of NPM1mut TLs in BM vs PB. An effect was considered statistically significant at P < .05.
Additional details about statistical analyses are provided in the supplement.
Results
Patient characteristics
In total, 469 (Standard-Arm: n = 237 patients; GO-Arm: n = 232 patients) of 588 patients were eligible for this analysis; 119 patients were not included because of a lack of sufficient material (n = 46) or failure to achieve CR or CRi after 2 cycles (n = 73).
Both study arms were well balanced with regard to clinical and disease variables (Table 1). FLT3-ITD were underrepresented (15%), because patients with FLT3-ITD were assigned to the AMLSG 16-10 trial.28 For postremission therapy, the majority of patients (n = 394; 84%) received up to 3 cycles of high-dose cytarabine, only 33 (7%) patients had an allogeneic hematopoietic cell transplantation in first CR/CRi, and 42 (9%) patients did not receive consolidation treatment.
Patient characteristics
| Characteristics | Standard-Arm (n = 237) | GO-Arm (n = 232) | P |
|---|---|---|---|
| Age, median (range), y | 58.6 (20.9-78.4) | 57.5 (19.3-82.3) | .67 |
| Age group, y | .76 | ||
| 18-60 | 138 (58) | 136 (59) | |
| 61-70 | 61 (26) | 64 (28) | |
| >70 | 38 (16) | 32 (14) | |
| Sex | .23 | ||
| Female | 120 (51) | 131 (56) | |
| Male | 117 (49) | 101 (44) | |
| Type of AML | .64 | ||
| De novo AML | 215 (91) | 206 (89) | |
| Secondary AML | 16 (7) | 21 (9) | |
| Therapy-related AML | 5 (2) | 5 (2) | |
| Missing | 1 | 0 | |
| White blood cell count, median (range), × 109/L | 18.1 (0.7-295.8) | 16.8 (0.6-278.9) | .97 |
| Platelets, × 109/L | .59 | ||
| Median (range) | 75 (8-660) | 75 (7-404) | |
| Missing | 0 | 1 | |
| Hemoglobin, g/dL | .17 | ||
| Median (range) | 9.4 (4.3-19.3) | 9.1 (4.4-15) | |
| Missing | 1 | 0 | |
| Blasts in BM, %* | .75 | ||
| Median (range) | 70 (16-100) | 75 (0-100) | |
| Missing | 5 | 7 | |
| LDH, U/L | .28 | ||
| Median (range) | 440 (86-5650) | 421 (137-7371) | |
| Missing | 1 | 1 | |
| Cytogenetics | .65 | ||
| Normal karyotype | 192 (89) | 187 (86) | |
| Other karyotypes | 22 (10) | 30 (14) | |
| Complex karyotype | 1 (<1) | 1 (<1) | |
| Missing | 22 | 14 | |
| FLT3-ITD | .22 | ||
| FLT3-ITD negative | 197 (83) | 200 (87) | |
| FLT3-ITD low (allelic ratio < 0.5) | 15 (6) | 16 (7) | |
| FLT3-ITD high (allelic ratio ≥ 0.5) | 25 (11) | 14 (6) | |
| Missing | 0 | 2 | |
| DNMT3A | .06 | ||
| DNMT3A wild-type | 95 (58) | 77 (47) | |
| DNMT3A mutated | 68 (42) | 86 (53) | |
| Missing | 74 | 69 | |
| FLT3-TKD | .16 | ||
| FLT3-TKD wild-type | 213 (90) | 198 (85) | |
| FLT3-TKD mutated | 24 (10) | 34 (15) | |
| Missing | 0 | 0 |
Unless otherwise noted, data are n (%).
LDH, lactate dehydrogenase; TKD, tyrosine kinase domain.
If BM blasts < 20%, diagnosis of AML was established based on extramedullary disease or PB blood blasts ≥ 20%.
Prognostic impact of NPM1mut TLs after 2 treatment cycles
First, we focused on the impact of NPM1mut TLs log10 reduction, determined from diagnosis to the end of the second treatment cycle. In landmark analyses, a ≥3-log10 reduction in NPM1mut TLs in BM or PB was significantly associated with a lower 4-year CIR rate (BM: 28.5% vs 60%, P < .0001; PB: 33.9% vs 62.5%, P = .01) (Figure 1).
![Impact of NPM1mut TL log10 reduction on CIR after 2 induction cycles. Significantly fewer relapses occurred in patients achieving a ≥3-log10 reduction (blue curve) in NPM1mut TLs than in patients with a log10 reduction < 3 (red curve) in BM (A) (4-year CIR rate, 28.5%; 95% confidence interval [CI], 22.6%-34.4% vs 60%; 95% CI, 43.5%-76.4%; P < .0001) and PB (B) (4-year CIR rate, 33.9%; 95% CI, 27.7%-40.1% vs 62.5%; 95% CI, 38.4%-86.6%; P = .01). Shaded area represents 95% CI.](https://ash.silverchair-cdn.com/ash/content_public/journal/blood/136/26/10.1182_blood.2020005998/1/m_bloodbld2020005998f1.png?Expires=1767702837&Signature=uw-VdqimUr-UU8qpQrwddlnEJ0yVCvddmcAkErJPHElksLH-3zlDse1J4sHQoe89llhJ6DlP0oMSqmZROFKxp8GiLLU8Aa329XTa~oJDlDqIK4ZU7oXnMc3FHVqv29YIph~A3szSQFJbKSWxNCB19ibBK43Mi4csnOSMWRf4wyuWa1TjIhJSTDdfLQOcjVTFeiNivA9pLXFo7v9PWb6DzDN4yCvDOBiFwPTQ7yKznOTApdzpmWGmu3x9VUScGPUNp0OukyzmY0WV0QYeNcatnR82xKownfE-2XrQUOpGKGUAx2ZRNswcAiw40kr7W~C5VPSVzlhXaeSlvdJN4uor3w__&Key-Pair-Id=APKAIE5G5CRDK6RD3PGA)
Impact of NPM1mut TL log10 reduction on CIR after 2 induction cycles. Significantly fewer relapses occurred in patients achieving a ≥3-log10 reduction (blue curve) in NPM1mut TLs than in patients with a log10 reduction < 3 (red curve) in BM (A) (4-year CIR rate, 28.5%; 95% confidence interval [CI], 22.6%-34.4% vs 60%; 95% CI, 43.5%-76.4%; P < .0001) and PB (B) (4-year CIR rate, 33.9%; 95% CI, 27.7%-40.1% vs 62.5%; 95% CI, 38.4%-86.6%; P = .01). Shaded area represents 95% CI.
Impact of NPM1mut TL log10 reduction on CIR after 2 induction cycles. Significantly fewer relapses occurred in patients achieving a ≥3-log10 reduction (blue curve) in NPM1mut TLs than in patients with a log10 reduction < 3 (red curve) in BM (A) (4-year CIR rate, 28.5%; 95% confidence interval [CI], 22.6%-34.4% vs 60%; 95% CI, 43.5%-76.4%; P < .0001) and PB (B) (4-year CIR rate, 33.9%; 95% CI, 27.7%-40.1% vs 62.5%; 95% CI, 38.4%-86.6%; P = .01). Shaded area represents 95% CI.
Fifty-nine of 370 (16%) patients and 161 of 341 (47%) patients became MRD negative in BM and PB. The 4-year CIR rate was 25.3% for patients achieving MRD negativity in BM vs 37.9% for MRD-positive patients (P = .03) (Figure 2A). MRD negativity in PB was also associated with a significantly lower 4-year CIR (18.4% vs 53.4%; P < .0001) (Figure 2B).
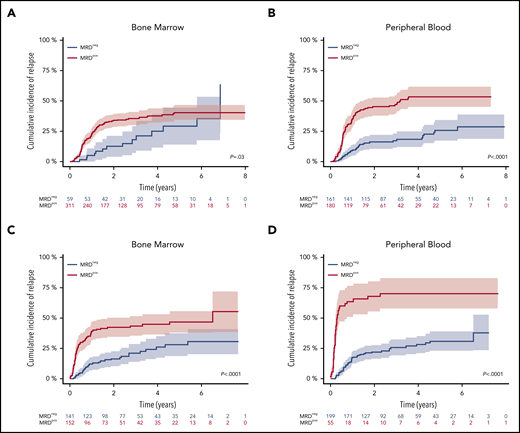
Impact of NPM1mut MRD negativity on CIR after 2 induction cycles and at EOT. Patients achieving MRD negativity (MRDneg, blue curve) had a significantly lower CIR rate compared with patients with MRD positivity (MRDpos, red curve) after 2 induction cycles (A-B) and at EOT (C-D). This was true for BM (A,C) (after 2 cycles: 4-year CIR rate, 25.3%; 95% CI, 11.2%-39.4% vs 37.9%; 95% CI, 32.1%-43.8%; P = .03; EOT: 4-year CIR rate, 26%; 95% CI, 17.1%-34.9% vs 44.7%; 95% CI, 36.3%-53.1%; P < .0001) and for PB (B,D) (after 2 cycles: 4-year CIR rate, 18.4%; 95% CI, 12.0%-24.9% vs 53.4%; 95% CI, 45.2%-61.6%; P < .0001; EOT: 4-year CIR rate, 28.2%; 95% CI, 20.9%-35.4% vs 70.3%; 95% CI, 57.6%-83.1%; P < .0001). Shaded area represents 95% CI.
Impact of NPM1mut MRD negativity on CIR after 2 induction cycles and at EOT. Patients achieving MRD negativity (MRDneg, blue curve) had a significantly lower CIR rate compared with patients with MRD positivity (MRDpos, red curve) after 2 induction cycles (A-B) and at EOT (C-D). This was true for BM (A,C) (after 2 cycles: 4-year CIR rate, 25.3%; 95% CI, 11.2%-39.4% vs 37.9%; 95% CI, 32.1%-43.8%; P = .03; EOT: 4-year CIR rate, 26%; 95% CI, 17.1%-34.9% vs 44.7%; 95% CI, 36.3%-53.1%; P < .0001) and for PB (B,D) (after 2 cycles: 4-year CIR rate, 18.4%; 95% CI, 12.0%-24.9% vs 53.4%; 95% CI, 45.2%-61.6%; P < .0001; EOT: 4-year CIR rate, 28.2%; 95% CI, 20.9%-35.4% vs 70.3%; 95% CI, 57.6%-83.1%; P < .0001). Shaded area represents 95% CI.
Prognostic impact of NPM1mut TLs at the EOT and during FU
At the EOT, 141 of 293 (48%) patients were MRD-negative in the BM and 199 of 254 (78%) patients in the PB. The 4-year CIR rate was significantly lower in MRD-negative patients (BM: 26% vs 44.7%, P < .0001; PB: 28.2% vs 70.3%, P < .0001) (Figure 2C-D). The median FU time for patients in sustained first CR (n = 301/469) was 3.2 years (95% CI, 2.9-3.7), which was determined from the end of the second induction cycle.
To assess relapse risk during FU, we validated our previously defined cutoff value of ≥200 NPM1mut TLs in BM and PB.9 In these descriptive analyses, the 4-year CIR rate for patients with NPM1mut TL ≥ 200 in at least 1 BM sample during FU (n = 75) was 67.1% (95% CI, 55.3-78.9) and it was 71% (95% CI, 58.9-82.2) for PB samples (n = 72) (Figure 3). The median time to relapse was 3.8 and 3.0 months, respectively, as determined from the first sample exceeding the cutoff value. In contrast, the majority of MRD-positive patients with NPM1mut TLs < 200 remained in CR (BM: 95/115 [83%]; PB: 73/90 [81%]). Of 107 (BM) and 140 (PB) patients with repetitive MRD-negative samples, only 11 and 13 patients relapsed. Loss of NPM1mut at the time of relapse was observed in 2 patients with available material.
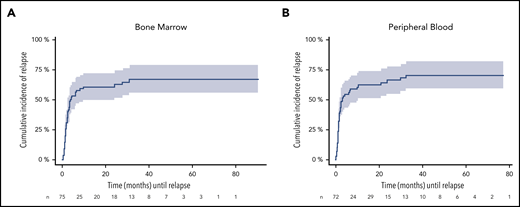
CIR during FU for patients exceeding the cutoff ≥ 200 NPM1mut TLs. A total of 75 and 72 patients in remission exceeded the cutoff in ≥1 BM (A) and/or PB (B) sample. The cutoff is highly predictive for relapse in BM (4-year CIR rate, 67.1%; 95% CI: 55.3-78.9) and PB (4-year CIR rate; 71%; 95% CI: 58.9-82.2), with a median time to relapse of 3.8 and 3 months (BM: 95% CI, 0.4-30.8 months; PB: 95% CI, 0.3-32.4 months) determined from the first sample exceeding the cutoff value. Shaded area represents 95% CI.
CIR during FU for patients exceeding the cutoff ≥ 200 NPM1mut TLs. A total of 75 and 72 patients in remission exceeded the cutoff in ≥1 BM (A) and/or PB (B) sample. The cutoff is highly predictive for relapse in BM (4-year CIR rate, 67.1%; 95% CI: 55.3-78.9) and PB (4-year CIR rate; 71%; 95% CI: 58.9-82.2), with a median time to relapse of 3.8 and 3 months (BM: 95% CI, 0.4-30.8 months; PB: 95% CI, 0.3-32.4 months) determined from the first sample exceeding the cutoff value. Shaded area represents 95% CI.
At 3 months of FU, half of the patients with NPM1mut TL < 200 achieved MRD negativity within 12 months (BM: 39/70; PB: 13/25). Forty-five of 143 (BM) patients and 69 of 174 (PB) patients with MRD negativity at this early FU showed a conversion to MRD positivity at the later FU. Relapse occurred in ∼70% of patients with ≥1-log increase in NPM1mut TL or NPM1mut TL ≥ 200. In 23 of 45 patients (BM) and 29 of 69 patients (PB), MRD positivity was only temporary.
Comparison of NPM1mut TLs in BM and PB
Using a paired Wilcoxon test, we found a significant difference of 0.2- to 1.5-log10 (P < .0001) at diagnosis, after 2 induction cycles, at EOT, and at FU, with consistently higher NPM1mut TLs in BM compared with PB (supplemental Figure 1).
Impact of GO on NPM1mut TLs and on outcome
We further assessed the impact of treatment with GO on the kinetics of NPM1mut TLs and on the achievement of MRD negativity. Following the first induction cycle, patients in the GO-Arm had significantly lower median NPM1mut TLs in BM (Figure 4) and PB (supplemental Figure 2) compared with patients on the Standard-Arm; this effect was maintained throughout all subsequent treatment cycles. This was reflected by a significantly lower 4-year CIR rate in patients treated in the GO-Arm (31.6% vs 43.9% in Standard-Arm; P = .015) and by a superior relapse-free survival (RFS) (4-yrs RFS: 60.5% vs 48.9%; P = .028) (supplemental Figure 3).
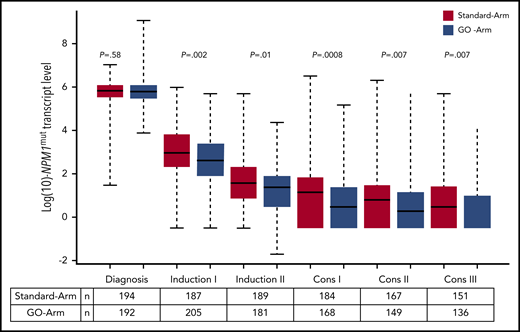
Kinetics of NPM1mut TLs in BM according to treatment arm. Depicted in red are patients randomized to the Standard-Arm, and in blue patients treated on the GO-Arm. Following the first induction cycle, median NPM1mut TLs were significantly lower in patients randomized to the GO-Arm compared with the Standard-Arm throughout all subsequent treatment cycles. Cons, consolidation cycle.
Kinetics of NPM1mut TLs in BM according to treatment arm. Depicted in red are patients randomized to the Standard-Arm, and in blue patients treated on the GO-Arm. Following the first induction cycle, median NPM1mut TLs were significantly lower in patients randomized to the GO-Arm compared with the Standard-Arm throughout all subsequent treatment cycles. Cons, consolidation cycle.
Predictive impact after 2 treatment cycles
After 2 induction cycles, there was a significantly better log10 reduction in NPM1mut TLs in the GO-Arm (Figure 4); more patients achieved MRD negativity in PB (57% vs 38%, GO-Arm vs Standard-Arm, respectively; P = .0008) but not in BM (17% vs 15%; P = .57) (supplemental Table 2). The better reduction in NPM1mut TLs resulted in a lower relapse rate in the GO-Arm (BM: 27% vs 44%, P = .007; PB: 32% vs 42%, P = .11).
For patients achieving MRD negativity in BM, no difference in CIR rates between treatment arms was observed (P = .56, Gray’s test). However, 4-year CIR rate in patients who still had detectable NPM1mut TLs was significantly lower on the GO-Arm compared with patients on the Standard-Arm (29.3% vs 45.7%; P = .009) (Figure 5). This may be due to the better reduction in NPM1mut TLs after each of the subsequent treatment cycle. NPM1mut TLs in PB did not show differences in the CIR rates between the 2 treatment arms.
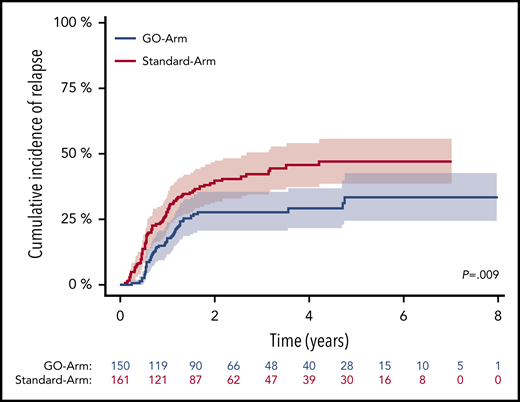
CIR after 2 induction cycles in patients with still detectable MRD in BM by treatment arm. Patients with detectable MRD treated on the GO-Arm (blue curve) had a significantly lower CIR compared with patients on the Standard-Arm (red curve) (4-year CIR rate, 29.3%; 95% CI, 21.5%-37.0% vs 45.7%; 95% CI, 37.3%-54.0%; P = .009). Shaded area represents 95% CI.
CIR after 2 induction cycles in patients with still detectable MRD in BM by treatment arm. Patients with detectable MRD treated on the GO-Arm (blue curve) had a significantly lower CIR compared with patients on the Standard-Arm (red curve) (4-year CIR rate, 29.3%; 95% CI, 21.5%-37.0% vs 45.7%; 95% CI, 37.3%-54.0%; P = .009). Shaded area represents 95% CI.
Multivariate analysis revealed that MRD positivity, FLT3-ITD with high (≥0.5) allelic ratio (FLT3-ITDhigh), older age, and DNMT3Amut were prognostic factors for a higher relapse risk, in BM and PB. In BM, treatment with GO was an additional prognostic factor; it was associated with a lower relapse rate (Table 2). The risk of death in CR was increased in patients with FLT3-ITDhigh but not in patients randomized to GO (supplemental Table 3).
Results of cause-specific Cox regression analysis for relapse after 2 induction cycles and at EOT
| Variable | BM | PB | ||||||||||
|---|---|---|---|---|---|---|---|---|---|---|---|---|
| After 2 induction cycles | At EOT | After 2 induction cycles | At EOT | |||||||||
| HR | 95% CI | P | HR | 95% CI | P | HR | 95% CI | P | HR | 95% CI | P | |
| Randomizationto GO-Arm | .58 | .39-.84 | .004 | .63 | .4-1.00 | .05 | .79 | .54-1.16 | .23 | .62 | .38-1.02 | .057 |
| MRDposin BM | 1.82 | 1.01-3.26 | .04 | 2.41 | 1.55-3.77 | .0001 | 3.12 | 2.04-4.79 | <.0001 | 5.50 | 3.44-8.79 | <.0001 |
| FLT3-ITDpos (AR ≥ .5) | 2.17 | 1.13-4.18 | .02 | 2.36 | 1.03-5.44 | .04 | 2.41 | 1.17-4.94 | .016 | 3.06 | 1.38-6.80 | .005 |
| FLT3-TKDmut | 1.19 | .68-2.08 | .53 | .91 | .49-1.7 | .77 | .80 | .43-1.52 | .49 | .69 | .34-1.41 | .31 |
| DNMT3Amut | 2.73 | 1.72-4.34 | <.0001 | 2.14 | 1.29-3.53 | .003 | 3.01 | 1.86-4.89 | <.0001 | 3.27 | 1.85-5.80 | <.0001 |
| Age* | 1.48 | 1.25-1.76 | <.0001 | 1.51 | 1.24-1.85 | <.0001 | 1.52 | 1.28-1.82 | <.0001 | 1.31 | 1.06-1.62 | .01 |
| WBC† | .98 | .72-1.33 | .89 | .94 | .66-1.33 | .71 | .98 | .73-1.31 | .88 | .94 | .68-1.31 | .73 |
| LDH† | 1.86 | .84-4.14 | .12 | 1.62 | .67-3.9 | .28 | 1.64 | .67-3.99 | .27 | 1.12 | .45-2.81 | .80 |
| BM blasts | .99 | .99-1.00 | .07 | .99 | .98-1.00 | .15 | .99 | .98-1.00 | .08 | 1.00 | .99-1.01 | .83 |
AR, allelic ratio; HR, hazard rate; LDH, lactate dehydrogenase; MRDpos, MRD positivity; TKD, tyrosine kinase domain; WBC, white blood cell count.
MRD status was determined at the respective time point; FLT3-ITD and FLT3-TKD mutation status, DNMT3A mutation status, BM blasts, age, serum LDH, and WBC count were determined at diagnosis.
Increase of 10 years of age.
Log10-transformed continuous variables.
Predictive impact at EOT
At EOT, significantly more patients on the GO-Arm achieved MRD negativity in BM (56% vs 41%, GO-Arm vs Standard-Arm, respectively; P = .01) and PB (85% vs 72%; P = .02) (supplemental Table 2). This translated into a significantly lower CIR rate (BM: 28% vs 42%, P = .03; PB: 28% vs 46%, P = .01).
In multivariate analysis for relapse using cause-specific Cox models, MRD persistence, FLT3-ITDhigh, older age, and DNMT3Amut were significant variables for a higher risk for relapse, irrespective of the material analyzed. In BM and PB, randomization to GO was a prognostic factor for lower risk of relapse (Table 2). FLT3-ITDhigh and MRD persistence in PB were associated with a higher risk for death in CR (supplemental Table 3).
Predictive impact during FU
During FU, more patients exhibited sustained MRD negativity on the GO-Arm (BM: 41% vs 30%, P = .06; PB: 51% vs 39%, P = .05) (supplemental Table 4). The 4-year CIR rate for patients with ≥200 NPM1mut TLs in the BM or PB was not influenced by the addition of GO (BM: 61% vs 71%; PB: 69% vs 71%), with equivalent median time to relapse (BM: 3.5 vs 3.8 months; PB: 3.0 vs 2.3 months).
Impact of concurrent DNMT3A mutation
In this explorative analysis, we focused on BM samples and 2 molecularly defined subgroups: patients with NPM1mut sole (NPM1mut-sole) without concurrent FLT3-ITD or DNMT3Amut and patients with concurrent DNMT3Amut (NPM1mut/DNMT3Amut). Because of the small number of patients with FLT3-ITD, subgroup analysis could not be performed for the triple genotype (NPM1mut/DNMT3Amut/FLT3-ITD). Beginning from the second treatment cycle, patients with NPM1mut-sole had lower NPM1mut TLs compared with NPM1mut/DNMT3Amut patients (supplemental Table 4). This resulted in a significantly higher proportion of patients achieving MRD negativity in the NPM1mut-sole group after 2 cycles (19.0% vs 8.3%; P = .02) and at EOT (52.1% vs 36%; P = .04). This better clearance of NPM1mut TLs after 2 cycles was associated with a better 4-year CIR rate for patients with NPM1mut-sole (25.9% vs 48%; P = .0003) (supplemental Figure 5). The same was true at trend in EOT (4-year CIR 29.7% vs 39.7%; P = .07).
Achievement of MRD negativity was only increased by GO in NPM1mut-sole patients (after 2 cycles: 13% vs 27%, Standard-Arm vs GO-Arm, respectively; P = .09; at EOT: 43% vs 69%, P = .02), whereas we did not observe a significant impact of GO in NPM1mut/DNMT3Amut patients (supplemental Table 5).
Discussion
We present the results of an exploratory analyses of MRD monitoring in 469 patients with NPM1mut AML treated within the prospective AMLSG 09-09 trial,20 evaluating standard intensive chemotherapy plus ATRA and randomization for GO.
We performed longitudinal NPM1mut MRD monitoring by RQ-PCR and confirmed its high clinical relevance at 2 previously defined time points9,11-15: after 2 treatment cycles, at EOT and during the FU period. Rapid reductions in NPM1mut TLs and achievement of MRD negativity were associated with a significantly lower CIR rate, allowing for a refined risk assessment of patients in hematologic response. Our results are consistent with our previously published data,9 in which the achievement of MRD negativity in BM after 2 induction cycles identified patients with a lower 4-year CIR rate compared with MRD-positive patients (6.5% vs 53.0%; P < .001).
Our results are also in line with data from other previously published studies.11-14 In the study by Ivey et al,12 of 346 patients from the MRC17 trial, NPM1mut MRD positivity in PB after 2 treatment cycles was a significant prognostic factor for higher relapse risk in univariate and multivariate analyses (3-year CIR rate 82% vs 30%; P < .001). Balsat et al13 performed RQ-PCR–based MRD monitoring on 152 patients. Achievement of a >4-log reduction in NPM1mut TLs in PB after induction therapy was associated with a significantly lower CIR rate, independent of the cytogenetic and molecular context. In the ALFA 0701 trial,14 MRD positivity in BM after induction treatment was a poor prognostic factor, with a 2-year CIR rate of 55% compared with 21% for MRD-negative patients. Taken together, the data further support and confirm the prognostic role of an early and rapid reduction in NPM1mut TLs.
We could also show that the persistence of NPM1mut TLs at EOT was an independent risk factor for a higher relapse rate. This is again consistent with our previously published data9 and the results of Lambert et al,14 showing that the probability for relapse increases with MRD positivity.
Approximately 50% of AML patients with NPM1mut harbor concurrent DNMT3Amut. The prognostic effect of DNMT3Amut remains controversial.12,25,29 In our previous targeted next-generation sequencing study2 in 1540 patients with newly diagnosed AML, we identified a significant gene-gene interaction among NPM1mut, DNMT3Amut, and FLT3-ITD, but not for the NPM1mut-DNMT3Amut genotype. Because of the small number of FLT3-ITD patients in this study, we could only address the NPM1mut-DNMT3Amut interaction. Patients with NPM1mut-sole showed a significantly better reduction in NPM1mut TLs compared with patients with the NPM1mut/DNMT3Amut genotype, and more patients with NPM1mut-sole achieved MRD negativity after 2 treatment cycles and after EOT. The better clearance of NPM1mut TLs in patients with NPM1mut-sole was associated with a better 4-year CIR rate, indicating that concurrent DNMT3Amut may confer resistance to therapy in NPM1mut AML. However, these data need to be confirmed in larger patient series.
In a second step, we assessed the effect of GO on the kinetics of NPM1mut TLs and on patient outcome. The AMLSG 09-09 trial20 failed to achieve its primary end point, an improvement in event-free survival, primarily because of an increased early death rate on the GO-Arm. However, the addition of GO led to a significantly lower CIR rate and superior RFS. In line with these clinical data, we found significantly lower NPM1mut TLs in BM as early as after the first treatment cycle in patients on the GO-Arm, and this effect was maintained across all treatment cycles (Figure 4). At EOT, significantly more patients on the GO-Arm achieved MRD negativity. Multivariate analyses after 2 treatment cycles and at EOT revealed MRD persistence in BM and PB, FLT3-ITDhigh, DNMT3Amut, and older age as consistently significant prognostic factors for a higher risk of relapse. In BM, randomization to GO was associated with a lower risk for relapse at both time points. Although numbers are becoming rather small, our data also suggest that the achievement of MRD negativity was increased by GO in patients with NPM1mut-sole but not in patients with the NPM1mut/DNMT3Amut genotype.
Our results are in accordance with data from a study by the French ALFA group.14,19 In the ALFA-0701 trial,14 achievement of NPM1mut MRD negativity was significantly higher on the GO-Arm compared with the Standard-Arm (after induction: 39% vs 7%, P = .006; at EOT: 91% vs 61%, P = .028). The data from this French study and our study indicate that the addition of GO leads to deeper molecular responses in patients with NPM1mut AML.
We and other investigators have shown that an insufficient decrease or increase in NPM1mut TLs above a defined cutoff level during FU is highly predictive for relapse.8-10 In this study, we confirmed our previously defined cutoff value ≥ 200 NPM1mut TL in BM and PB. Patients exceeding this value in ≥1 sample had a relapse rate ∼ 70% and a median time to relapse of only 3 months; these were independent of material analyzed and treatment arm. Although the observation was based on a small patient number, more patients remained MRD negative on the GO-Arm compared with the Standard-Arm, again indicating that patients who received GO had a deeper molecular remission.
NPM1mut is considered a stable marker over time, but a few patients may lose the mutation at the time of relapse.5,6 We observed 2 cases of NPM1mut loss at the time of relapse in this study. In a recent study,6 we showed that disease recurrence in cases with loss of NPM1mut originated from persistent preleukemic clones exhibiting a distinct mutational pattern that shared almost no somatic mutation with the corresponding diagnosis sample, suggesting a second “de novo” or treatment-related AML in a subset of cases.
We also addressed the question of whether PB samples are equally informative as BM samples. Consistent with our previous data9 and published data,12,13 we observed a higher sensitivity of BM samples compared with PB samples. Although BM samples appear to be more sensitive, our analyses point out a significant prognostic and predictive impact of MRD analyses in both BM and PB samples. Our findings provide support for the current ELN consensus document15 that recommends monitoring of NPM1mut TLs in BM and PB, especially during therapy and early FU.
In summary, we confirmed that the assessment of NPM1mut MRD after 2 treatment cycles and at EOT is highly informative to identify patients with an increased risk of relapse. The addition of GO to intensive chemotherapy led to a significantly greater reduction in NPM1mut TLs and resulted in a higher proportion of patients achieving MRD negativity at EOT and during FU that was associated with a significantly lower CIR rate. MRD monitoring of NPM1mut TLs is a powerful tool for the assessment of the risk of relapse and to evaluate the efficacy of novel antileukemic agents.
Presented in abstract form at the 60th annual meeting of the American Society of Hematology, San Diego, CA, 3 December 2018.
For original data, please contact Konstanze Doehner (konstanze.doehner@uniklinik-ulm.de). Individual participant data will not be shared.
The online version of this article contains a data supplement.
The publication costs of this article were defrayed in part by page charge payment. Therefore, and solely to indicate this fact, this article is hereby marked “advertisement” in accordance with 18 USC section 1734.
Acknowledgments
The authors are grateful to all members of the German-Austrian AMLSG for providing leukemia specimens and clinical data.
This work was supported in part by the Else Kröner-Fresenius Stiftung (project 2014_A298 and P80/08//A65/08), Collaborative Research Center SFB (Sonderforschungsbereich) 1074, project B3 (K.D.), and Research Group FOR (Forschergruppe) 2674, project A02 (K.D., H.D.).
Authorship
Contribution: S.K.-S., A.C., V.I.G., P.P., J. Krönke, F. Theis, F.G.R., M.-V.T., E.P., N.J., J.H., L.K., A.S., G.G., W.F., T.K., T.S., K.T.M., M.L., M.W., K.S.G., H.A.H., E.K., G.W., J.S., M.B., J. Krauter, L.B., R.F.S., F. Thol, M.H., A.G., H.D., and K.D. collected and assembled data; S.K.-S., M.-V.T., L.K., H.D., and K.D. performed research; S.K.-S., D.W., P.P., F.G.R., J. Krzykalla, A.B., H.D., and K.D. analyzed and interpreted data; S.K.-S., D.W., H.D., and K.D. wrote the manuscript; and all authors approved the final version of the manuscript.
Conflict-of-interest disclosure: S.K.-S. received honoraria from Jazz Pharmaceuticals and had travel, accommodations, and expenses paid by Jazz Pharmaceuticals. P.P. provided consultancy services to AbbVie, Agios, Astex Pharmaceuticals, Astellas Pharma, Celgene, Jazz Pharmaceuticals, Novartis, Otsuka, Pfizer, and Sunesis Pharmaceuticals and had travel, accommodations, and expenses paid by AbbVie, Amgen, Celgene, Janssen Oncology, and Takeda. W.F. provided consultancy services to Amgen, ARIAD, Pfizer, Novartis, Jazz Pharmaceuticals, Celgene, and AbbVie; received research funding from Amgen; holds a patent on immunotherapy in AML obtained together with Amgen; and had travel, accommodations, and expenses paid by Amgen, Daiichi Sankyo, Jazz Pharmaceuticals, and Servier. T.S. provided consultancy services to Pfizer. K.S.G. provided consultancy services to Pfizer. H.A.H. has stock and other ownership interests in Novartis; provided consultancy services to Celgene, Pfizer, Amgen, and Jazz Pharmaceuticals; received research funding from Amgen and Regeneron; and had travel, accommodations, and expenses paid by Amgen, Jazz Pharmaceutical, Janssen-Cilag, and Celgene. G.W. provided consultancy services to Gilead Sciences, Novartis, and Takeda. J.S. provided consultancy services to Novartis, Pfizer, Janssen, Bayer, Bristol Myers Squibb, Ipsen, and MSD and received institutional research funding from Bristol Myers Squibb, Essai, AstraZeneca, and Novartis. M.B. provided consultancy services to Roche, AbbVie, and Janssen Oncology and had travel, accommodations, and expenses paid by AbbVie. J. Krauter received honoraria from Pfizer, Daiichi Sankyo, Astellas Pharma, Bristol Myers Squibb, and Amgen and provided consultancy services to Pfizer, Astellas Pharma, Amgen, Daiichi Sankyo, and Bristol Myers Squibb. R.F.S. provided consultancy services to Daiichi Sankyo, Pfizer, and Novartis; received research funding from PharmaMar, AstraZeneca, Pfizer, and Daiichi Sankyo; and had travel, accommodations, and expenses paid by Daiichi Sankyo and Amgen. M.H. received honoraria from Novartis, Pfizer, and priME Oncology; provided consultancy services to AbbVie, Bayer Pharma AG, Daiichi Sankyo, Novartis, Pfizer, Janssen Oncology, and Stemline Therapeutics; and received institutional research funding from Pfizer, Daiichi Sankyo, BerGenBio, Bayer, Novartis, and Astellas Pharma. A.G. provided consultancy services to Celgene and Novartis. H.D. received honoraria from Celgene, AbbVie, Jazz Pharmaceuticals, and Novartis; provided consultancy services to AbbVie, Agios, Amgen, Astellas Pharma, Astex Pharmaceuticals, Celgene, Jazz Pharmaceuticals, and Roche; and received institutional research funding from AROG Pharmaceuticals, Amgen, Bristol Myers Squibb, Novartis, Pfizer, Sunesis Pharmaceuticals, and Jazz Pharmaceuticals. K.D. received honoraria from Novartis, Jazz Pharmaceuticals, Celgene, and Daiichi Sankyo; provided consultancy services to CTI BioPharma, Celgene, Daiichi Sankyo, Novartis, Janssen, Roche, and Amgen; and received institutional research funding from Novartis and Celgene. The remaining authors declare no competing financial interests.
A complete list of the German-Austrian AMLSG institutions and investigators participating in this study appears in supplemental appendix.
Correspondence: Konstanze Döhner, Department of Internal Medicine III, University Hospital of Ulm, Albert-Einstein-Allee 23, 89081 Ulm, Germany; e-mail: konstanze.doehner@uniklinik-ulm.de.

This feature is available to Subscribers Only
Sign In or Create an Account Close Modal