

Key Points
Genetic predisposition to pB-ALL shapes a distinct gut microbiome.
Microbiome deprivation by antibiotic treatment can trigger leukemia in predisposed genetic carriers in the absence of infectious stimuli.

Abstract
The majority of childhood leukemias are precursor B-cell acute lymphoblastic leukemias (pB-ALLs) caused by a combination of prenatal genetic predispositions and oncogenic events occurring after birth. Although genetic predispositions are frequent in children (>1% to 5%), fewer than 1% of genetically predisposed carriers will develop pB-ALL. Although infectious stimuli are believed to play a major role in leukemogenesis, the critical determinants are not well defined. Here, by using murine models of pB-ALL, we show that microbiome disturbances incurred by antibiotic treatment early in life were sufficient to induce leukemia in genetically predisposed mice, even in the absence of infectious stimuli and independent of T cells. By using V4 and full-length 16S ribosomal RNA sequencing of a series of fecal samples, we found that genetic predisposition to pB-ALL (Pax5 heterozygosity or ETV6-RUNX1 fusion) shaped a distinct gut microbiome. Machine learning accurately (96.8%) predicted genetic predisposition using 40 of 3983 amplicon sequence variants as proxies for bacterial species. Transplantation of either wild-type (WT) or Pax5+/– hematopoietic bone marrow cells into WT recipient mice revealed that the microbiome is shaped and determined in a donor genotype–specific manner. Gas chromatography-mass spectrometry (GC-MS) analyses of sera from WT and Pax5+/– mice demonstrated the presence of a genotype-specific distinct metabolomic profile. Taken together, our data indicate that it is a lack of commensal microbiota rather than the presence of specific bacteria that promotes leukemia in genetically predisposed mice. Future large-scale longitudinal studies are required to determine whether targeted microbiome modification in children predisposed to pB-ALL could become a successful prevention strategy.
Introduction
Leukemia is the leading cause of childhood cancer-related mortality worldwide, and precursor B-cell acute lymphoblastic leukemia (pB-ALL) is the most common form of the disease.1,2 The current long-term survival or cure rate is ∼90%, but treatment is traumatic, toxic, and associated with long-term health consequences.3 Although the genomic landscape of patients with childhood leukemia has been extensively characterized,4-6 the extrinsic factors that promote the conversion of the preleukemic clone into full-blown pB-ALL are not yet understood. A 2-step model for the most common forms of pB-ALL development has been proposed.7 In this model, the first step is the presence of a genetic alteration, either acquired in utero or as a constitutional germline genetic variant. Studies that have screened for the frequency of the first-step mutation found that a significant proportion of healthy newborns carry preleukemic clones.8-12 These findings suggest that initiation of preleukemia in utero is far more common than indicated by the incidence of disease, highlighting the fact that a second oncogenic step is required. The second step of cooperating oncogenic mutations occurs perinatally or in infancy and can be triggered by infectious agents that are challenging an already dysregulated immune system.13,14 Both steps are necessary for overt leukemia development.13,14
Attributing a single causal infectious agent as the trigger for the second step essential for leukemia development seems unlikely, given the wide range of infectious agents that exist in complex combinations. However, there are numerous reports of pB-ALL space-time clusters associated with specific pathogens: streptococcal fever for 8 same-school patients in the Niles cluster,15 adenovirus for 13 patients in the Fallon cluster,16 and influenza A H1N1 swine flu virus for 7 patients in the Milan cluster.17 Furthermore, a study in the United Kingdom observed peaks of pB-ALL ∼6 months after seasonal influenza epidemics.18 Notably, concomitant with rising levels of hygiene standards, the incidence of pB-ALL has increased in developed societies.19-22 Epidemiologic studies have identified day care attendance,23 birth order,24 mode of delivery,25,26 and breast feeding27 as factors that influence the risk that a child might develop leukemia. Thus, delayed or disturbed immunologic training might lead to dysregulated immune responses when challenged with infectious agents. Taken together, leukemia evolution is a complex process influenced by a combination of external and genetic factors.
Consistent with the 2-step leukemia model, Pax5+/– and Sca1-ETV6-RUNX1 mice housed exclusively in a specific pathogen-free (SPF) environment do not develop pB-ALL.13,14 However, a fraction of these genetically predisposed mice develop leukemia if they are transferred from an SPF facility into a conventional facility (CF) where the environment is naturally full of infectious agents.13,14 In this study, we used the Pax5+/– and Sca1-ETV6-RUNX1 mice to analyze whether bacterial components of the microbiome trigger or protect against pB-ALL development in both the CF and SPF facility. We comprehensively studied the gut microbiome before, during, and after 8 weeks of antibiotic treatment and monitored the frequency and molecular makeup of the resulting pB-ALL in Pax5+/– and Sca1-ETV6-RUNX1 mice.
Our results demonstrate that a genetic predisposition to pB-ALL shapes a distinct gut microbiome which could potentially be used as a biomarker to identify pB-ALL susceptibility. Remarkably, in genetically predisposed mice, altering the microbiome by applying antibiotic treatment was sufficient to trigger leukemia development, even in the absence of infectious stimuli.
Methods
Mice and in vivo experiments
All animal work was conducted according to relevant national and international guidelines and has been approved by the Bioethics Committee of University of Salamanca and by the Bioethics Subcommittee of Consejo Superior de Investigaciones Científicas. To avoid sex biases in microbiome results, only female wild-type (WT) (Pax5+/+), Pax5+/–, and Sca1-ETV6-RUNX1 mice were included in the study. We used WT, Pax5+/–, and Sca1-ETV6-RUNX1 littermates for controls. For a detailed description of methods, see the supplemental Information (available on the Blood Web site). Authors can confirm that all relevant data are included in the paper and/or its supplemental Information files. The gene expression data discussed in this publication have been deposited in the National Center for Biotechnology Information’s Gene Expression Omnibus (GEO).28 For additional information, see the data sharing footnote.
Results
Transfer of mice to a naturally infectious environment alters the composition of their gut microbiome over time
To address the role of the gut microbiome in pB-ALL development in Pax5+/– mice, we established a mouse cohort consisting of 24 control littermate WT and 24 Pax5+/– female mice. Six mice were housed per cage, either in mixed-genotype cages (3 mice of each genotype; cages 1-4) or same-genotype cages (6 mice of 1 genotype; cages 5-8), respectively (Figure 1A). All mice were born in an SPF facility. Approximately 6 weeks after birth (6.3 ± 1.1 standard deviation) 1 of each same-genotype cages (7 and 8) and 2 mixed-genotype cages (3 and 4) were transferred to the CF, and cages 1, 2, 5, and 6 remained in the SPF facility. All 24 WT mice in both the CF and SPF facility remained healthy throughout the experiment (∼2 years). The 12 Pax5+/– mice that remained in the SPF facility stayed leukemia free, but 6 of 12 Pax5+/– mice that were transferred to the CF developed pB-ALL (Figure 1A).
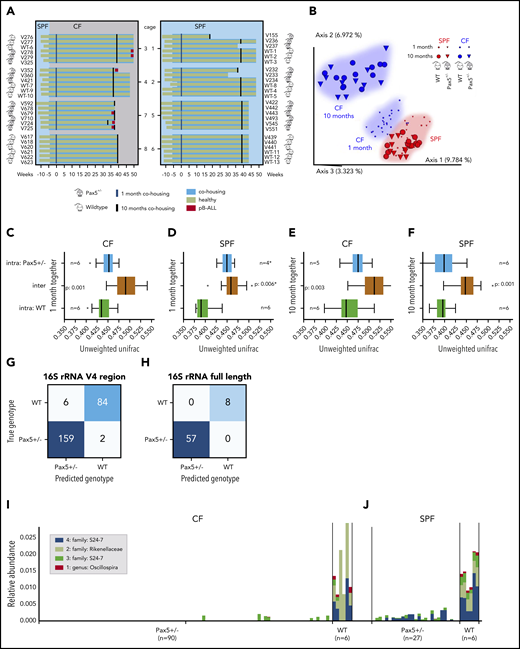
Pax5+/–associated genetic susceptibility to pB-ALL shapes a specific gut microbiota. (A) A diagram of the study design is shown. Pax5+/– (gray) and WT (white) mice were born in SPF facilities (light blue). Lifespan (in weeks) of an individual mouse is indicated by a horizontal bar. A green bar indicates that the mouse remained healthy throughout the experiment, a red end label indicates development of pB-ALL. After weaning, 6 mice were cohoused per cage (blue-shaded horizontal boxes). Three Pax5+/– and 3 WT mice were housed together in cages 1 to 4 (mixed genotype cages), and mice of the same genotypes were housed in cages 5 to 8 (same genotype). At ∼6.3 weeks of age, mice in cages 3, 4, 7, and 8 were transferred to the conventional facilities (CFs) where there is a natural infectious environment (gray). Fecal pellets for microbial profiling were collected 1 month (blue vertical lines) and 10 months (black vertical lines) after the beginning of cohousing. Dotted vertical lines correspond to samples that were excluded because of failed quality control (cage 5; first time point; mice V443 and V493). (B) Exposure of mice to a naturally infectious environment altered their gut microbiome composition over time. Pairwise unweighted UniFrac distances (beta diversity) were computed for all cohousing samples. Distance metric was ordinated via principal coordinates analysis (PCoA) into 3D and visualized via EMPeror.66 Axes indicate percentage of explained variance. Cones were used to visualize microbiomes of Pax5+/– mice, whereas spheres correspond to WT mice. First-time-point samples were drawn with smaller shapes than those for the second time point. A huge shift over time becomes obvious for CFs (blue) compared with the much smaller difference in SPF facilities (red). (C-F) Heterozygous loss of Pax5 shaped a specific gut microbiota. Stratified by time point (1 month or 10 months of cohousing) and facility (CF or SPF facility), pairwise PERMANOVA tests with 999 permutations were applied to test for differences in beta diversity grouped by mouse genotype for same-genotype cages (5, 6, 7, 8). Boxes visualize unweighted UniFrac distances between samples of the same genotype (ie, intragroup distances) (blue for Pax5+/– and green for WT) and distances across genotypes (mustard, intergroup; ie, all pairs in which 1 partner has a Pax5+/– genotype and the other partner has a WT genotype). The boxes show the quartiles of the dataset, while the whiskers (error bars) show the rest of the distribution, except for points that are determined to be outliers, using 1.5-fold of the interquartile range. P value is from the PERMANOVA test. Note that PERMANOVA requires a minimum of 5 samples per group, which is minimally undercut in the first time point for SPF facilities. Boxes and PERMANOVA operate on the same data. (G-H) Pax5+/– and WT genotypes were accurately predicted using machine learning. Accurate genotype prediction from relative abundances of 40 V4-ASVs (G) or 4 full-length rRNA (H) features. The full rarefied feature table was randomly split and contained relative abundances of 3983 V4-ASVs and 502 samples from the abx and the cohousing cohorts (excluding samples from mixed-genotype cohousing cages and the antibiotics treatment phase) with a 1:1 ratio into a training and a testing set of samples. For training, 168 Pax5+/– and 83 WT samples were used, and for testing, 161 Pax5+/– and 90 WT samples were used. In a first pass, the machine learning random forest algorithm (1000 trees; scikit-learn library) was trained to estimate the importance of the 3983 V4-ASVs in predicting the mouse genotype (Pax5+/– or WT). Starting with the single most important V4-ASV, we then tested the accuracy of predicting the mouse genotype with a second random forest. Continuing in stages, V4-ASVs were added to the random forest to improve overall accuracy. Saturation was found at 96.8% accuracy by using only the top 40 V4-ASVs. The confusion matrix showed that only 8 samples were predicted to have the wrong genotype. Panel H visualizes results for the same prediction strategy on the full-length PacBio ASVs (60 Pax5+/– and 4 WT mice samples were used for training and 57 Pax5+/– and 8 WT samples were used for testing). Accuracy for predicting a mouse’s genotype based on only the top 4 full-length ASVs was 100%. (I-J) The taxonomic profile of the top 4 full-length ASVs that differentiate between the genotypes is shown. Full-length ASV composition of each sample is visualized as 1 stacked bar. Samples were grouped by housing facility (CF in panel I, SPF facility in panel J) and subgenotypes were grouped by genotype (Pax5+/– on the left and WT on the right). Combined maximal relative abundance of the 4 full-length ASVs was at 2%. A naive Bayesian classifier was applied against the Greengenes 13.8 reference to assign taxonomic labels to the full-length ASVs, which are annotated in the legend. For PacBio full-length 16S rRNA sequencing, all stool samples from mice housed in infectious environments until week 50 were used.
Pax5+/–associated genetic susceptibility to pB-ALL shapes a specific gut microbiota. (A) A diagram of the study design is shown. Pax5+/– (gray) and WT (white) mice were born in SPF facilities (light blue). Lifespan (in weeks) of an individual mouse is indicated by a horizontal bar. A green bar indicates that the mouse remained healthy throughout the experiment, a red end label indicates development of pB-ALL. After weaning, 6 mice were cohoused per cage (blue-shaded horizontal boxes). Three Pax5+/– and 3 WT mice were housed together in cages 1 to 4 (mixed genotype cages), and mice of the same genotypes were housed in cages 5 to 8 (same genotype). At ∼6.3 weeks of age, mice in cages 3, 4, 7, and 8 were transferred to the conventional facilities (CFs) where there is a natural infectious environment (gray). Fecal pellets for microbial profiling were collected 1 month (blue vertical lines) and 10 months (black vertical lines) after the beginning of cohousing. Dotted vertical lines correspond to samples that were excluded because of failed quality control (cage 5; first time point; mice V443 and V493). (B) Exposure of mice to a naturally infectious environment altered their gut microbiome composition over time. Pairwise unweighted UniFrac distances (beta diversity) were computed for all cohousing samples. Distance metric was ordinated via principal coordinates analysis (PCoA) into 3D and visualized via EMPeror.66 Axes indicate percentage of explained variance. Cones were used to visualize microbiomes of Pax5+/– mice, whereas spheres correspond to WT mice. First-time-point samples were drawn with smaller shapes than those for the second time point. A huge shift over time becomes obvious for CFs (blue) compared with the much smaller difference in SPF facilities (red). (C-F) Heterozygous loss of Pax5 shaped a specific gut microbiota. Stratified by time point (1 month or 10 months of cohousing) and facility (CF or SPF facility), pairwise PERMANOVA tests with 999 permutations were applied to test for differences in beta diversity grouped by mouse genotype for same-genotype cages (5, 6, 7, 8). Boxes visualize unweighted UniFrac distances between samples of the same genotype (ie, intragroup distances) (blue for Pax5+/– and green for WT) and distances across genotypes (mustard, intergroup; ie, all pairs in which 1 partner has a Pax5+/– genotype and the other partner has a WT genotype). The boxes show the quartiles of the dataset, while the whiskers (error bars) show the rest of the distribution, except for points that are determined to be outliers, using 1.5-fold of the interquartile range. P value is from the PERMANOVA test. Note that PERMANOVA requires a minimum of 5 samples per group, which is minimally undercut in the first time point for SPF facilities. Boxes and PERMANOVA operate on the same data. (G-H) Pax5+/– and WT genotypes were accurately predicted using machine learning. Accurate genotype prediction from relative abundances of 40 V4-ASVs (G) or 4 full-length rRNA (H) features. The full rarefied feature table was randomly split and contained relative abundances of 3983 V4-ASVs and 502 samples from the abx and the cohousing cohorts (excluding samples from mixed-genotype cohousing cages and the antibiotics treatment phase) with a 1:1 ratio into a training and a testing set of samples. For training, 168 Pax5+/– and 83 WT samples were used, and for testing, 161 Pax5+/– and 90 WT samples were used. In a first pass, the machine learning random forest algorithm (1000 trees; scikit-learn library) was trained to estimate the importance of the 3983 V4-ASVs in predicting the mouse genotype (Pax5+/– or WT). Starting with the single most important V4-ASV, we then tested the accuracy of predicting the mouse genotype with a second random forest. Continuing in stages, V4-ASVs were added to the random forest to improve overall accuracy. Saturation was found at 96.8% accuracy by using only the top 40 V4-ASVs. The confusion matrix showed that only 8 samples were predicted to have the wrong genotype. Panel H visualizes results for the same prediction strategy on the full-length PacBio ASVs (60 Pax5+/– and 4 WT mice samples were used for training and 57 Pax5+/– and 8 WT samples were used for testing). Accuracy for predicting a mouse’s genotype based on only the top 4 full-length ASVs was 100%. (I-J) The taxonomic profile of the top 4 full-length ASVs that differentiate between the genotypes is shown. Full-length ASV composition of each sample is visualized as 1 stacked bar. Samples were grouped by housing facility (CF in panel I, SPF facility in panel J) and subgenotypes were grouped by genotype (Pax5+/– on the left and WT on the right). Combined maximal relative abundance of the 4 full-length ASVs was at 2%. A naive Bayesian classifier was applied against the Greengenes 13.8 reference to assign taxonomic labels to the full-length ASVs, which are annotated in the legend. For PacBio full-length 16S rRNA sequencing, all stool samples from mice housed in infectious environments until week 50 were used.
To analyze the gut microbiome, we collected fecal pellets from all mice 1 month and 10 months after the transfer to the CF. We isolated DNA and performed amplicon sequencing of the V4 region of the 16S ribosomal RNA (rRNA) gene. We used the first 150 base pairs to profile the gut microbiomes via Deblur-derived29 amplicon sequence variants (ASVs) as proxies for bacterial species. Analysis of the 16S rRNA sequencing data showed not only a clustering by facility (CF in blue vs SPF in red), but also a tremendous change in the microbial composition over time in CF, but not in SPF facility (Figure 1B; supplemental Figure 1). Beta diversity, in terms of unweighted UniFrac distances,30 showed strong, statistically significant differences depending on the type of animal facility (P < .005, permutational multivariable analysis of variance [PERMANOVA]31 ) for both genotypes (Figure 1C-D). During the next 9 months, differences between the SPF facility and CF became more prominent (Figure 1E-F), and the relative abundance of facility-specific ASVs increased (from 1% and 5% to 4% and 13%, respectively; supplemental Figure 2). The shared core ASVs remained relatively stable, but only a minority persisted over time (0.24% and 5% relative abundance of ASVs from the CF and SPF facility) (supplemental Figure 2). At the time of transfer to the CF, the mice were 6 weeks old (between the age of weaning and young adulthood). At this stage, the murine gut microbiome should be fully developed but is still susceptible to changes in its composition caused by environmental triggers.32 The compositional shift in the CF over time may indicate that mice were challenged by changing common infections. These data illustrate the dynamic impact of exposure to infection on the composition of the gut microbiota in both WT and Pax5+/– mice.
Genetic predisposition shapes a specific gut microbiota in mice
The immune system intricately interacts with and responds to the gut microbiome.33-39 In the Pax5+/– mouse model, the immune system is affected by the Pax5 deletion.13 Accordingly, the number of B220+ B cells in the Peyer’s patches (lymphoid follicles that are an important part of the gut-associated lymphoid tissue) was significantly reduced in Pax5+/– mice (n = 9) compared with WT mice (n = 9) (supplemental Figure 3). We hypothesized that these changes in the immune system may shape a distinct microbiome. To test this hypothesis, we analyzed the impact of the genotype on the microbiome in the same experimental setup as described above. We first used stool samples from mice kept in same-genotype cages (45 fecal samples). Indeed, the effect of the heterozygous Pax5 deletion was strong enough to shape a characteristic gut microbiome composition that was clearly distinct from that in WT mice. This difference was significant in both the CF and SPF facility (Figure 1C-F). To further validate this finding, we carried out a combined analysis of fecal samples from the cohort described in Figure 1A with samples from a second independent cohort of WT (n = 18) and Pax5+/– (n = 27) mice (named the “abx” cohort, described in detail in supplemental Figures 4 and 5, but consisting only of untreated mice). We identified 1013 of 3983 ASVs (covered by at least 10 reads) that were differentially abundant between WT (173 fecal samples) and Pax5+/– (329 fecal samples) via discrete false discovery rate (FDR) (supplemental Figure 6).40 We further refined the set of genotype-separating ASVs to only 40 by independently applying a machine-learning method to the full set of 3983 ASVs. ASVs were ranked by feature importance determined by the random forest algorithm,41 which was trained with 50% of the samples and tested on the remaining 50% of samples. These 40 ASVs were sufficient to accurately (96.8%) predict the mouse genotype (Figure 1G). The fact that this machine learning tool was able to predict the mouse genotype confirms that Pax5 heterozygosity shapes a specific gut microbiota. Notably, 16S rRNA full-length sequencing allowed us to further sharpen the genotype prediction between Pax5+/– and WT animals to an accuracy of 100% by using only 4 of 5212 full-length ASVs (Figure 1H). The major difference between the microbiomes of WT and Pax5+/– mice was the lack of a whole range of commensal bacteria in the Pax5+/– mice. Specifically, members of the families Rikenellaceae (Alistipes ssp) S24-7 and of the genus Oscillospira, which were detectable in WT mice, were absent in the microbiota of Pax5+/– mice in CHFs (Figure 1I). Members of the bacterial families Rikenellaceae (Alistipes ssp) and Oscillospira were not detected in the microbiota of Pax5+/– mice in SPF facilities (Figure 1J).
Mice have a natural coprophagous behavior and therefore it is not surprising that in the 4 mixed-genotype cages, we consistently observed an efficient microbiome mixing of WT and Pax5+/– microbiomes (cages 1 to 4; Figure 1A). As shown in a SourceTracker2 analysis,42 intermixing resulted in a 1:1 ratio of both distinguishable microbiomes (supplemental Figure 1).
To test whether the low numbers of peripheral B cells associated with the heterozygous Pax5+/– deletion were responsible for the distinct microbiome, we included another genetically predisposed model in our study, the transgenic Sca1-ETV6-RUNX1 model, in which there are no observed decreases in the numbers of peripheral B cells.43,44 Microbiome analyses of Sca1-ETV6-RUNX1 mice were carried out at 10 months in the SPF facility and at 3 to 4 months in the CF (mice were transferred from the SPF facility to the CF at 6 to 8 weeks of age). Integration of the data with our previous analyses confirmed that the environment (facility) and genotype are key factors that shape the gut microbiome (Figure 2A-B). SourceTracker2 analyses demonstrated that Pax5+/– microbial sources were also prominent in the composition of Sca1-ETV6-RUNX1 microbiomes (Figure 2C) and PERMANOVA (on unweighted UniFrac beta-diversity distances with 999 permutations) confirmed that the analyzed genotypes shape microbiomes with statistically significant differences (Figure 2D). The predisposed genotypes could be accurately predicted by machine learning using the 10 most important ASVs (random forest with 1000 trees) (Figure 2E). These analyses confirmed that genotypes genetically predisposed to the development of pB-ALL had distinct microbiomes independent of B-cell defects in the periphery. There is a lower incidence of leukemia in the Sca1-ETV6-RUNX1 model (10%),14 and thus, it is likely that the number of analyzed mice (n = 15) used in our study was too low to observe leukemia development. All of the Sca1-ETV6-RUNX1 mice were euthanized at 20 months of age.
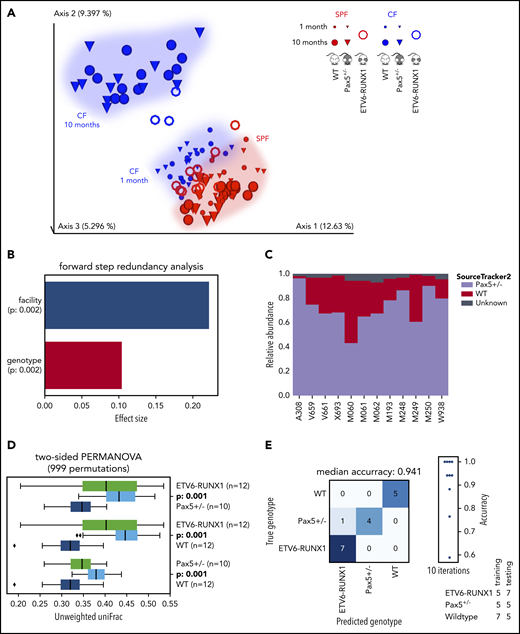
ETV6-RUNX1–associated genetic susceptibility to pB-ALL shapes a specific gut microbiota. (A) The EMPeror plot shows a PCoA of the cohousing cohort (see Figure 1), including samples from 15 Sca1-ETV6-RUNX1 mice (represented as rings). Samples of Sca1-ETV6-RUNX1 mice clustered well with samples of the cohousing cohort derived from the same facility (CF or SPF facility, respectively). Microbiome analyses were carried out after 2 months in CFs (mice had been referred to CFs from SPF facilities at age 6 to 8 weeks) and after 10 months in SPF facilities. The analyzed mice did not develop leukemia. (B) The forward step redundancy analysis was used to quantify effect sizes on microbiome differences using all samples from the cohousing cohort and the Sca1-ETV6-RUNX1 mice. Environment (facility) and genotype were identified as the most important factors. (C) WT and Pax5+/– microbial sources were defined to quantify compositions of microbial ETV6-RUNX1 sinks via SourceTracker2. The analysis showed that the microbiome of Sca1-ETV6-RUNX1 mice was more similar to the microbiome of Pax5+/– mice than to that of WT mice. (D) Statistical analyses demonstrated that the mouse genotype shapes 3 statistically significantly different microbiomes (PERMANOVA on unweighted UniFrac beta-diversity distances with 999 permutations). The box shows the quartiles of the dataset, while the whiskers (error bars) show the rest of the distribution, except for points that are determined to be outliers, using 1.5-fold of the interquartile range. The P value is from the PERMANOVA test. (E) Machine learning was able to predict genotypes genetically predisposed to pB-ALL. A confusion matrix for predicting the mouse genotype from the 10 most important V4-ASVs is shown (random forest with 1000 trees).
ETV6-RUNX1–associated genetic susceptibility to pB-ALL shapes a specific gut microbiota. (A) The EMPeror plot shows a PCoA of the cohousing cohort (see Figure 1), including samples from 15 Sca1-ETV6-RUNX1 mice (represented as rings). Samples of Sca1-ETV6-RUNX1 mice clustered well with samples of the cohousing cohort derived from the same facility (CF or SPF facility, respectively). Microbiome analyses were carried out after 2 months in CFs (mice had been referred to CFs from SPF facilities at age 6 to 8 weeks) and after 10 months in SPF facilities. The analyzed mice did not develop leukemia. (B) The forward step redundancy analysis was used to quantify effect sizes on microbiome differences using all samples from the cohousing cohort and the Sca1-ETV6-RUNX1 mice. Environment (facility) and genotype were identified as the most important factors. (C) WT and Pax5+/– microbial sources were defined to quantify compositions of microbial ETV6-RUNX1 sinks via SourceTracker2. The analysis showed that the microbiome of Sca1-ETV6-RUNX1 mice was more similar to the microbiome of Pax5+/– mice than to that of WT mice. (D) Statistical analyses demonstrated that the mouse genotype shapes 3 statistically significantly different microbiomes (PERMANOVA on unweighted UniFrac beta-diversity distances with 999 permutations). The box shows the quartiles of the dataset, while the whiskers (error bars) show the rest of the distribution, except for points that are determined to be outliers, using 1.5-fold of the interquartile range. The P value is from the PERMANOVA test. (E) Machine learning was able to predict genotypes genetically predisposed to pB-ALL. A confusion matrix for predicting the mouse genotype from the 10 most important V4-ASVs is shown (random forest with 1000 trees).
We next explored whether the link between genetic predisposition and a specific gut microbiota is influenced by hematopoietic or nonhematopoietic cells. To test this, we transplanted bone marrow from either WT (n = 8) or Pax5+/– (n = 12) mice into WT mice (n = 20) and collected fecal samples before and after transplantation (Figure 3A-B). Longitudinal analyses of the microbiome composition demonstrated that significant differences in the microbiome composition, dependent on the donor genotype, started to be recognizable as soon as 6 weeks after transplantation (Figure 3C). Taken together, these results suggest that hematopoietic cells carrying the genetic predisposition are enough to shape a genotype-specific gut microbiota.
![The hematopoietic cells from a genetically predisposed donor shape a distinct microbiome. (A) Overview of the experimental design is illustrated. WT mice were born and kept in SPF facilities. Stool samples were collected before irradiation with 2 doses of 6 Gy to eradicate the BM. Bone marrow transplantation (BMT) was carried out using Pax5+/– and WT mice as donors. Mice were monitored after transplantation, and stool samples were collected at the indicated time points. (B) BM from Pax5+/– mice (blue lines) was transplanted into 12 WT mice housed in 4 cages in SPF facilities. As a control, WT BM (green lines) was transplanted into 8 mice housed in 3 cages in SPF facilities. Samples were collected before BMT and at 2, 4, 6, and 8 weeks after BMT. (C) Pairwise PERMANOVA tests were applied (as described in Figure 1C-F) to test for differences in beta diversity by mouse genotype. Unweighted UniFrac distances between samples of the same donor genotype (ie, intragroup distances [Pax5+/–, blue; WT, green]) and distances across donor genotypes (mustard, intergroup) are shown as box plots. The box shows the quartiles of the dataset, while the whiskers (error bars) show the rest of the distribution, except for points that are determined to be outliers, using 1.5-fold of the interquartile range. Six weeks after transplantation, strong significant differences dependent on the specific donor genotype were detectable. P value is from the PERMANOVA test.](https://ash.silverchair-cdn.com/ash/content_public/journal/blood/136/18/10.1182_blood.2019004381/5/m_bloodbld2019004381f3.png?Expires=1769802582&Signature=fOoNBDMnNlViVJsdtEvGomJ5RU-p8Ug-vMbT3~zUzq4oESFsRxwmOWgFyfZBm~y5gHEUnpFWopElZHKa4z8sYbfMYN85zJFzzJGgUUXzv9n2fdQ3Ky3qDc7AjL1-PU2~UyZU-rfEIWLZSR2Gq6qw552jbjB785xhycvAgHwzEHwiDkJC0gWZNIdLBTqea1zvTQBhxQkjtf9b7GuQPH3lcYHDrPD2BxT~xYqbrWHvYkBuQ4qGuqe0i7Qf4abrpOuVN7ifspaNTl8TcL0tB8YtrFif~pYSEAdZVW-5dw3O7kXILbZEtKnJYDku6qhNKkUT9WFJyXIA5lj-7S8n7UAYIQ__&Key-Pair-Id=APKAIE5G5CRDK6RD3PGA)
The hematopoietic cells from a genetically predisposed donor shape a distinct microbiome. (A) Overview of the experimental design is illustrated. WT mice were born and kept in SPF facilities. Stool samples were collected before irradiation with 2 doses of 6 Gy to eradicate the BM. Bone marrow transplantation (BMT) was carried out using Pax5+/– and WT mice as donors. Mice were monitored after transplantation, and stool samples were collected at the indicated time points. (B) BM from Pax5+/– mice (blue lines) was transplanted into 12 WT mice housed in 4 cages in SPF facilities. As a control, WT BM (green lines) was transplanted into 8 mice housed in 3 cages in SPF facilities. Samples were collected before BMT and at 2, 4, 6, and 8 weeks after BMT. (C) Pairwise PERMANOVA tests were applied (as described in Figure 1C-F) to test for differences in beta diversity by mouse genotype. Unweighted UniFrac distances between samples of the same donor genotype (ie, intragroup distances [Pax5+/–, blue; WT, green]) and distances across donor genotypes (mustard, intergroup) are shown as box plots. The box shows the quartiles of the dataset, while the whiskers (error bars) show the rest of the distribution, except for points that are determined to be outliers, using 1.5-fold of the interquartile range. Six weeks after transplantation, strong significant differences dependent on the specific donor genotype were detectable. P value is from the PERMANOVA test.
The hematopoietic cells from a genetically predisposed donor shape a distinct microbiome. (A) Overview of the experimental design is illustrated. WT mice were born and kept in SPF facilities. Stool samples were collected before irradiation with 2 doses of 6 Gy to eradicate the BM. Bone marrow transplantation (BMT) was carried out using Pax5+/– and WT mice as donors. Mice were monitored after transplantation, and stool samples were collected at the indicated time points. (B) BM from Pax5+/– mice (blue lines) was transplanted into 12 WT mice housed in 4 cages in SPF facilities. As a control, WT BM (green lines) was transplanted into 8 mice housed in 3 cages in SPF facilities. Samples were collected before BMT and at 2, 4, 6, and 8 weeks after BMT. (C) Pairwise PERMANOVA tests were applied (as described in Figure 1C-F) to test for differences in beta diversity by mouse genotype. Unweighted UniFrac distances between samples of the same donor genotype (ie, intragroup distances [Pax5+/–, blue; WT, green]) and distances across donor genotypes (mustard, intergroup) are shown as box plots. The box shows the quartiles of the dataset, while the whiskers (error bars) show the rest of the distribution, except for points that are determined to be outliers, using 1.5-fold of the interquartile range. Six weeks after transplantation, strong significant differences dependent on the specific donor genotype were detectable. P value is from the PERMANOVA test.
Altering the gut microbiota through antibiotic treatment does not prevent development of pB-ALL under infectious conditions
Our results demonstrated that genetic predisposition to pB-ALL in murine models resulted in a specific microbiome composition different from that in WT mice. What remains to be elucidated, however, is whether the microbiome is promoting or preventing the onset of disease. Because a mixing of microbiomes (cages 1-4; Figure 1A) did not provide sufficient insight, we set up a second mouse cohort termed “abx” and treated the mice with antibiotics to deplete bacteria. Specifically, WT and Pax5+/– mice in the abx cohort were treated with an antibiotic cocktail (ampicillin, vancomycin, ciprofloxacin, imipenem, and metronidazole) in their drinking water for 8 weeks, which was started immediately after their transfer to the CF at around 6 weeks of age.45 This cohort consisted of 27 Pax5+/– and 18 WT mice, from which we collected fecal pellets at the time of transfer (before they consumed any antibiotics), at 4 and 8 weeks after treatment with antibiotics, and then every 2 weeks until a mouse presented clear symptoms of pB-ALL or reached the end of its natural lifespan (supplemental Figures 4 and 5). The bacterial depletion effects of the antibiotic cocktail were confirmed by microbiologic analysis, stool DNA concentration analysis, and 16S rRNA amplicon sequencing (supplemental Figures 7 and 8). Fecal samples collected from mice during antibiotic treatment contained mainly reads derived from their plant-based diet (on average 82% of the reads could be assigned to chloroplast or mitochondria origin). When we analyzed the effect of the antibiotic treatment on the hematopoietic compartment in various organs, we observed that antibiotic treatment did not alter B-cell development in either WT or Pax5+/− mice (supplemental Figures 9-13). However, we observed a reduction of mature B cells in the peripheral blood (PB) of Pax5+/– (but not WT) mice after antibiotic treatment (supplemental Figure 14).
In all, 17 (62.96%) of 27 Pax5+/– animals treated with antibiotics and 6 (50%) of 12 Pax5+/– mice not treated with antibiotics and kept in the CF at the same time developed pB-ALL. pB-ALLs occurred between 7.5 and 22 months of age. Thus, neither pB-ALL incidence nor time to disease onset was statistically different in treated or untreated Pax5+/– animals when they were housed in the CF. Onset of leukemia was characterized by blast infiltration and the appearance of blast cells in the PB, bone marrow (BM), spleen, intestine, and lymph nodes. Fluorescence-activated cell sorting analysis revealed a CD19+/–B220+IgM–cKit+/–CD25+/– cell surface phenotype of the infiltrating tumor cells in the BM, PB, spleen, and lymph nodes and nonlymphoid tissues such as kidney, liver, and lung (supplemental Figures 15 and 16). Diseased Pax5+/– mice in the microbiome-deprived abx cohort also displayed clonal immunoglobulin VH-DJH and D-JH gene rearrangements consistent with a pro-B or pre-B cell of origin (supplemental Figure 17). By using microarray analysis, we found 7032 significantly differentially expressed genes (FDR, 0.01) in tumor-bearing BMs of Pax5+/– mice treated with antibiotics (n = 9) compared with BM-derived pro-B/pre-B cells of WT mice (n = 4; supplemental Figure 18A-B; supplemental Table 1). Gene set enrichment analysis revealed significantly enriched human pB-ALL gene sets46-48 (FDR, 0.005; FDR, 0.007; FDR, 0.010) (supplemental Figure 18C). To identify somatically acquired second hits leading to leukemia development in microbiome-deprived Pax5+/– pB-ALLs, we performed whole-exome sequencing of paired tumor and germline DNA of all 17 diseased Pax5+/– mice that had been treated with antibiotics in the abx cohort. We identified somatically acquired recurrent mutations that are also commonly identified in human pB-ALL. Specifically, recurrent mutations affecting the JAK/STAT and RAS signaling pathways were detected. Jak1, Jak3, and Ptpn11 mutations have been previously described in leukemic Pax5+/– mice not treated with antibiotics13,44 (supplemental Figure 19; supplemental Table 2). In addition to those shared secondary oncogenic mutations, pB-ALL tumors of mice treated with antibiotics harbored additional recurrent mutations in genes (Kit, Flt3, and Cbl) not previously described in other leukemias driven by Pax5+/–.13,44 This finding is consistent with the observed differences in gene expression patterns; 2119 genes were significantly differentially expressed (FDR, 0.01) (supplemental Table 3) and partially enriched for proinflammatory and IL2-STAT5 gene sets (supplemental Figure 18D). Overall, these findings show that antibiotic treatment did not prevent pB-ALL development in Pax5+/– mice in infection-permissive housing conditions.
As a control, WT mice that do not develop pB-ALL under natural infection exposure13 were also treated with the same antibiotic cocktail. The bacterial depletion effects of the antibiotic cocktail in the WT mice were also confirmed as they were for the Pax5+/– mice (supplemental Figure 20). pB-ALL development was then monitored in these microbiome-deprived WT mice in conditions of natural infection exposure throughout their lifespan (supplemental Figure 21). None of the microbiome-deprived WT mice developed pB-ALL. At the age of 18 months at the end of their natural lifespan, 2 of 18 mice developed tumors. Histopathology and immunophenotyping identified these as mature B-cell–derived neoplasias (lymphomas), which are clearly distinct from early precursor B-cell–derived leukemias (supplemental Figures 22-24). These results confirmed that altering the gut microbiome through bacterial depletion has a specific impact on pB-ALL development in genetically predisposed mice.
Infection-driven pB-ALL development in genetically predisposed Pax5+/– mice is T-cell independent
We observed that altering the microbiome through bacterial depletion after antibiotic treatment did not modify the number of B cells in the Peyer’s patches but significantly reduced the number of CD3+ T cells in Pax5+/– mice treated with antibiotics compared with untreated Pax5+/− mice (supplemental Figure 25). A reduction in CD3+ T cells has been associated with a decrease in anticancer immunity.39 Therefore, we wondered whether the reduction in T-cell numbers was responsible for the pB-ALL development in Pax5+/– mice treated with antibiotics. To this end, we crossed Pax5+/– mice with thymus-deficient T-cell–lacking nu/nu mice. Mice were born and kept in a SPF facility until they were transferred to a CF. pB-ALL development was observed in 5 (15%) of 33 of the Pax5+/−;nu/nu animals but not in any of the WT;nu/nu control mice (n = 31) (supplemental Figure 26A). This penetrance of pB-ALL development was in the same range as in the T-cell–producing Pax5+/–;nu/+ mice (n = 30) (supplemental Figure 26B) and in human families with a heterozygous germline PAX5 c.547G>A mutation.49,50 Similar to the T-cell–producing Pax5+/–;nu/+ mice, pB-ALL in the T-cell–deficient Pax5+/–;nu/nu group occurred between 7.7 and 11.6 months of age. In both groups, the pB-ALLs manifested as blast infiltration in the spleen, liver, lymph nodes, kidney, and lung (supplemental Figure 26C) and in the appearance of blast cells in the PB (supplemental Figure 27). Fluorescence-activated cell sorting analysis of tumor cells revealed the same cell surface phenotype (CD19+/–B220+IgM-cKit+/–CD25+/–) that extended through the BM, PB, spleen, and lymph nodes (supplemental Figure 27) and infiltrated non-lymphoid tissues such as liver, kidney, and lung (supplemental Figure 26C). All pB-ALLs displayed clonal immature BCR rearrangements (supplemental Figure 26D). These results suggest that the infection-driven pB-ALL development in Pax5+/– mice is not dependent on T cells.
Altering the gut microbiota through bacterial depletion promotes pB-ALL development in genetically predisposed Pax5+/– mice in the absence of infectious stimuli
Our previous data demonstrated that a genetic predisposition alone is not sufficient for pB-ALL development and that an infectious environment is also necessary. However, 8 weeks of antibiotic treatment did not provide any protection against infection-driven pB-ALL. Thus, we considered the role of the physiological gut microbiome under SPF conditions and whether altering it through bacterial depletion might lead to induction of leukemia in the absence of natural infectious triggers. To test this, an additional cohort of 23 Pax5+/– mice born in SPF facilities were not transferred to a CF, but were kept in a SPF facility throughout the experiment. These mice were treated with antibiotics (supplemental Figure 28). Of 23 mice, 11 (47.82%) developed pB-ALL between 11.4 and 20.7 months of age, but none of the untreated Pax5+/– mice (n = 12) in SPF facilities developed leukemia (Figure 4A-D; supplemental Figure 29). These leukemias showed phenotypic, histologic, clonal, and genetic characteristics similar to those from the leukemias that arose in Pax5+/– mice exposed to natural infection (Figure 4A-D; supplemental Figures 12 and 29; supplemental Table 1). This suggests that an intact microbiome protects genetically predisposed mice against leukemia and that altering the microbiome through bacterial depletion after antibiotic treatment may trigger leukemia, even in the absence of an infectious environment.
![Depletion of gut microbiome bacteria after antibiotic treatment promotes pB-ALL development in predisposed mice in the absence of natural infectious stimuli. (A) Untreated Pax5+/– mice housed in SPF facilities did not develop leukemia. Treatment of Pax5+/– mice housed in SPF facilities with antibiotics resulted in pB-ALL development in 47.82% of mice. **P = .0055 using a Fisher’s exact test. (B) pB-ALL–specific survival curves of Pax5+/– mice treated with antibiotics and exposed to common infections (green line; n = 27), Pax5+/– mice treated with antibiotics and housed in SPF facility conditions (blue line; n = 23), and Pax5+/– mice not treated with antibiotics and housed in SPF facility conditions (orange line; n = 12) are shown. Log-rank (Mantel-Cox) test (P = .2629) was used to evaluate survival curves between untreated Pax5+/– mice and Pax5+/– mice treated with antibiotics. (C) Representative fluorescence-activated cell sorting plots of B-cell (CD19+B220+ and B220+IgM+/–) subsets in PB and BM from diseased Pax5+/– mice treated with antibiotics (exposed [CF] and not exposed [SPF facility] to common infections) compared with an age-matched control WT mouse are shown. (D) The Venn diagram illustrates recurrently mutated genes in Pax5+/– leukemic cells identified by whole-exome sequencing. Mutated genes in leukemias arising in Pax5+/– mice treated with antibiotics and housed either in CFs (green circle) or in SPF facilities (blue circle) are compared with leukemias derived from untreated Pax5+/– mice kept in an infectious environment (red circle). ns, not significant.](https://ash.silverchair-cdn.com/ash/content_public/journal/blood/136/18/10.1182_blood.2019004381/5/m_bloodbld2019004381f4.png?Expires=1769802582&Signature=jhYkZs9HkvKl6pDyJNdzMNFwLpRBOCo12OIybjjz48024ztRYNOhsLUzjEvXovSYLPFWTarLxS4bN74x8QXbdeNNRt9YQ1tQUWgKh6YkGXXei6~W~W7mngaTD1pUZcDAVC1TKbn-6vw3ZB53cTtXw84Jbf~quy~2fEc7TzX5kmpIGuwRT-HUZ9FfmlMljHe9Y3mnvc18P4N8n61KT3-0w~w3zWHqd8HyBz~Pi8wVjGKtS~bG870AtGL7NGVNoiO-8k34ZTAh-G2wHjfCImZ8YFCOVGpcooQ4JQff7kAwCBkCT~sHLPum48sgdi2qt0osaHCf3CddzJeQAAWlQTOMuw__&Key-Pair-Id=APKAIE5G5CRDK6RD3PGA)
Depletion of gut microbiome bacteria after antibiotic treatment promotes pB-ALL development in predisposed mice in the absence of natural infectious stimuli. (A) Untreated Pax5+/– mice housed in SPF facilities did not develop leukemia. Treatment of Pax5+/– mice housed in SPF facilities with antibiotics resulted in pB-ALL development in 47.82% of mice. **P = .0055 using a Fisher’s exact test. (B) pB-ALL–specific survival curves of Pax5+/– mice treated with antibiotics and exposed to common infections (green line; n = 27), Pax5+/– mice treated with antibiotics and housed in SPF facility conditions (blue line; n = 23), and Pax5+/– mice not treated with antibiotics and housed in SPF facility conditions (orange line; n = 12) are shown. Log-rank (Mantel-Cox) test (P = .2629) was used to evaluate survival curves between untreated Pax5+/– mice and Pax5+/– mice treated with antibiotics. (C) Representative fluorescence-activated cell sorting plots of B-cell (CD19+B220+ and B220+IgM+/–) subsets in PB and BM from diseased Pax5+/– mice treated with antibiotics (exposed [CF] and not exposed [SPF facility] to common infections) compared with an age-matched control WT mouse are shown. (D) The Venn diagram illustrates recurrently mutated genes in Pax5+/– leukemic cells identified by whole-exome sequencing. Mutated genes in leukemias arising in Pax5+/– mice treated with antibiotics and housed either in CFs (green circle) or in SPF facilities (blue circle) are compared with leukemias derived from untreated Pax5+/– mice kept in an infectious environment (red circle). ns, not significant.
Depletion of gut microbiome bacteria after antibiotic treatment promotes pB-ALL development in predisposed mice in the absence of natural infectious stimuli. (A) Untreated Pax5+/– mice housed in SPF facilities did not develop leukemia. Treatment of Pax5+/– mice housed in SPF facilities with antibiotics resulted in pB-ALL development in 47.82% of mice. **P = .0055 using a Fisher’s exact test. (B) pB-ALL–specific survival curves of Pax5+/– mice treated with antibiotics and exposed to common infections (green line; n = 27), Pax5+/– mice treated with antibiotics and housed in SPF facility conditions (blue line; n = 23), and Pax5+/– mice not treated with antibiotics and housed in SPF facility conditions (orange line; n = 12) are shown. Log-rank (Mantel-Cox) test (P = .2629) was used to evaluate survival curves between untreated Pax5+/– mice and Pax5+/– mice treated with antibiotics. (C) Representative fluorescence-activated cell sorting plots of B-cell (CD19+B220+ and B220+IgM+/–) subsets in PB and BM from diseased Pax5+/– mice treated with antibiotics (exposed [CF] and not exposed [SPF facility] to common infections) compared with an age-matched control WT mouse are shown. (D) The Venn diagram illustrates recurrently mutated genes in Pax5+/– leukemic cells identified by whole-exome sequencing. Mutated genes in leukemias arising in Pax5+/– mice treated with antibiotics and housed either in CFs (green circle) or in SPF facilities (blue circle) are compared with leukemias derived from untreated Pax5+/– mice kept in an infectious environment (red circle). ns, not significant.
The composition of the gut microbiome differentiates between healthy and leukemia-developing Pax5+/– mice
We first confirmed that microbial communities regenerated in a genotype-dependent manner after antibiotic treatment and were able to reconstitute over time (Figure 5A). Next, we compared the gut microbiome of Pax5+/– mice that developed pB-ALL to that of mice that remained healthy throughout the course of the experiment. By applying discrete FDR across all time points, we identified 42 of the 3983 identified V4-ASVs as differentially abundant at the preleukemic phase between Pax5+/– mice that developed pB-ALL (144 fecal samples) and healthy Pax5+/– mice (164 fecal samples) (Figure 5B-C). We also searched for a single leukemia-causing microbe that could be specifically identified in Pax5+/– mice. To this end, we re-subjected stool samples to PacBio full-length 16S rRNA sequencing (Figure 1H-J) to enhance the resolution of commensal microbiota. However, a single microbe connected with the development of pB-ALL was not identified. Rather than the overall bacterial burden or any specific agent, the overall composition and in particular the lack of microbiota was significantly associated with pB-ALL (Figure 5B-C). These findings link genetic predisposition and a depleted microbiome specifically to those Pax5+/– mice that will develop infection-driven pB-ALL. Taken together, these findings suggest that the gut microbiome could potentially be used as an early biomarker to identify genetically predisposed mice at risk of developing leukemia.
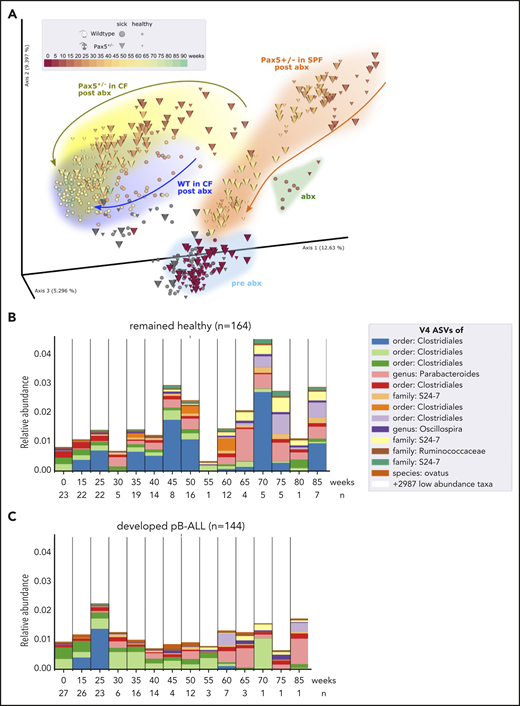
The microbiome between healthy and leukemic Pax5+/−mice is distinct. (A) After antibiotic treatment, the beta diversity of the microbiomes shifted in a genotype-dependent manner and reconstituted over time toward a similar end point (Pax5+/–, yellow; WT, blue). Pairwise unweighted UniFrac distances (beta diversity) were computed for all samples. Distance metric was ordinated into 3D via PCoA and visualized using EMPeror. Axes indicate percentages of explained variance. Cones and spheres were used to visualize microbiomes of Pax5+/– and WT mice, respectively. Icon size indicates disease status, with larger icons for pB-ALL mice and smaller icons for healthy mice. Samples of the initial time point (darkest red), at transfer from SPF facilities to CFs before antibiotics treatment, clustered in the light blue pre-abx region. Samples with sufficient bacterial reads from the group that had 8 weeks of antibiotic treatment clustered in the green abx region. Samples shifted back after antibiotic treatment in a genotype-dependent manner (Pax5+/–, yellow; WT, blue) and reconstituted over time toward a similar end point. Their end point was significantly shifted from pre-abx, which was not the case for samples of mice that were housed in SPF facilities (orange trajectory). (B-C) Microbial V4-16S signatures (V4-ASVs) differentiated between healthy (B) and preleukemic (C) Pax5+/– mice. Shown are mean V4-ASV compositions for the top 13 differentially abundant (discrete FDR) features of all samples stratified by disease status. Samples were grouped by time point (x-axis) and visualized as 1 stacked bar each. A naive Bayesian classifier was applied against the Greengenes 13.8 reference to assign taxonomic labels to the V4-ASVs, which are annotated in the legend.
The microbiome between healthy and leukemic Pax5+/−mice is distinct. (A) After antibiotic treatment, the beta diversity of the microbiomes shifted in a genotype-dependent manner and reconstituted over time toward a similar end point (Pax5+/–, yellow; WT, blue). Pairwise unweighted UniFrac distances (beta diversity) were computed for all samples. Distance metric was ordinated into 3D via PCoA and visualized using EMPeror. Axes indicate percentages of explained variance. Cones and spheres were used to visualize microbiomes of Pax5+/– and WT mice, respectively. Icon size indicates disease status, with larger icons for pB-ALL mice and smaller icons for healthy mice. Samples of the initial time point (darkest red), at transfer from SPF facilities to CFs before antibiotics treatment, clustered in the light blue pre-abx region. Samples with sufficient bacterial reads from the group that had 8 weeks of antibiotic treatment clustered in the green abx region. Samples shifted back after antibiotic treatment in a genotype-dependent manner (Pax5+/–, yellow; WT, blue) and reconstituted over time toward a similar end point. Their end point was significantly shifted from pre-abx, which was not the case for samples of mice that were housed in SPF facilities (orange trajectory). (B-C) Microbial V4-16S signatures (V4-ASVs) differentiated between healthy (B) and preleukemic (C) Pax5+/– mice. Shown are mean V4-ASV compositions for the top 13 differentially abundant (discrete FDR) features of all samples stratified by disease status. Samples were grouped by time point (x-axis) and visualized as 1 stacked bar each. A naive Bayesian classifier was applied against the Greengenes 13.8 reference to assign taxonomic labels to the V4-ASVs, which are annotated in the legend.
Dysbiosis in Pax5+/– mice translates into a distinct metabolome
Next, we investigated whether the metabolome composition in the sera of mice might enable us to identify genetic pB-ALL predisposition. To test this, we analyzed the metabolome of WT (n = 10) and Pax5+/– (n = 10 preleukemic; n = 10 leukemic) mice kept in the SPF facility using GC-MS (Figure 6A). In all, 56 different compounds were measured in the sera of mice. After removing 4 peaks with uncertain annotations, we used the relative response values for the remaining 52 quality-controlled gas chromatography peaks to create a feature table. Using Bray-Curtis dissimilarity, we computed beta-diversity distance matrix via Qiime2 version 2020.2. The principal coordinates analysis of the resulting matrix indicates clustering by genotype and health state (Figure 6B). Statistical tests (2-sided PERMANOVA tests with 999 permutations) showed significant differences in beta diversity between serum samples from WT and Pax5+/– mice. Applying discrete FDR (dsFDR) on the metabolite feature table, we found that 6 of the 52 compounds were significantly differentially abundant between WT and preleukemic Pax5+/– mice (Figure 6C). Another 16 compounds were found to be significantly differentially abundant in serum samples from healthy preleukemic Pax5+/– mice compared with serum samples from leukemic Pax5+/– mice (the top 6 are shown in Figure 6D). Taken together, the healthy preleukemic or leukemic metabolome was distinct and defined by several factors (Figure 7) rather than by a single specific metabolite or bacterial species.
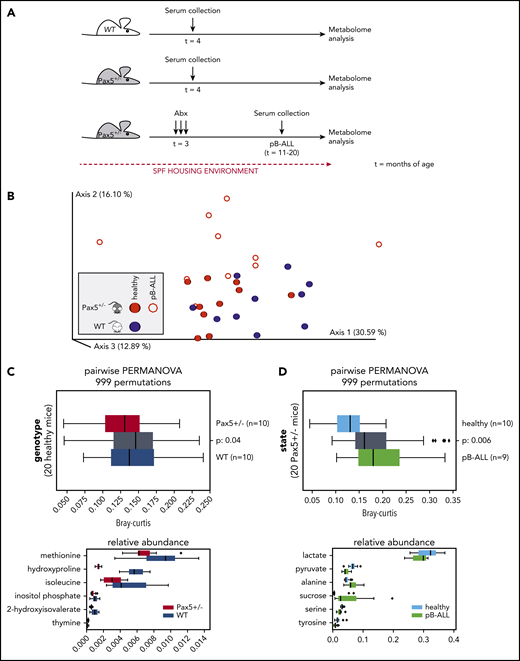
Metabolome analysis reveals systemic differences between WT and Pax5+/–mice predisposed to develop pB-ALL. (A) Overview of the experimental design is shown. Serum samples were collected from untreated WT (n = 10) and Pax5+/– (n = 10) mice born and housed in SPF facilities at 4 months of age. Additional samples were collected from 10 Pax5+/– mice kept in SPF facilities at onset of pB-ALL after treatment with antibiotics (at ∼15 months of age). (B) The relative response values for 52 quality-controlled gas chromatography peaks were used to create a feature table. Using Bray-Curtis, a beta-diversity distance matrix was computed via Qiime2 version 2020.2. The EMPeror plot shows the PCoA of the resulting matrix (blue, samples from WT mice; red, samples from Pax5+/– mice). Open circles represent leukemic mice, and filled circles represent healthy mice. Clustering indicated a difference by genotype based on measurements of 52 metabolites in the blood. (C-D) Statistical tests (PERMANOVA) confirmed strong significant differences depending on genotype (C) and health state (D). (C) The upper panel shows statistically significant (2-sided PERMANOVA tests with 999 permutations) differences in beta-diversity distance between blood samples from WT (blue) and Pax5+/– (red) mice. Gray box summarizes intergroup distances (ie, pairs of samples in which 1 partner belongs to WT and the other to Pax5+/–). The lower panel shows that after applying discrete FDR on the metabolite feature table, 6 of 52 compounds were found to be significantly differentially abundant between WT and Pax5+/– serum samples. (D) Upper panel visualizes the differences between serum samples from healthy Pax5+/– (light blue represents red solid spheres in panel B) and pB-ALL diseased (green represents red rings in panel B) individual mice. Lower panel shows the top 6 of 16 compounds found to be significantly differentially abundant among all 52 compounds in healthy and pB-ALL samples. The boxes show the quartiles of the dataset, while the whiskers (error bars) show the rest of the distribution, except for points that are determined to be outliers, using 1.5-fold of the interquartile range (C,D). P values are from the PERMANOVA test.
Metabolome analysis reveals systemic differences between WT and Pax5+/–mice predisposed to develop pB-ALL. (A) Overview of the experimental design is shown. Serum samples were collected from untreated WT (n = 10) and Pax5+/– (n = 10) mice born and housed in SPF facilities at 4 months of age. Additional samples were collected from 10 Pax5+/– mice kept in SPF facilities at onset of pB-ALL after treatment with antibiotics (at ∼15 months of age). (B) The relative response values for 52 quality-controlled gas chromatography peaks were used to create a feature table. Using Bray-Curtis, a beta-diversity distance matrix was computed via Qiime2 version 2020.2. The EMPeror plot shows the PCoA of the resulting matrix (blue, samples from WT mice; red, samples from Pax5+/– mice). Open circles represent leukemic mice, and filled circles represent healthy mice. Clustering indicated a difference by genotype based on measurements of 52 metabolites in the blood. (C-D) Statistical tests (PERMANOVA) confirmed strong significant differences depending on genotype (C) and health state (D). (C) The upper panel shows statistically significant (2-sided PERMANOVA tests with 999 permutations) differences in beta-diversity distance between blood samples from WT (blue) and Pax5+/– (red) mice. Gray box summarizes intergroup distances (ie, pairs of samples in which 1 partner belongs to WT and the other to Pax5+/–). The lower panel shows that after applying discrete FDR on the metabolite feature table, 6 of 52 compounds were found to be significantly differentially abundant between WT and Pax5+/– serum samples. (D) Upper panel visualizes the differences between serum samples from healthy Pax5+/– (light blue represents red solid spheres in panel B) and pB-ALL diseased (green represents red rings in panel B) individual mice. Lower panel shows the top 6 of 16 compounds found to be significantly differentially abundant among all 52 compounds in healthy and pB-ALL samples. The boxes show the quartiles of the dataset, while the whiskers (error bars) show the rest of the distribution, except for points that are determined to be outliers, using 1.5-fold of the interquartile range (C,D). P values are from the PERMANOVA test.
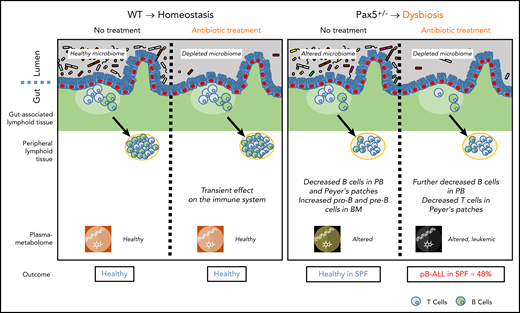
In the absence of natural infection, pB-ALL development can be triggered by cooperation between a genetic predisposition and microbiome changes. Left panel: in WT mice, a short-term depletion of bacteria in the gut microbiome using antibiotic treatment led to a transient effect on the immune system (including the gut-associated and peripheral lymphoid tissues). In this scenario, mice do not develop pB-ALL. Right panel: the Pax5 mutation altered the microbiome composition and affected B-cell maturation. The dysbiosis translated into an altered plasma metabolome. In the absence of a natural infectious environment, untreated Pax5+/– mice did not develop leukemia. However, in response to a transient depletion of the bacteria in the microbiome at age 8 weeks, pB-ALL was induced in 48% of the mice between age 11 and 21 months. Leukemia development was preceded by more prominent effects on the immune system13 and was associated with an altered plasma metabolome.
In the absence of natural infection, pB-ALL development can be triggered by cooperation between a genetic predisposition and microbiome changes. Left panel: in WT mice, a short-term depletion of bacteria in the gut microbiome using antibiotic treatment led to a transient effect on the immune system (including the gut-associated and peripheral lymphoid tissues). In this scenario, mice do not develop pB-ALL. Right panel: the Pax5 mutation altered the microbiome composition and affected B-cell maturation. The dysbiosis translated into an altered plasma metabolome. In the absence of a natural infectious environment, untreated Pax5+/– mice did not develop leukemia. However, in response to a transient depletion of the bacteria in the microbiome at age 8 weeks, pB-ALL was induced in 48% of the mice between age 11 and 21 months. Leukemia development was preceded by more prominent effects on the immune system13 and was associated with an altered plasma metabolome.
Discussion
The gut microbiome has been proposed to affect several diverse diseases, including Crohn’s disease,51 Parkinson’s disease,52,53 and cancer.54,55 A recent landmark study analyzed whole-genome and whole-transcriptome data from more than 18 000 samples from treatment-naïve patients with cancer for unique microbial signatures. With the help of artificial intelligence models, it was possible to discriminate between cancer types, between different stages of the same cancer, and between nonmalignant and malignant tissues. Although it is groundbreaking in terms of its completeness and diagnostic potential, this study could not answer the question of whether microbes were mechanistically involved in cancer development or were simply passengers in an already disturbed tumor microenvironment.51 In this study, we provide another piece of data that links a leukemia-prone genotype to an altered, dysbiotic gut microbiome (Figure 7). We showed that a subclinical genetic Pax5 predisposition shapes the gut microbiome in a manner that is clearly distinct from the microbiome of healthy genetically nonsusceptible mice. By using artificial intelligence, we were able to demonstrate that genetically predisposed mice can be predicted with high accuracy based on the composition of their gut microbiome. This finding argues against a mere bystander effect because dysbiosis was observed months before the onset of disease. Gut dysbiosis seems to be a key factor in determining the compositional abundance of Alistipes in the gut.52 Alistipes are commensal gram-negative bacteria found within the gut of primarily healthy animals and humans. They are rarely pathogenic53 and are more commonly reported to have protective effects against diseases, including cancer, colitis, liver fibrosis, and cardiovascular disease.52 Whole-metagenomics sequencing of fecal samples from patients at diagnosis of epithelial cancers showed that Alistipes are associated with a good antitumor immune response and response to immune checkpoint blockade therapy.54 Alistipes and other commensals have been shown to modulate the tumor microenvironment by inducing tumor-associated myeloid cells to produce tumor necrosis factor via TLR4 signaling, which can lead to tumor eradication.55 The significant impact of the microbiome on treatment response to the immunotherapies widely used in cancer patients has been shown in pioneering studies in mice56 and has since been confirmed by many independent studies involving human patients.54,57,58 As in our study, this immunomodulatory therapeutic effect could not be exclusively attributed to a single or even few specific microbes. Furthermore, there was little or no overlap among the studies in terms of the specific microbiome composition. Thus, a generally dysbiotic state might be the main mechanism leading to a wide variety of human diseases.59
In line with these findings, our results may pave the way to establish the gut microbiome as a biomarker that potentially could allow the identification of children at risk of developing pB-ALL. The gut microbiome serves as an integration hub for environmental signals that modulate and shape the immune system in general.33 It remains to be seen whether and how microbes precisely affect the preleukemic cell clone in terms of its expansion or acquisition of successive mutations.
Our bone marrow transplantation and GC-MS experiments show that the Pax5 predisposition itself alters the microbiome and that these profound changes may lead to systemic effects and not just local effects within the gut. It would be interesting to investigate whether the Pax5+/– model can recapitulate the situation in children where a slightly increasing incidence of childhood pB-ALL in developed countries parallels widespread use of antibiotics.20-22,56-59 Given the rarity of predisposing Pax5 germline mutations in children with pB-ALL, other preleukemic conditions caused by the more frequent ETV6-RUNX1 fusion, ETV6 germline mutations, or single nucleotide polymorphisms associated with the recently discovered high polygenic risk score for childhood ALL60 should be studied in more detail with respect to microbiome dysbiosis. However, such samples are not easily collected because a large series of longitudinal sampling is required from birth onward.20-22,61-64 Population-based studies are currently being initiated, and their results may have broad implications for clinical practice and public health. Antibiotics represent one of the most widely used medical interventions, and the collateral damage of early-life antibiotic treatment in the gut microbiome is persistent.65 Further research is required to define the exact mechanisms underlying the interplay between the microbiome, precursor B cells, and leukemia development in genetically predisposed carriers.
The gene expression data discussed in this publication have been deposited in the National Center for Biotechnology Information’s (NCBI’s) Gene Expression Omnibus (GEO), and are accessible through GEO Series accession numbers GSE62529 and GSE139547. All sequence data related to this study are available upon request from the European Nucleotide Archive (ENA) under the EBI accession numbers ERP117668, ERP117561, ERP122653, and ERP122650. Bioinformatics analyses are deposited here: https://github.com/jlab/microbiome_pax5/archive/1.0.0.zip.
The online version of this article contains a data supplement.
The publication costs of this article were defrayed in part by page charge payment. Therefore, and solely to indicate this fact, this article is hereby marked “advertisement” in accordance with 18 USC section 1734.
Acknowledgments
The authors thank all members of our groups for useful suggestions and critical reading of the manuscript; Lena Petzmann, Kerstin Becker, Katayoun Alemazkour, Daniel Scholtyssik, Layal Yasin, and Deya Alzoubi for next-generation sequencing and analysis; and Sven Reister (QIAGEN) for valuable scientific advice.
This study and research in the C.V.-D. group were supported by FEDER, “Miguel Servet” Grant (CP14/00082-AES 2013-2016) from the Instituto de Salud Carlos III (Ministerio de Economía y Competitividad), “Fondo de Investigaciones Sanitarias/Instituto de Salud Carlos III” (PI17/00167). J.H. was supported by ERAPer Med “GEPARD”, the German Cancer AID (Translational Oncology Program 70112951), the ERCStg 85222 “PreventALL”, The German Jose Carreras Foundation (DJCLS 02R/2016 and 07R/2019), and the Kinderkrebsstiftung (2016/17). A.B. was supported by the Katharina-Hardt-Stiftung, the German Children’s Cancer Foundation, and the Federal Ministry of Education and Research, Bonn, Germany. The I.S.-G. group was partially supported by SAF2015-64420-R MINECO/FEDER, UE, RTI2018-093314-B-I00 MCIU/AEI/FEDER, UE, and by Junta de Castilla y León (UIC-017, CSI001U16, and CSI234P18). The I.S.-G. laboratory is a member of the EuroSyStem and the DECIDE Network funded by the European Union under the FP7 program. A.B. and I.S.-G. were supported by the German Carreras Foundation (DJCLS R13/26). A.B., U.F., D.H. (FKZ: 3618S32275 and 3618S32274), I.S.-G., and C.V.-D. (FKZ: 3618S32274) were supported by the German Federal Office for Radiation Protection (BfS). Computational support and infrastructure was provided by the “Centre for Information and Media Technology” (ZIM) at the Heinrich-Heine-University of Düsseldorf. U.F. was supported by the German Carreras Foundation (DJCLS 21R/2019) and by the Research Commission of the Medical Faculty of the Heinrich-Heine-University of Düsseldorf (2016/70). D.H. was supported by the Research Commission of the Medical Faculty of the Heinrich-Heine-University of Düsseldorf (2019/03). The Cluster of Excellence on Plant Sciences (CEPLAS) Plant Metabolism and Metabolomics Laboratory is funded by the German Research Foundation (DFG) under Germany´s Excellence Strategy – EXC-2048/1 – Project ID: 390686111.
Authorship
Contribution: C.V.-D., S.J., U.F., I.S.-G., and A.B. conceived and designed the project; P.W., A.P.M.W., C.V.-D., S.J., M.O., F.A., I.G.-H., A.C.-G., M.I.-H., J.R.-G., D.H., K.L.G., D.A.-L., J.D.L.R., S.B., F.J.G.-C., M.B.G.-C., K.K., J.H., U.F., I.S.-G., and A.B. developed the methodology; M.B.G.-C., F.J.G.-C., and C.V.-D. performed the pathology review; C.V.-D., S.J., M.O., D.A.-L., K.K., and U.F. were responsible for analyzing and interpreting the data (statistical analysis, biostatistics, computational analysis); A.A.P., P.W., C.V.-D., S.J., M.O., F.A., I.G.-H., A.C.-G., M.I.-H., J.R.-G., D.H., K.L.G., D.A.-L., J.D.L.R., S.B., F.J.G.C., M.B.G.C., K.K., J.H., U.F., I.S.-G., and A.B. prepared the manuscript; P.W., A.P.M.W., C.V.-D., S.J., M.O., F.A., I.G.-H., A.C.-G., M.I.-H., J.R.-G., D.H., K.K., J.H., U.F., I.S.-G., and A.B. provided administrative, technical, or material support (reporting or organizing data, constructing databases); and C.V.-D., S.J., U.F., I.S.-G. and A.B. supervised the study.
Conflict-of-interest disclosure: The authors declare no competing financial interests.
Correspondence: Carolina Vicente-Dueñas, Instituto de Investigación Biomédica de Salamanca, Centro de Investigación del Cáncer (CSIC-Universidad de Salamanca), Campus Miguel de Unamuno 37007 Salamanca, Spain; e-mail: cvd@usal.es; Stefan Janssen, Algorithmic Bioinformatics, Justus-Liebig-University Gießen, Heinrich-Buff-Ring 58, 35392 Gießen, Germany; e-mail: stefan.janssen@computational.bio.uni-giessen.de; Ute Fischer, Department of Pediatric Oncology, Hematology and Clinical Immunology, Medical Faculty, Heinrich Heine University, Moorenstr 5, 40225 Düsseldorf, Germany; e-mail: ute.fischer@med.uni-duesseldorf.de; Isidro Sánchez-García, Experimental Therapeutics and Translational Oncology Program, Instituto de Biología Molecular y Celular del Cáncer, CSIC-USAL, Campus Miguel de Unamuno, 37007 Salamanca, Spain; e-mail: isg@usal.es; and Arndt Borkhardt, Department of Pediatric Oncology, Hematology and Clinical Immunology, Medical Faculty, Heinrich Heine University, Moorenstr 5, 40225 Düsseldorf, Germany; e-mail: arndt.borkhardt@med.uni-duesseldorf.de.
