

Key Points
In vivo metabolic dependencies of malignant (vs normal counterpart) cells can be defined by ex vivo screening.
Aldh3a2 is synthetically lethal with GPX4 inhibition, providing a combination therapy approach based solely on metabolic state.

Abstract
Metabolic alterations in cancer represent convergent effects of oncogenic mutations. We hypothesized that a metabolism-restricted genetic screen, comparing normal primary mouse hematopoietic cells and their malignant counterparts in an ex vivo system mimicking the bone marrow microenvironment, would define distinctive vulnerabilities in acute myeloid leukemia (AML). Leukemic cells, but not their normal myeloid counterparts, depended on the aldehyde dehydrogenase 3a2 (Aldh3a2) enzyme that oxidizes long-chain aliphatic aldehydes to prevent cellular oxidative damage. Aldehydes are by-products of increased oxidative phosphorylation and nucleotide synthesis in cancer and are generated from lipid peroxides underlying the non–caspase-dependent form of cell death, ferroptosis. Leukemic cell dependence on Aldh3a2 was seen across multiple mouse and human myeloid leukemias. Aldh3a2 inhibition was synthetically lethal with glutathione peroxidase-4 (GPX4) inhibition; GPX4 inhibition is a known trigger of ferroptosis that by itself minimally affects AML cells. Inhibiting Aldh3a2 provides a therapeutic opportunity and a unique synthetic lethality to exploit the distinctive metabolic state of malignant cells.
Introduction
The metabolism of cancer cells and that of their normal tissue counterparts are distinct.1,2 Within the heterogeneous populations of some cancers, stem-like cells associated with treatment resistance3-7 may also have different metabolic dependencies.8-10 These are not readily identified by genotypic or transcriptomic analyses, yet they may offer therapeutic possibilities.11-14
Hematopoiesis is particularly well suited for testing cell state–specific dependencies because of the reliable analytical tools available. Normal granulocyte macrophage progenitors (N-GMPs) and their malignant counterparts leukemia GMPs (L-GMPs) in the MLL-AF9 acute myeloid leukemia (AML) model provide such an opportunity.
Primary bone marrow (BM) stroma partially simulates ex vivo the metabolic context of the intact marrow.15 Comparing N-GMPs and L-GMPs on primary BM stroma, we evaluated short hairpin RNA (shRNA) for 162 rate-limiting or L-GMP–overexpressed metabolic enzymes. We provide proof of principle that such a screen can identify unsuspected metabolic vulnerabilities in cancer stem/progenitor cells.
Aldehyde dehydrogenase 3a2 (Aldh3a2) was a dependency of L-GMPs not seen in N-GMPs. It protects AML cells from oxidative cell death, and Aldh3a2 inhibition improved leukemia outcomes in vivo without compromising normal hematopoiesis. Loss of Aldh3a2 induces an iron-dependent form of cell death, but it is distinctive from the peroxide cell killing (ferroptosis) induced by glutathione peroxidase-4 (GPX4) inhibition.16,17 Whereas GPX4 inhibition alone has only modest effects on AML, it is superadditive with Aldh3a2 inhibition in vitro and in vivo. Metabolically focused synthetic lethality is a potential treatment strategy.
Materials and methods
Mice
C57BL/6J, B6.SJL-Ptprca Pep3b/BoyJ (B6.SJL), B6.Cg-Tg(Mx1-cre)1Cgn/J (Mx1-Cre), C57BL/6-Tg(CAG-EGFP)1Osb/J mice (actin-GFP), B6.Cg-Tg(CAG-DsRed*MST)1Nagy/J (actin-DsRed), and B6.129S4-Gt(ROSA)26Sortm1(FLP1)Dym/RainJ (FLP recombinase) mice were purchased from Jackson Laboratory. Frozen embryos for C57BL/6NTac-Aldh3a2 tm1a(EUCOMM)Wtsi/IcsOrl mice were obtained from EMMA mouse repository and grown into adult mice. Constitutional Aldh3a2-deficient mice (on a C57BL/6J background) were produced and obtained from the laboratory of Dr William Rizzo at University of Nebraska Medical Center.
For the development of the Aldh3a2 conditional knockout (KO) model, C57BL/6NTac-Aldh3a2 tm1a(EUCOMM)Wtsi/IcsOrl mice were crossed with FLP recombinase–expressing mice. The mice thus obtained, designated Aldh3a2 loxp/loxp mice, were crossed with Mx1-Cre mice to obtain Aldh3a2 loxp/loxp Mx1-Cre−/− (Aldh3a2-Ctrl) or Aldh3a2 loxp/loxp Mx1-Cre+/− mice (Aldh3a2-mut). The Harvard University Institutional Animal Care and Use Committee and the Subcommittee on Research Animal Care of the Massachusetts General Hospital approved all animal work.
Screen
The screen was carried out in 384-well plates arrayed with pLKO.1-based lentiviruses expressing shRNAs against the genes selected. Control wells contained lentiviruses expressing empty pLKO.1 vector. Eight hundred Ds-Red+ L-GMPs or N-GMPs were plated into wells. Polybrene (Millipore Sigma) and spinfection were used for infection, and puromycin (InvivoGen) was used for selection of infected cells.
After 36 hours of selection, 2200 GFP+ stroma cells were added to the wells in conditioned media. Conditioned media are media in which the fourth passage of CD45− and CD105+ cells expressing GFP under a β-actin promoter has been maintained for 4 days prior.18 This coculture proceeded for 96 hours, and the plates were then imaged using an Image Xpress Microscope (Molecular Devices, Sunnyvale, CA). Data were analyzed using MetaXPress software (Molecular Devices) and CellProfiler.19
The schema for scoring of hits is defined in supplemental Figure 1, available on the Blood Web site.
Survival analysis
Six- to 12-week-old Aldh-mut and Aldh-Ctrl mice were used to generate MLL-AF9 leukemia through retroviral transduction. This was transplanted into lethally irradiated (9 Gy) primary leukemic C57BL/6J mice and then into sublethally irradiated (4.5 Gy) secondary leukemic C57BL/6J mice. Forty-eight hours after injection into secondary recipients, these mice received 3 doses of polyinosinic-polycytidylic acid (GE Healthcare) on alternate days. These mice were followed out to moribund status. When indicated, mice received induction chemotherapy, consisting of cytarabine (100 mg/kg intraperitoneally) and doxorubicin (3 mg/kg intraperitoneally) administered in a 5 + 3 regimen.20
Characterization of normal hematopoiesis
Constitutional as well as conditional Aldh3a2 mice were used. Enumeration of normal cell types and transplantation assays were performed as previously described.21
Measurement of Aldh3a2 enzyme activity
FALDH was assayed in homogenates of 0.5 million mononuclear BM cells from Aldh3a2 wild-type (WT) and Aldh3a2 KO mice using octadecanol (Sigma) as substrate as previously described.22
Measurement of alcohols
Alcohols were measured in bulk leukemic cells as described.23
Fatty acid methyl ester analysis
Long-chain fatty acids were quantified in 100 000 L-GMPs infected with control shRNA or Aldh3a2-sh-1 as previously described.24
Lipidomics
Sorted GFP+ leukemic cells obtained from the BM of Aldh3a2-Ctrl and Aldh3a2-mut mice were lysed in ice-cold methanol, and nonpolar metabolites were extracted using methanol-chloroform phase separation (methanol/water/chloroform in 2:1:4 ratio). Lipidomic profiling was then performed on the chloroform fractions on a ThermoFisher Q‐exactive equipped with HESI source and BioBond column (50 × 4.6 mm; 5-µm C4, with guard column; Dikmatech). A volume of 15 µL was injected, and the full mass spectrum was obtained in both positive and negative modes (0-60 minutes; resolution, 70 000; AGC target, 1e6; m/z range, 150-2000; dd-MS2: resolution, 35 000; AGC target, 1e5). For positive mode, mobile phase A consisted of 5 mM of ammonium formate, 0.1% formic acid, and 5% methanol, in water, and mobile phase B consisted of 5 mM of ammonium formate, 0.1% formic acid, 5% water, 35% methanol, and 60% isopropanol. For negative mode, mobile phase A consisted of 0.03% ammonium hydroxide and 5% methanol, in water, and mobile phase B consisted of 0.03% ammonium hydroxide, 5% water, 35% methanol, and 60% isopropanol. Analysis was performed in an untargeted manner using LipidSearch software (ThermoFisher Scientific).
Lipid peroxidation assay
Spleens from Aldh3a2-Ctrl and Aldh3a2-mut mice were used to obtain single-cell suspensions and were incubated with Bodipy lipid peroxidation sensor 665/676 (ThermoFisher catalog #B3932) or CellRox reagent (ThermoFisher catalog #C10491) for 30 minutes at 37°C. Cells were stained with biotinylated antibodies against lineage markers, Pacific Orange–streptavidin conjugate (ThermoFisher), and APC Rat Anti-Mouse CD117 (BD Biosciences) and read on the LSRII flow cytometer. Lipid peroxidation and cellular reactive oxygen species (ROS) were assessed in Lineage− c-Kit+ and Lineage− c-Kithi populations.
Human cell line experiments
AML cell lines HL60, MOLM-14, MONOMAC-6, NB4, NOMO-1, and THP1 were obtained from the American Type Culture Collection and the Leibniz Institute DSMZ–German Collection of Microorganisms and Cell Cultures. Primary human AML samples were obtained from the University of Pennsylvania Tumor Tissue and Biospecimen Bank and the Massachusetts General Hospital Leukemia Bank. Cells were infected with pLKO.1-based lentivirus expressing Aldh3a2 shRNA A or B or control shRNA, selected with puromycin for infection, and plated in white polystyrene 96-well plates. Celltiter GloR 2.0 reagent (Promega) was reconstituted per manufacturer’s instructions, and 50 µL was added to each well. The plate was imaged using Gen5 software (BioTek) on the BioTek Synergy HTX Machine (BioTek).
Oleic acid rescue experiments
Oleic acid (Sigma), complexed to fatty acid–free bovine serum albumin, was added (at 62 or 125 µM) to Lin−cKit+ leukemic cells in RPMI containing 10 ng/µL of murine interleukin-3 (IL-3), IL-6, and stem cell factor. Ethanol was used as control. Number of cells was measured by Celltiter GloR 2.0 assay after 72 hours.
Drug experiments
4-hydroxynonenal (4-HNE; 5 µM), ZVAD (10 µM), ferrostatin (10 µM), or RSL3 (5 µM) was added to Lin−cKit+ leukemic cells in RPMI containing 10 ng/µL of murine IL-3, IL-6, and stem cell factor. Number of cells was measured by Celltiter GloR 2.0 assay at days 0, 1, and 3. N-acetyl cysteine (NAC) was added to THP1 cells in RPMI at 10 mM. Drugs were purchased from Sigma.
Statistics
Unpaired, 2-tailed Student t test was used. Data were plotted as average ± standard deviation for samples following a normal (Gaussian) distribution. Alternatively, Mann-Whitney U test was used, and data were plotted as median ± interquartile range. The Kaplan-Meier statistic was used for the comparison of survival curves. Five to 7 mice were used in each group in each experiment. Experiments were repeated at least twice. For analysis of luminescence in 96-well plates, plate maps were created; the average of the luminescence was calculated for each set of wells carrying cells infected with a particular virus. This average was normalized to the average of the luminescence for wells carrying cells infected with control shRNA per day. Plates were read on days 0, 1, 2, and 4 and normalized to day-0 values. Statistical significance is indicated as follows: *P < .05, **P < .01, and ***P < .001.
Results
Loss-of-function screen reveals metabolic vulnerabilities in MLL-AF9–driven AML
To assess metabolic dependencies in AML, we used the previously described MLL-AF9 retrovirally induced AML model.25 This allowed for isolation of leukemic stem/progenitor cells (LSPCs), which share the immunophenotype of the N-GMPs (Linlow, Sca1−, cKit+, CD34+, CD16/32+). We focused on LSPCs because they can survive induction chemotherapy and result in relapsed disease.7
BM from actin-DsRed mice, treated with 5-fluourouracil, was isolated, retrovirally transduced with MLL-AF9 (gift from Dr Scott Armstrong), and transplanted into lethally irradiated (9 Gy) C57BL/6J recipient mice (primary leukemia recipients). When these mice became moribund, BM was isolated and injected into sublethally irradiated (4.5 Gy) C57BL/6J mice (secondary leukemia recipients). When these mice became moribund, L-GMPs were fluorescence-activated cell sorted, plated in 384-well plates (800 cells per well), and transduced on an array format with shRNAs targeting 117 canonical rate-limiting metabolic enzymes as selected from classic texts26 as well as 45 metabolic genes overexpressed in L-GMPs vs N-GMPs25 (Figure 1A; supplemental Table 1). N-GMPs from actin-DsRed mice were also transduced with the same shRNAs. An average of 5 shRNAs per gene obtained from the Broad Institute RNAi Consortium were used.27 Puromycin selection (36 hours) was performed.

Loss-of-function screen reveals metabolic vulnerabilities in MLL-AF9–driven AML. (A) Heatmap showing 45 metabolic genes overexpressed in L-GMPs as compared with N-GMPs in the retrovirus-based MLL-AF9 leukemia model.25 (B) Experimental workflow for the genetic depletion screen. (C) Distribution of the number of shRNA-modified L-GMPs per well relative to the number of L-GMPs per control well on the respective plate. Any gene for which ≥3 shRNAs decreased the number of L-GMPs <1.5 standard deviations (SDs) of the mean of L-GMPs in control wells, in technical duplicate, was counted as a hit as long as ≤1 shRNA decreased numbers of N-GMPs <1.5 SDs for the same gene. Aldh3a2, among all sh-RNAs, is shown in red. (D) Number of L-GMPs was decreased <1.5 SDs in 3 wells carrying independent Aldh3a2 shRNAs in the screen.
Loss-of-function screen reveals metabolic vulnerabilities in MLL-AF9–driven AML. (A) Heatmap showing 45 metabolic genes overexpressed in L-GMPs as compared with N-GMPs in the retrovirus-based MLL-AF9 leukemia model.25 (B) Experimental workflow for the genetic depletion screen. (C) Distribution of the number of shRNA-modified L-GMPs per well relative to the number of L-GMPs per control well on the respective plate. Any gene for which ≥3 shRNAs decreased the number of L-GMPs <1.5 standard deviations (SDs) of the mean of L-GMPs in control wells, in technical duplicate, was counted as a hit as long as ≤1 shRNA decreased numbers of N-GMPs <1.5 SDs for the same gene. Aldh3a2, among all sh-RNAs, is shown in red. (D) Number of L-GMPs was decreased <1.5 SDs in 3 wells carrying independent Aldh3a2 shRNAs in the screen.
Stromal cells (CD105+, CD45−) from BM of actin-GFP mice were plated at 2200 cells per well in 384-well plates. Transduced N-GMPs or L-GMPs were cocultured with stroma to approximate the niche influence observed in vivo. Four days after stromal coculture, cell content per well was evaluated by the high-content imaging system ImageXpress Micro XLS and CellProfiler19 (Figure 1B; supplemental Figure 1). Changes in cell counts >1.5 times the standard deviation above or below the mean number of cells infected with control virus were considered significant. Candidate metabolic vulnerabilities were selected based on the criteria that at least 3 independent shRNAs targeting the same gene reduced cell number in L-GMPs but not N-GMPs (Figure 1C-D).
Six candidates were identified, and we focused our attention on Aldh3a2. In recent years, fatty acid metabolism has been investigated in AML and in normal hematopoiesis.28,29 However, little is known about fatty acid anabolism in LSPCs; because Aldh3a2 is involved in long-chain fatty acid metabolism, this gene was chosen for further study.
Aldh3a2 is essential for leukemia cells in vitro and in vivo
Aldehyde dehydrogenases comprise a family of enzymes that oxidize aldehydes to acids. Aldh3a2 is 1 member targeting longer-chain aliphatic aldehydes.22
Aldh3a2 is found in normal myeloid cells and in primary AML cells.30,31 However, its functional role in normal and malignant hematopoiesis is unclear. To validate our screening results, we confirmed Aldh3a2 expression in primary L-GMPs (Figure 2A)25 and evaluated 2 distinct shRNAs (Aldh3a2-sh-1 and Aldh3a2-sh-2) that decreased Aldh3a2 expression in L-GMPs (Figure 2B). Aldh3a2 knockdown in L-GMPs decreased the number of cells in a methylcellulose assay (Figure 2C; supplemental Figure 2A) that quantifies growth on a per-cell basis.
![Aldh3a2 is essential for leukemia cells in vitro and in vivo. (A) Relative Aldh3a2 expression in L-GMPs vs N-GMPs.25 (B) Validation of Aldh3a2 knockdown by 2 independent shRNAs (Aldh3a2-sh-1 and Aldh3a2-sh-2 from the screen) by quantitative polymerase chain reaction. (C) Aldh3a2 knockdown with 2 independent shRNAs significantly decreases the number of L-GMPs in methylcellulose compared with L-GMPs infected with control shRNA. (D) L-GMPs were infected with shRNA Aldh3a2-sh-1, Aldh3a2-sh-2, or control and injected into sublethally irradiated C57BL6/J mice for disease development. Kaplan-Meier survival curve of animals that developed leukemia is shown. (E) Sublethally irradiated C57BL/6J mice were injected with Aldh3a2fl/fl:Mx1-Cre+ (Aldh3a2-mut) and Aldh3a2fl/fl:Mx1-Cre− (Aldh3a2-ctrl) leukemia cells from primary leukemic mice. Forty-eight hours after injection of cells, mice were injected with 3 doses of polyinosinic-polycytidylic acid [Poly(I):Poly(C)] on alternate days, and leukemia development was monitored. Kaplan-Meier survival curve of animals that developed leukemia is shown. Data are representative of ≥2 independent experiments; n = 5 mice per genotype per experiment. Data are represented as mean ± standard deviation. P > .05 was considered nonsignificant. *P < .05, **P < .01, ***P < .001.](https://ash.silverchair-cdn.com/ash/content_public/journal/blood/136/11/10.1182_blood.2019001808/3/m_bloodbld2019001808f2.png?Expires=1763525209&Signature=ec09F4XomcRDivBjLTXt4F~HfEAPC~sWyWAOAcVpN8i0AhCsmaBPe5niob-D4FwgFfH-1MfYmXH3NKVoWf7WwH~ekL3G~rM-i6Dd6nKSskMHOr2nngO9--OvNtBji7ZhzrpllWD0UnOSAuDX4h2YpEcrSEP0sz1uADg66Ht0VGZ3jywY3~XcZhx1xZiTWt~d3HFCfhELSELfCe2AxIXkjSr~cTSgDMTN3s3RZx-MIO~5JeYnd9G3aq4OWGPWtiEITIm7h5du07bI88qZMct8xFGlSY3TyLEG89x2gCB67Vp9dd85PYBhlcYO07S9mVxjWRPuE9OzzHj4rL4VYgVRSw__&Key-Pair-Id=APKAIE5G5CRDK6RD3PGA)
Aldh3a2 is essential for leukemia cells in vitro and in vivo. (A) Relative Aldh3a2 expression in L-GMPs vs N-GMPs.25 (B) Validation of Aldh3a2 knockdown by 2 independent shRNAs (Aldh3a2-sh-1 and Aldh3a2-sh-2 from the screen) by quantitative polymerase chain reaction. (C) Aldh3a2 knockdown with 2 independent shRNAs significantly decreases the number of L-GMPs in methylcellulose compared with L-GMPs infected with control shRNA. (D) L-GMPs were infected with shRNA Aldh3a2-sh-1, Aldh3a2-sh-2, or control and injected into sublethally irradiated C57BL6/J mice for disease development. Kaplan-Meier survival curve of animals that developed leukemia is shown. (E) Sublethally irradiated C57BL/6J mice were injected with Aldh3a2fl/fl:Mx1-Cre+ (Aldh3a2-mut) and Aldh3a2fl/fl:Mx1-Cre− (Aldh3a2-ctrl) leukemia cells from primary leukemic mice. Forty-eight hours after injection of cells, mice were injected with 3 doses of polyinosinic-polycytidylic acid [Poly(I):Poly(C)] on alternate days, and leukemia development was monitored. Kaplan-Meier survival curve of animals that developed leukemia is shown. Data are representative of ≥2 independent experiments; n = 5 mice per genotype per experiment. Data are represented as mean ± standard deviation. P > .05 was considered nonsignificant. *P < .05, **P < .01, ***P < .001.
Aldh3a2 is essential for leukemia cells in vitro and in vivo. (A) Relative Aldh3a2 expression in L-GMPs vs N-GMPs.25 (B) Validation of Aldh3a2 knockdown by 2 independent shRNAs (Aldh3a2-sh-1 and Aldh3a2-sh-2 from the screen) by quantitative polymerase chain reaction. (C) Aldh3a2 knockdown with 2 independent shRNAs significantly decreases the number of L-GMPs in methylcellulose compared with L-GMPs infected with control shRNA. (D) L-GMPs were infected with shRNA Aldh3a2-sh-1, Aldh3a2-sh-2, or control and injected into sublethally irradiated C57BL6/J mice for disease development. Kaplan-Meier survival curve of animals that developed leukemia is shown. (E) Sublethally irradiated C57BL/6J mice were injected with Aldh3a2fl/fl:Mx1-Cre+ (Aldh3a2-mut) and Aldh3a2fl/fl:Mx1-Cre− (Aldh3a2-ctrl) leukemia cells from primary leukemic mice. Forty-eight hours after injection of cells, mice were injected with 3 doses of polyinosinic-polycytidylic acid [Poly(I):Poly(C)] on alternate days, and leukemia development was monitored. Kaplan-Meier survival curve of animals that developed leukemia is shown. Data are representative of ≥2 independent experiments; n = 5 mice per genotype per experiment. Data are represented as mean ± standard deviation. P > .05 was considered nonsignificant. *P < .05, **P < .01, ***P < .001.
To evaluate Aldh3a2 knockdown in vivo, 10 000 L-GMPs expressing Aldh3a2-sh-1, Aldh3a2-sh-2, or control shRNA were transplanted into sublethally irradiated C57BL/6J recipient mice and followed over time. Animals receiving cells in which Aldh3a2 expression was reduced survived significantly longer than control animals (Figure 2D).
To exclude off-target effects of shRNAs, a conditional mouse model in which exon 4 of the Aldh3a2 gene was flanked by loxP sites (supplemental Figure 2B) was crossed with mice expressing Mx1-Cre to allow deletion of Aldh3a2 in the hematopoietic system. BM cells from 5-fluourouracil–treated Aldh3a2fl/fl:Mx1-Cre− (Aldh3a2-Ctrl) and Aldh3a2fl/fl:Mx1-Cre+ (Aldh3a2-mut) mice were infected with MLL-AF9 retrovirus expressing GFP downstream of an internal ribosomal entry site. Cells were transplanted into lethally irradiated C57BL/6J recipients. When mice became moribund, primary BM leukemic cells were isolated, expanded, and transplanted into sublethally irradiated C57BL/6J mice. Two days after transplantation, Cre-recombinase expression and Aldh3a2 deletion were induced by polyinosinic-polycytidylic acid. We confirmed that this strategy deletes both splice variants of the Aldh3a2 gene by quantitative polymerase chain reaction for Aldh3a2 (Faldh)-N and Aldh3a2 (Faldh)-V (supplemental Figure 2C-D). Deletion of Aldh3a2 in the conditional mouse model led to a significantly increased overall survival (Figure 2E).
These data indicate that Aldh3a2 is important for L-GMPs and therefore constitutes a previously unrecognized vulnerability in MLL-AF9–driven leukemias.
Aldh3a2 is dispensable for normal hematopoiesis
We investigated whether Aldh3a2 is dispensable for normal hematopoiesis, as suggested from our screen. Aldh3a2 knockdown in N-GMPs did not decrease cell growth in a methylcellulose assay (Figure 3A). We then used a constitutive KO mouse model where Aldh enzyme activity was decreased to <50% of that in WT control mice (Figure 3B). This model consists of a deletion of exon 4 of the Aldh3a2 gene, which completely destroys Aldh3a2 enzyme activity, but assays of cell homogenates measure total fatty aldehyde oxidizing activity, including aldehyde dehydrogenases other than Aldh3a2. Immunophenotypic analysis in these mice revealed no significant differences in the percentages of hematopoietic stem cells (Linlow, cKit+, Sca1+, CD48−, CD150+), progenitor cells (common myeloid progenitors: Linlow, cKit+, Sca1−, CD34+, CD16/32−; granulocyte monocyte precursors: Linlow, cKit+, Sca1−, CD34+, CD16/32+; and megakaryocyte erythroid precursors: Linlow, cKit+, Sca1−, CD34−, CD16/32−), and mature lymphoid (B220+ or CD3+) and myeloid cells (Mac-1+) in Aldh3a2 KO BM (Figure 3C-E). Furthermore, Aldh3a2 KO hematopoietic stem cells showed an equivalent capacity to reconstitute hematopoiesis and give rise to all blood cell lineages in a 1:1 competitive BM transplantation assay compared with Aldh3a2 WT cells (Figure 3F-G).
![Aldh3a2 is dispensable for normal hematopoiesis. (A) Aldh3a2 knockdown with Aldh3a2-sh-1 shows no difference in the number of N-GMPs in methylcellulose compared with N-GMPs infected with control shRNA (n = 3 wells per group). (B) Aldh3a2−/− mice (KO) show one half of total aldehyde dehydrogenase enzyme activity in whole BM compared with Aldh3a2+/+ mice (WT). (C-E) BM analysis showing frequency of Lin−cKit+Sca1+CD48−CD150+ hematopoietic stem cells (HSCs) (C), committed myeloid progenitors (common myeloid progenitors [CMPs], granulocyte-monocyte progenitors [GMPs], and megakaryocyte-erythrocyte progenitors [MEPs]) (D), and B cells (B220+) and myeloid cells (Mac1+) (E) in Aldh3a2-WT and Aldh3a2-KO mice. (F-G) Relative peripheral blood reconstitution (F) and contribution to B cells (B220+), myeloid cells (Mac1+), and T cells (CD3+) (G) 20 weeks after transplantation of recipient B6.SJL (CD45.1) mice transfused with whole BM cells from Aldh3a2-WT or KO mice (CD45.2+) competed with equal numbers of WT CD45.1 whole BM cells (n = 10 recipients per group). Data are representative of ≥2 independent experiments; n = 3 mice per genotype per experiment. Data are represented as mean ± standard deviation. P > .05 was considered nonsignificant (ns). ***P < .001.](https://ash.silverchair-cdn.com/ash/content_public/journal/blood/136/11/10.1182_blood.2019001808/3/m_bloodbld2019001808f3.png?Expires=1763525209&Signature=ZzJ65j9lrFmDH5ku-RbnEH0jKrt52-n-gecbWDD7t1qWC-4gBC1nfPBna~6kxXBsN9~WRvuV1gQRCE4vv~esYFEJ9MNagLCxdR1g9kwSHZPVXaLWSI9XB-rE3HvIF0DK7L0ywyDRmH17wUve5oYStcHInMUgZSAlaz4muXLlnp1B0h-nyKI~mxZDro5xXLRJuXEJ6Qfx-0WVLjtaI7vcxigZklzOiMLNiRK5E-vaqjuxjm8egM03djQB9Ru1BvMqQhKQmKLJdQ~Y4abD-A~gwZPQK2~~NQ~eiG1UpesRA3y88PeMpvWA2KKLxDpeb12A8KGyeAlXIEyAxuXclz2yuQ__&Key-Pair-Id=APKAIE5G5CRDK6RD3PGA)
Aldh3a2 is dispensable for normal hematopoiesis. (A) Aldh3a2 knockdown with Aldh3a2-sh-1 shows no difference in the number of N-GMPs in methylcellulose compared with N-GMPs infected with control shRNA (n = 3 wells per group). (B) Aldh3a2−/− mice (KO) show one half of total aldehyde dehydrogenase enzyme activity in whole BM compared with Aldh3a2+/+ mice (WT). (C-E) BM analysis showing frequency of Lin−cKit+Sca1+CD48−CD150+ hematopoietic stem cells (HSCs) (C), committed myeloid progenitors (common myeloid progenitors [CMPs], granulocyte-monocyte progenitors [GMPs], and megakaryocyte-erythrocyte progenitors [MEPs]) (D), and B cells (B220+) and myeloid cells (Mac1+) (E) in Aldh3a2-WT and Aldh3a2-KO mice. (F-G) Relative peripheral blood reconstitution (F) and contribution to B cells (B220+), myeloid cells (Mac1+), and T cells (CD3+) (G) 20 weeks after transplantation of recipient B6.SJL (CD45.1) mice transfused with whole BM cells from Aldh3a2-WT or KO mice (CD45.2+) competed with equal numbers of WT CD45.1 whole BM cells (n = 10 recipients per group). Data are representative of ≥2 independent experiments; n = 3 mice per genotype per experiment. Data are represented as mean ± standard deviation. P > .05 was considered nonsignificant (ns). ***P < .001.
Aldh3a2 is dispensable for normal hematopoiesis. (A) Aldh3a2 knockdown with Aldh3a2-sh-1 shows no difference in the number of N-GMPs in methylcellulose compared with N-GMPs infected with control shRNA (n = 3 wells per group). (B) Aldh3a2−/− mice (KO) show one half of total aldehyde dehydrogenase enzyme activity in whole BM compared with Aldh3a2+/+ mice (WT). (C-E) BM analysis showing frequency of Lin−cKit+Sca1+CD48−CD150+ hematopoietic stem cells (HSCs) (C), committed myeloid progenitors (common myeloid progenitors [CMPs], granulocyte-monocyte progenitors [GMPs], and megakaryocyte-erythrocyte progenitors [MEPs]) (D), and B cells (B220+) and myeloid cells (Mac1+) (E) in Aldh3a2-WT and Aldh3a2-KO mice. (F-G) Relative peripheral blood reconstitution (F) and contribution to B cells (B220+), myeloid cells (Mac1+), and T cells (CD3+) (G) 20 weeks after transplantation of recipient B6.SJL (CD45.1) mice transfused with whole BM cells from Aldh3a2-WT or KO mice (CD45.2+) competed with equal numbers of WT CD45.1 whole BM cells (n = 10 recipients per group). Data are representative of ≥2 independent experiments; n = 3 mice per genotype per experiment. Data are represented as mean ± standard deviation. P > .05 was considered nonsignificant (ns). ***P < .001.
In transplantation assays using cells from the Aldh3a2 conditional mutant and control mice competing with equal numbers of congenic CD45.1 cells, we observed a long-term increase in the contribution to normal hematopoiesis from mutant cells compared with control cells (supplemental Figure 3A). Contribution of mutant and control cells to differentiated lineages was equivalent (supplemental Figure 3B).
Taken together, these results indicate that Aldh3a2 is dispensible for normal hematopoiesis.
Human leukemia is sensitive to ALDH3A2 depletion
We sought to determine whether ALDH3A2 is essential in human AML and first investigated the expression of ALDH3A2 in public gene expression databases. Patients with karyotypically normal AML show a range of ALDH3A2 expression, as measured by transcript levels in AML samples obtained at diagnosis (Figure 4A).32 High levels of ALDH3A2 expression in this data set was associated with a reduced overall survival compared with patients with lower ALDH3A2 expression (Figure 4B).32
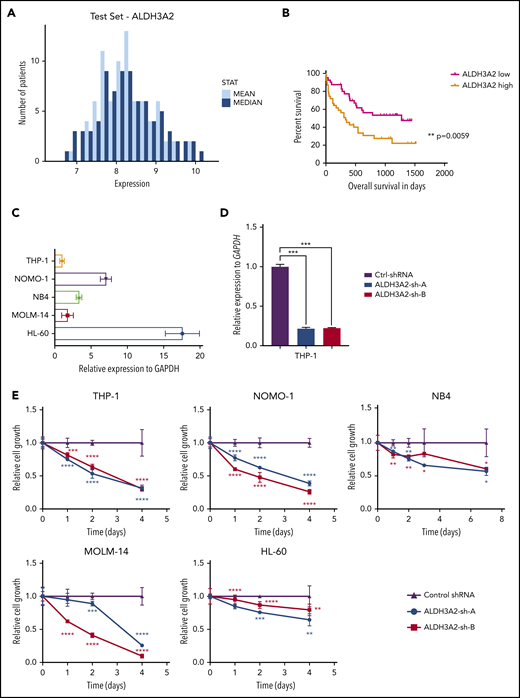
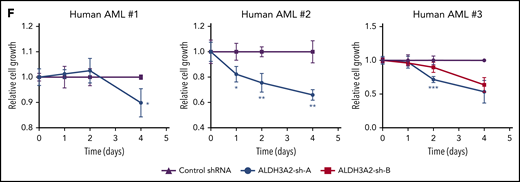
Human leukemia is sensitive to ALDH3A2 depletion. (A) ALDH3A2 expression in pretreatment AML patients with normal karyotype from the Meltezer database.32 (B) Overall survival in patients with high vs low ALDH3A2 expression. Data were divided into ALDH3A2-high and ALDH3A2-low patients around the median of the distribution of ALDH3A2 expression. (C) Relative ALDH3A2 expression in human AML cell lines. (D) Effective knockdown of ALDH3A2 expression in THP1 cells with 2 independent shRNAs (ALDH3A2-sh-A and ALDH3A2-sh-B) compared with control shRNA. (E) ALDH3A2 knockdown by 2 independent shRNAs decreased cell growth in 5 different AML cell lines as compared with cells infected with control shRNA. (F) ALDH3A2 knockdown by 1 or 2 independent shRNAs (depending on number of patient cells available) decreased the growth of 3 different primary AML samples as compared with cells infected with control shRNA. Data are representative of ≥2 independent experiments; n = 3 replicates per cell line per experiment. Data are represented as mean ± standard deviation. P > .05 was considered nonsignificant. *P < .05, **P < .01, ***P < .001, ****P < .0001. GAPDH, glyceraldehyde-3-phosphate dehydrogenase.
Human leukemia is sensitive to ALDH3A2 depletion. (A) ALDH3A2 expression in pretreatment AML patients with normal karyotype from the Meltezer database.32 (B) Overall survival in patients with high vs low ALDH3A2 expression. Data were divided into ALDH3A2-high and ALDH3A2-low patients around the median of the distribution of ALDH3A2 expression. (C) Relative ALDH3A2 expression in human AML cell lines. (D) Effective knockdown of ALDH3A2 expression in THP1 cells with 2 independent shRNAs (ALDH3A2-sh-A and ALDH3A2-sh-B) compared with control shRNA. (E) ALDH3A2 knockdown by 2 independent shRNAs decreased cell growth in 5 different AML cell lines as compared with cells infected with control shRNA. (F) ALDH3A2 knockdown by 1 or 2 independent shRNAs (depending on number of patient cells available) decreased the growth of 3 different primary AML samples as compared with cells infected with control shRNA. Data are representative of ≥2 independent experiments; n = 3 replicates per cell line per experiment. Data are represented as mean ± standard deviation. P > .05 was considered nonsignificant. *P < .05, **P < .01, ***P < .001, ****P < .0001. GAPDH, glyceraldehyde-3-phosphate dehydrogenase.
To evaluate the importance of ALDH3A2 in human leukemia, we used 5 different AML cell lines with a range of ALDH3A2 expression (Figure 4C): 3 cell lines with MLL-AF9 translocations (MOLM-14, THP1, and NOMO-1), and 2 acute promyelocytic cell lines (HL60 and NB4) that do not carry MLL translocations. Two independent shRNAs (ALDH3A2-sh-A and ALDH3A2-sh-B) that efficiently silence ALDH3A2 (Figure 4D; supplemental Figure 4A-D) were used. All 5 cell lines were sensitive to ALDH3A2 knockdown (Figure 4E) regardless of the presence of an MLL-AF9 fusion oncoprotein. In addition, primary human AML samples were also sensitive to ALDH3A2 knockdown (Figure 4F).
Taken together, these results demonstrate that human AML is sensitive to ALDH3A2 deletion and that targeting aldehyde metabolism represents a therapeutic opportunity.
ALDH3A2 depletion alters the redox state of cells
Aldehyde dehydrogenases metabolize aldehydes to mitigate oxidative stress and prevent lipid peroxidation in the cell.33 Because fatty aldehydes are highly unstable, we measured the levels of fatty alcohols, which are precursors of fatty aldehydes and have been shown to accumulate in Aldh3a2-deficient cells in Sjögren-Larsson syndrome.34 Indeed, endogenous levels of 16- and 18-carbon fatty alcohols together with total fatty alcohol levels were greatly increased in Aldh3a2-mutant leukemia compared with control leukemia cells (Figure 5A-B). Next, we examined oxidative damage in AML cells lacking Aldh3a2. Measurement of cellular ROS and lipid peroxidation by flow cytometry showed increased levels in mutant vs control Aldh3a2 leukemia cells (Figure 5C-D). To further assess deficits in detoxification capacity, we next studied the effects of 4-HNE, a commonly investigated fatty aldehyde and a byproduct of arachidonic acid catabolism, on cellular ROS, lipid peroxidation, and proliferation in Aldh3a2-deficient LSPCs. Exposure to 4-HNE for 24 hours increased cellular ROS in mutant but not control cells (Figure 5E). Vitamin E, a quencher of lipid-phase ROS, decreased total ROS in control cells but was unable to do so in mutant cells (Figure 5E). Likewise, exposure to 4-HNE increased levels of lipid peroxidation in mutant but not control cells (Figure 5F). In contrast to its effects on ROS, vitamin E treatment significantly decreased lipid peroxidation in both populations, likely quenching lipid peroxides present at baseline in control cells (Figure 5F). Finally, although both control and mutant cells showed reduced cell growth in response to 4-HNE exposure, sensitivity to 4-HNE was significantly greater in mutant vs control cells (Figure 5G). Lastly, we turned our attention to normal granulocyte monocyte precursors (ie, N-GMPs). Treatment with 4-HNE of both control and mutant N-GMPs resulted in similar decreases in cell proliferation, with the mutant being no more sensitive than the control cells (Figure 5H).

Aldh3a2 depletion alters the redox state of cells. (A-B) Levels of endogenous 16- and 18-carbon alcohols (A) as well as total alcohol levels (B) in Aldh3a2-control and -mutant leukemic cells. (C-D) Cellular ROS (C) and lipid peroxidation (D) levels in Aldh3a2-control and -mutant LSPCs (Linlowc-Kit+). (E-F) Cellular ROS (E) and lipid peroxidation levels (F) in Aldh3a2-control and -mutant LSPCs upon 4-HNE and 4-HNE plus vitamin E treatment. (G) Growth kinetics of Aldh3a2-control and -mutant LSPCs treated with 4-HNE. (H) Growth kinetics of Aldh3a2-control and -mutant N-GMPs treated with 4-HNE. (I-K) Aldh3a2-mutant leukemia cells show evidence of oxidative damage to DNA and protein as shown by increased levels of γ-H2AX (double-stranded DNA breaks) (I), 8-OHDG (oxidative DNA damage) (J), and protein carbonylation (oxidative protein damage) (K) in mutant vs control cells. Data are representative of ≥2 independent experiments; n = 3 replicates per cell line per experiment (except for measurement of alcohols, where 2 replicates were used). Data are represented as mean ± standard deviation. P > .05 was considered nonsignificant (ns). *P < .05, **P < .01, ***P < .001. DMSO, dimethyl sulfoxide; FITC, fluorescein isothiocyanate; MFI, mean fluorescence intensity.
Aldh3a2 depletion alters the redox state of cells. (A-B) Levels of endogenous 16- and 18-carbon alcohols (A) as well as total alcohol levels (B) in Aldh3a2-control and -mutant leukemic cells. (C-D) Cellular ROS (C) and lipid peroxidation (D) levels in Aldh3a2-control and -mutant LSPCs (Linlowc-Kit+). (E-F) Cellular ROS (E) and lipid peroxidation levels (F) in Aldh3a2-control and -mutant LSPCs upon 4-HNE and 4-HNE plus vitamin E treatment. (G) Growth kinetics of Aldh3a2-control and -mutant LSPCs treated with 4-HNE. (H) Growth kinetics of Aldh3a2-control and -mutant N-GMPs treated with 4-HNE. (I-K) Aldh3a2-mutant leukemia cells show evidence of oxidative damage to DNA and protein as shown by increased levels of γ-H2AX (double-stranded DNA breaks) (I), 8-OHDG (oxidative DNA damage) (J), and protein carbonylation (oxidative protein damage) (K) in mutant vs control cells. Data are representative of ≥2 independent experiments; n = 3 replicates per cell line per experiment (except for measurement of alcohols, where 2 replicates were used). Data are represented as mean ± standard deviation. P > .05 was considered nonsignificant (ns). *P < .05, **P < .01, ***P < .001. DMSO, dimethyl sulfoxide; FITC, fluorescein isothiocyanate; MFI, mean fluorescence intensity.
Leukemic cells with knockdown of ALDH3A2 failed to increase common cellular antioxidant defenses, because we did not detect any differences in the reduced/oxidized glutathione ratio or reduced NADP (NADPH)/NADP+ ratio (supplemental Figure 5A-B). Rescue of ALDH3A2-depleted THP1 cells with NAC resulted in partial rescue in the population of cells with moderate (sh-A) but not severe (sh-B) ALDH3A2 depletion (supplemental Figure 5C). NAC did not rescue lipid ROS species. Leukemic cells with ALDH3A2 depletion did not increase activity of the oxidative pentose-phosphate pathway (oxPPP), 1 of the main metabolic pathways generating NADPH. In cells cultured in [1,2-13C2]-glucose, the oxPPP generates single 13C-labeled (M1) intermediates, glycolysis generates double 13C-labeled (M2) intermediates, and the M1/M2 ratio of metabolites such as pyruvate or lactate reflects the oxPPP flux relative to glycolysis (supplemental Figure 5D). However, the M1/M2 ratio of lactate was unchanged in THP1 cells after ALDH3A2 knockdown, suggesting a limited NADPH production response to oxidative stress (supplemental Figure 5E). Cells lacking ALDH3A2 thus fail to increase antioxidant defense mechanisms to mitigate the increased oxidative stress and prevent lipid peroxidation.
Aldehydes and lipid peroxides are highly reactive and lead to oxidation of other molecules such as DNA and proteins. Oxidative DNA damage, as measured by γ-H2AX and 8-OHDG levels, was increased in Aldh3a2-mutant compared with control leukemic cells (Figure 5I-J). Levels of protein carbonylation, representing another consequence of oxidative stress, were also increased in mutant leukemic cells (Figure 5K).
Taken together, these data show that deficiency of Aldh3a2 in leukemia progenitor cell populations, but not normal hematopoietic progenitor cells, leads to increased oxidative damage.
Loss of Aldh3a2 affects lipid metabolism
By detoxifying fatty aldehydes, Aldh3a2 generates fatty acids that can be used for biosynthetic purposes (supplemental Figure 6A). Fatty acid species with a length of 18 carbons were strongly decreased in L-GMPs lacking Aldh3a2 (Figure 6A). Supplying leukemic cells with exogenous oleic acid (18:1) rescued the effects of Aldh3a2 depletion in leukemic cells from conditional mutant mice (Figure 6B). To further investigate the consequences of this depletion of 18-carbon fatty acids in Aldh3a2 KO cells, we performed lipidomic analysis on leukemic cells derived from conditional KO mice (Figure 6C-G). Several, but not all, phospholipid species containing 18-carbon fatty acid tails were decreased in mutant cells across lipid classes, including phosphatidylcholines, phosphatidylethanolamines, cardiolipins, and phosphatidic acids (Figure 6C-G). Interestingly, we also observed changes in several lysophospholipid species, with an increase in lysophospholipids with a saturated fatty acid or monounsaturated fatty acid (MUFA) as the remaining tail, but a decrease in lysophospholipids with a long-chain polyunsaturated fatty acid tail (Figure 6G).

Aldh3a2 depletion alters lipid metabolism in AML cells. (A) Fatty acid methyl ester analysis in L-GMPs and Aldh3a2-depleted (Aldh3a2-sh-1) L-GMPs. (B) Frequency of live Aldh3a2-control and -mutant LSPCs 3 days after culture and treatment with vehicle (EtOH) or varying concentrations of oleic acid. (C-G) Lipidomic analysis of Aldh3a2-control and -mutant leukemia cells, showing ratios (mutant/control) of major species of lipids. Linoleic acid (18:2)–containing phosphatidylcholine, phosphatidylethanolamine, cardiolipin, and phosphatidic acid species were reduced, whereas several lysophospholipids (lacking 1 fatty acid side chain after oxidation), mainly those in the lysophosphatidic acid and lysophosphatidylcholine classes, were increased. ***P < .001. nd, not determined.
Aldh3a2 depletion alters lipid metabolism in AML cells. (A) Fatty acid methyl ester analysis in L-GMPs and Aldh3a2-depleted (Aldh3a2-sh-1) L-GMPs. (B) Frequency of live Aldh3a2-control and -mutant LSPCs 3 days after culture and treatment with vehicle (EtOH) or varying concentrations of oleic acid. (C-G) Lipidomic analysis of Aldh3a2-control and -mutant leukemia cells, showing ratios (mutant/control) of major species of lipids. Linoleic acid (18:2)–containing phosphatidylcholine, phosphatidylethanolamine, cardiolipin, and phosphatidic acid species were reduced, whereas several lysophospholipids (lacking 1 fatty acid side chain after oxidation), mainly those in the lysophosphatidic acid and lysophosphatidylcholine classes, were increased. ***P < .001. nd, not determined.
These results show that besides increasing oxidative damage, loss of Aldh3a2 also alters biosynthetic pathways and cellular lipid composition in leukemic cells.
Aldh3a2 depletion causes ferroptosis and is synergistic with GPX4 inhibition
We next investigated the specific mechanism for the reduced number of leukemic cells upon Aldh3a2 deletion. Cell-cycle profiles were similar in leukemic cells from both control and mutant Aldh3a2 mice (Figure 7A), indicating that the change is likely due to cell death rather than reduced proliferation. Aldh3a2-mutant leukemic cells, however, did not show activation of caspase-3 (Figure 7B) or cleavage of the caspase-3 target PARP (Figure 7C), both of which characterize the normal apoptotic cascade. Furthermore, treatment of primary L-GMP–enriched (Lin−, cKit+) cells with the pancaspase inhibitor ZVAD did not rescue the cell death observed in Aldh3a2-deficient cells (Figure 7D; supplemental Figure 7A), arguing against an apoptotic cell death program in primary leukemic cells.
![Aldh3a2 depletion causes death by ferroptosis. (A) Assessment of cell cycle in Aldh3a2-control and -mutant leukemia cells reveals no differences. (B-C) Caspase 3 activation (B) and PARP cleaveage (C) in Aldh3a2-mutant vs -control LSPCs. (D-F) Frequency of live Aldh3a2-control and -mutant LSPCs 3 days after culture and treatment with vehicle (dimethyl sulfoxide [DMSO]) or the pancaspase inhibitor ZVAD (D), the ferroptosis inhibitor ferrostatin (E), or the GPX4 inhibitor RSL3 (F). (G) Sublethally irradiated C57BL/6J mice were injected with Aldh3a2-control and -mutant leukemia cells from primary leukemic mice infected with lentivirus expressing Gpx4 or scrambled shRNA. Forty-eight hours after injection, mice were injected with 3 doses of polyinosinic-polycytidylic acid [Poly(I):Poly(C)] on alternate days, and leukemia development was monitored. Kaplan-Meier survival curve of animals that developed leukemia is shown. (H) Sublethally irradiated C57BL/6J mice were injected with Aldh3a2-control and -mutant leukemia cells from primary leukemic mice. Forty-eight hours after injection, mice were treated with 3 doses of Poly(I):Poly(C) on alternate days and with cytarabine and doxorubicin in a 5 + 3 regimen. Leukemia development was monitored. Kaplan-Meier survival curve of animals that developed leukemia is shown. Data are representative of ≥2 independent experiments; n = 3 replicates per cell line per experiment. Data are represented as mean ± standard deviation. P > .05 was considered nonsignificant (ns). **P < .01, ***P < .001.](https://ash.silverchair-cdn.com/ash/content_public/journal/blood/136/11/10.1182_blood.2019001808/3/m_bloodbld2019001808f7.png?Expires=1763525209&Signature=LfkFsHgIJqTh~8Fga--8AcgRJAY6Hbz4GEdVTMP~mvuLfAShPcm-giRXfVNBOvX3E-2xonIi0GKFAi~7t5dH1~Hq5V6u9XF-b3LulNA6a88aOgjOSFzzu1-TKxxpqmXL5aXwvViWawzaoh26pNUPSMx7FOiYRD27b6U~XKjk9-QEoiPqNGNVEaDEsvmvWzLI8o0bQRS1iZU2DlWmtPEqrdyFu0gbeTl36gQqqz1GQQo7zEDX6lzHH-wDSi-hRQzuUaeUaVeNQKmOkEG6OgzYboF-E1QKfcu6MifXEv~hMRFNJEBdnNKPRDRLM1VkbsUPVrPMMLQnilVWN2E2bxDv3A__&Key-Pair-Id=APKAIE5G5CRDK6RD3PGA)
Aldh3a2 depletion causes death by ferroptosis. (A) Assessment of cell cycle in Aldh3a2-control and -mutant leukemia cells reveals no differences. (B-C) Caspase 3 activation (B) and PARP cleaveage (C) in Aldh3a2-mutant vs -control LSPCs. (D-F) Frequency of live Aldh3a2-control and -mutant LSPCs 3 days after culture and treatment with vehicle (dimethyl sulfoxide [DMSO]) or the pancaspase inhibitor ZVAD (D), the ferroptosis inhibitor ferrostatin (E), or the GPX4 inhibitor RSL3 (F). (G) Sublethally irradiated C57BL/6J mice were injected with Aldh3a2-control and -mutant leukemia cells from primary leukemic mice infected with lentivirus expressing Gpx4 or scrambled shRNA. Forty-eight hours after injection, mice were injected with 3 doses of polyinosinic-polycytidylic acid [Poly(I):Poly(C)] on alternate days, and leukemia development was monitored. Kaplan-Meier survival curve of animals that developed leukemia is shown. (H) Sublethally irradiated C57BL/6J mice were injected with Aldh3a2-control and -mutant leukemia cells from primary leukemic mice. Forty-eight hours after injection, mice were treated with 3 doses of Poly(I):Poly(C) on alternate days and with cytarabine and doxorubicin in a 5 + 3 regimen. Leukemia development was monitored. Kaplan-Meier survival curve of animals that developed leukemia is shown. Data are representative of ≥2 independent experiments; n = 3 replicates per cell line per experiment. Data are represented as mean ± standard deviation. P > .05 was considered nonsignificant (ns). **P < .01, ***P < .001.
Aldh3a2 depletion causes death by ferroptosis. (A) Assessment of cell cycle in Aldh3a2-control and -mutant leukemia cells reveals no differences. (B-C) Caspase 3 activation (B) and PARP cleaveage (C) in Aldh3a2-mutant vs -control LSPCs. (D-F) Frequency of live Aldh3a2-control and -mutant LSPCs 3 days after culture and treatment with vehicle (dimethyl sulfoxide [DMSO]) or the pancaspase inhibitor ZVAD (D), the ferroptosis inhibitor ferrostatin (E), or the GPX4 inhibitor RSL3 (F). (G) Sublethally irradiated C57BL/6J mice were injected with Aldh3a2-control and -mutant leukemia cells from primary leukemic mice infected with lentivirus expressing Gpx4 or scrambled shRNA. Forty-eight hours after injection, mice were injected with 3 doses of polyinosinic-polycytidylic acid [Poly(I):Poly(C)] on alternate days, and leukemia development was monitored. Kaplan-Meier survival curve of animals that developed leukemia is shown. (H) Sublethally irradiated C57BL/6J mice were injected with Aldh3a2-control and -mutant leukemia cells from primary leukemic mice. Forty-eight hours after injection, mice were treated with 3 doses of Poly(I):Poly(C) on alternate days and with cytarabine and doxorubicin in a 5 + 3 regimen. Leukemia development was monitored. Kaplan-Meier survival curve of animals that developed leukemia is shown. Data are representative of ≥2 independent experiments; n = 3 replicates per cell line per experiment. Data are represented as mean ± standard deviation. P > .05 was considered nonsignificant (ns). **P < .01, ***P < .001.
Lipid peroxidation has been linked to the induction of ferroptosis, a nonapoptotic, iron-dependent form of cell death. An increase in lysophospholipids, especially those lacking polyunsaturated fatty acid tails as we observed (Figure 6G), is a hallmark of ferroptosis.35 In addition, the ability to rescue cell death by providing exogenous MUFAs, as we found (Figure 6B), is another feature of ferroptotic cell death.36 To further confirm these findings, we treated cells with ferrostatin, an inhibitor of iron-dependent oxidative damage. Ferrostatin completely prevented the cell death observed in Aldh3a2-mutant leukemia cells (Figure 7E; supplemental Figure 7B).
To further assess the relationship to ferroptosis, we genetically and pharmacologically targeted a key enzyme protecting cells from ferroptotic cell death: GPX4.37 Aldh3a2-deficient Lin−cKit+ AML cells showed increased sensitivity to the GPX4 inhibitor RSL3 (Figure 7F; supplemental Figure 7C). Moreover, Gpx4 knockdown significantly prolonged survival in animals receiving Aldh3a2-mutant cells but not control cells (Figure 7G), demonstrating a superadditive effect of Aldh3a2 deficiency and ferroptosis activation by GPX4 inhibition. Recent findings have shown that activation of MUFAs by Acsl3 can also promote resistance to ferroptosis.36 Acsl3 expression was not different between Aldh3a2-control and -mutant leukemic cells (supplemental Figure 7D). Acsl3 knockdown modestly prolonged survival in animals receiving Aldh3a2-mutant cells (supplemental Figure 7E), but this effect was much less pronounced than that of GPX4 depletion.
Thus, our results show that loss of Aldh3a2 induces ferroptotic cell death in leukemic cells and is synthetically lethal with GPX4 inhibtion.
Therapeutic implications of Aldh3a2 depletion
Lastly, to test the therapeutic potential of Aldh3a2 depletion in combination with conventional chemotherapy, Aldh3a2-Ctrl and Aldh3a2-mut leukemic mice were administered cytarabine and doxorubicin.20 Mice receiving either chemotherapy or Aldh3a2 depletion survived longer than those receiving placebo. This prolongation was much more pronounced when chemotherapy and Aldh3a2 depletion were combined. Therefore, combining Aldh3a2 inhibition and standard cytotoxic chemotherapy may have therapeutic implications (Figure 7H).
Discussion
To identify pathways critical for leukemia maintenance, we designed an shRNA screen that focused on regulators of metabolism. Aldh3a2, an enzyme responsible for detoxification of fatty aldehydes and generation of 16- and 18-carbon fatty acids, was identified as a specific metabolic vulnerability of LSPCs.
Fatty aldehydes accumulate in cells as a result of lipid catabolism, lipid peroxidation, and dietary sources.38 Aldehydes are highly reactive compounds that can damage DNA, proteins, and lipids. We show that Aldh3a2 is critical in protecting LSPCs from ferroptotic cell death. Increasing oxidative stress by inhibiting the glutathione peroxidase GPX4 further augments the damaging, death-inducing effects of Aldh3a2 depletion. Although both Aldh3a2 and GPX4 depletion can be rescued by ferrostatin, they have distinctive functions acting respectively on aldehydes and peroxides. Because aldehydes and peroxides can contribute to the formation of the other, it is reasonable to view Aldh3a2 and GPX4 as serving in parallel, detoxifying oxidative or peroxidative products that result from increased or disregulated metabolic activity in malignancy.1,2 In AML, inhibition of GPX4 alone had limited ability to enhance cell death. However, when inhibiting both Aldh3a2 and GPX4, a synthesis of effect is evident, with additive increased cell killing.
Also distinguishing Aldh3a2 from GPX4 is its participation in fatty acid synthesis. By contributing to the de novo generation of long-chain fatty acids, Aldh3a2 can contribute to both the replenishment of damaged fatty acids and limitation of the damage of existing fatty acids through its enzymatic activity. In contrast, GPX4 acts only on peroxide-damaged lipids. These distinctions may contribute to the greater potency of Aldh3a2 compared with GPX4 inhibition in AML.
Therapeutic index is a critical feature in considering a target for drug development, and we found that normal murine stem and progenitor cells were tolerant to the loss of Aldh3a2. The enzyme is expressed in N-GMPs, although at a lower level than L-GMPs,25 potentially accounting for leukemia’s greater dependency on it. A greater dependency is also anticipated in AML, given the well-established upregulation of oxidative metabolism in AML and LSPCs.8,12,13 Targeting Aldh3a2 may provide a distinctive means of selectively killing malignant over normal hematopoietic cells, particularly primitive L-GMPs, and merits consideration in therapeutic development.5,39
Depletion of Aldh3a2 has been thought to result in cell death by causing an increase in toxic 16- and 18-carbon aldehydes and alcohols and incomplete lipid metabolism in the inherited pediatric Sjögren-Larsson syndrome.34 Sjögren-Larsson syndrome is an autosomal recessive disease characterized by ichthyosis, neurodevelopmental delay, and photophobia. Genetic carriers are not affected, and the disease in homozygotes generally does not progress beyond childhood. These features suggest that targeting Aldh3a2 may be tolerated in extrahematopoietic tissues, at least for intervals that would be anticipated in antileukemic therapy.
In summary, Aldh3a2 depletion results in an iron-dependent oxidative cell death of leukemia cells while sparing normal hematopoiesis. Combination of Aldh3a2 inhibition with ferroptosis inducers or with standard AML induction chemotherapy deserves further consideration as a cancer therapy.
For original data, please contact the corresponding author.
The online version of this article contains a data supplement.
The publication costs of this article were defrayed in part by page charge payment. Therefore, and solely to indicate this fact, this article is hereby marked “advertisement” in accordance with 18 USC section 1734.
Acknowledgments
This work was supported by grants from the following funders: Leukemia and Lymphoma Society (Research Fellow Career Development Award), Alex’s Lemonade Stand Foundation (Young Investigator Award), National Institutes of Health, National Heart, Lung, and Blood Institute (HL097794), National Institutes of Health, National Cancer Institute (CA163191), Ludwig Cancer Center, and Fundación Científica Asociación Española Contra el Cáncer (AIO16163636SAEZ).
Authorship
Contribution: R.Z.Y., B.S., and A.S. designed experiments, performed research, analyzed data, and wrote the manuscript; N.v.G., V.W.C.Y., N.B., E.W.S., S.A., S.C., C.H., V.V., D.S., J.C., D.B.S., M.A.K., S.D., J.N.H., M.C., S.M., D.J.L., F.M., J.D., L.B., and D.L. designed and performed experiments; S.S., G.S., and W.B.R. designed experiments and provided supervision; and D.T.S. designed experiments, analyzed data, and wrote the manuscript.
Conflict-of-interest disclosure: D.B.S. holds a patent on the use of DHODH inhibitors in the treatment of hematologic malignancies and is a cofounder of and owns equity in Clear Creek Bio. D.J.L. is an employee of Pfizer, Inc. S.M. is a founder of and scientific advisor for VOR Biopharma, founder and board member of Myeloid, and board member of SEngine. S.S. serves on the board of directors of the Genomics Institute of the Novartis Research Foundation; is a shareholder in and serves on the board of directors of Jnana Therapeutics; is a shareholder in Forma Therapeutics; is a shareholder in and advises Decibel Therapeutics and Eikonizo Therapeutics; serves on the scientific advisory boards of Eisai Co., Ltd, Ono Pharma Foundation, and F-Prime Capital Partners; and is a Novartis Faculty Scholar. D.T.S. is a director of and shareholder in Agios Pharmaceuticals; consultant for FOG Pharma; director and consultant for and shareholder in Clear Creek Bio, Editas Medicine, and Life Vault Bio; and cofounder of, director of, consultant for, and shareholder in Magenta Therapeutics and Fate Therapeutics. The remaining authors declare no competing financial interests.
The current affiliation for B.S. is Hematology-Oncology Department, Center for Applied Medical Research, Pamplona, Spain.
The current affiliation for M.A.K. is Manufacturing Sciences, AbbVie Bioresearch Center, Worcester, MA.
The current affiliation for S.M. is Department of Medicine, Vagelos College of Physicians and Surgeons, Columbia University, New York, NY.
The current affiliation for D.J.L. is Pfizer Worldwide Research Development and Medical Information, Internal Medicine, Cambridge, MA.
Correspondence: David T. Scadden, 185 Cambridge St, Boston, MA 02114; e-mail: david_scadden@harvard.edu.

This feature is available to Subscribers Only
Sign In or Create an Account Close Modal