

Key Points
Inhibiting MTCH2 increased levels of pyruvate and PDH in nucleus leading to differentiation and loss of engraftment potential in AML.
Defined a new mechanism by which mitochondrial pathways control epigenetics and differentiation in AML.

Abstract
Through a clustered regularly insterspaced short palindromic repeats (CRISPR) screen to identify mitochondrial genes necessary for the growth of acute myeloid leukemia (AML) cells, we identified the mitochondrial outer membrane protein mitochondrial carrier homolog 2 (MTCH2). In AML, knockdown of MTCH2 decreased growth, reduced engraftment potential of stem cells, and induced differentiation. Inhibiting MTCH2 in AML cells increased nuclear pyruvate and pyruvate dehydrogenase (PDH), which induced histone acetylation and subsequently promoted the differentiation of AML cells. Thus, we have defined a new mechanism by which mitochondria and metabolism regulate AML stem cells and gene expression.
Introduction
Most therapies currently used or under development for acute myeloid leukemia (AML) are cytotoxics that directly kill leukemic cells. An alternate, but less explored, strategy is to promote differentiation of AML into more mature and functional cells. Although used less frequently than cytotoxic drugs, therapies that promote differentiation are well-recognized treatments in AML. For example, all-trans retinoic acid and arsenic induce differentiation in acute promyelocytic leukemia and produce long-term remission in 98% of patients.1 In addition, inhibitors of IDH1/2 promote differentiation of leukemic cells carrying mutations in these metabolic enzymes.2 However, IDH1/2 mutations are found in a small subset of patients with AML. Therefore, there is a need to discover new mechanisms that control stem cell properties and differentiation in other groups of patients with AML, and strategies to promote differentiation.
We discovered that mitochondrial carrier homolog 2 (MTCH2) is necessary for AML stem cells. MTCH2 is a 33-kDa protein localized to mitochondrial outer membrane.3,4 The Bcl-2 family member, BID, is the only validated binding partner of MTCH2.3 Upon activation of the death receptor pathway, BID is cleaved into a truncated form, tBID. MTCH2 binds tBID and localizes it to mitochondria. When bound to mitochondria, BID controls mitochondrial membrane potential, anion channels, and apoptosis by activating Bax.3-5 MTCH2 affects metabolism through undefined mechanisms, suggesting it has additional functions. For example, single nucleotide polymorphisms in MTCH2 correlate with increased BMI6,7 and diabetes,8-11 and its loss protects mice from diet-induced obesity.12 Moreover, MTCH2 knockout increased oxidative phosphorylation in muscle and hematopoietic cells.12,13 A recent study has reported MTCH2 as a regulator of mitochondrial fusion and as essential for naive to primed transition of murine embryonic stem cells by affecting mitochondrial metabolism.14 In this study, we evaluated the effects of inhibiting MTCH2 in AML.
Methods
Cell lines
OCI-AML2, HL60, K562, U937, and NB4 were cultured in Iscove modified Dulbecco medium and RPMI medium with 10% fetal calf serum, 100 U/mL streptomycin, and 100 µg/mL penicillin, respectively. TLS-ERG–immortalized cord blood (TEX) cells were cultured in Iscove modified Dulbecco medium with 20% fetal calf serum, 100 U/mL streptomycin, 100 µg/mL penicillin, stem cell factor (20 ng/mL), interleukin 3 (IL-3; 2 ng/mL), and L-glutamine (2 mM).15 8227 cells were provided by John E. Dick (Princess Margaret Cancer Centre) and were cultured in X-VIVO-10 with 20% bovine serum albumin, insulin, and transferrin; Flt3-L (50 ng/mL); IL-6 (10 ng/mL); stem cell factor (50 ng/mL); thrombopoietin (25 ng/mL); IL-3 (10 ng/mL); and granulocyte colony-stimulating factor (10 ng/mL). Cells were maintained in a 37°C humidified incubator with 5% CO2.
OCI-AML2-Cas9 cell generation
OCI-AML2 cells were transduced with Cas9-expressing lentiviral vector, Lenti‐Cas9‐2A‐Blast (Addgene plasmid #73310; Watertown, MA),16 and selected with blasticidin (10 μg/mL) for 6 days. After selection, the Cas9-expressing clonal population was subject to 2 rounds of single-cell cloning. From the second round, a designated clone-7.2 was obtained, characterized by immunoblotting and used for the screening assay.
Clustered regularly insterspaced short palindromic repeats (CRISPR) screen
OCI-AML2-Cas9 cells were transduced with a pooled lentiviral library consisting of 91 320 gRNAs targeting 17 237 nuclear-encoded genes, as previously described.16 The day after infection, cells were treated with puromycin (2 μg/mL) to select the transduced cells. Resistant clones were passaged at a regular interval (3-4 days). The genomic DNA was extracted from the cell pellets obtained on day 0 and day 14 after selection and sequenced on Illumina Nextseq2500. gRNA depletion was characterized by MaGECK, as described in the supplemental Methods, available on the Blood Web site.17
CRISPR knockout
The sequences for MTCH2-gRNA1:5′-AGGATGTCACCTAGAAGGCG-3′; MTCH2-gRNA2-2:5′-CTCTTACCTCCTTGATAACG-3′, Control-gRNA, LacZ:5′-CCCGAATCTCTATCGTGCGG-3′ were cloned into pLCKO lentiviral vector, as described previously.16 Lentiviral infections in OCI-AML2-Cas9 cells were performed as previously described.18 Equal numbers of cells in each gRNA condition were plated for the growth assays and counted with trypan blue exclusion staining.
Short hairpin RNA knockdown
Lentiviral infections with control and MTCH2 short hairpin RNA (shRNA) constructs were performed as previously described.18 Equal numbers of cells in each shRNA treatment were seeded for growth assays and counted as mentioned earlier. The shRNAs sequences are listed in the supplemental Table 1.
MLL-AF9 induced leukemia
To isolate LSK (lineagelowSca-1+c-kit+) cells, bone marrow cells from MTCH2F/F and MTCH2F/F VAV1-Cre mice13 were incubated with APC-conjugated c-kit (eBioscience, San Diego, CA) and PerCP Cy5.5-conjugated Sca-1(eBioscience) in addition to antibodies against the following eFluor450-conjugated lineage markers: Ter119, CD11b, B220, Gr1, CD4, CD3, and CD8a (eBioscience). The LSK cells were sorted with FACSAria II (BD Biosciences, San Jose, CA).
LSK+ cells were incubated in Iscove modified Dulbecco medium media with 10% fetal bovine serum, Pen/Strep, β-mercaptoethanol (50 µM), 100 ng/mL stem cell factor, 10 ng/mL IL-3, and 10 ng/mL IL-6 for 24 hours. Cells were then transduced with MLL-AF9 oncogene tagged with green fluorescent protein (GFP) by retroviral supernatant with polybrene (5 µg/mL). GFP+ cells were fluorescence-activated cell sorted 48 hours after transduction.
Fourteen days after transduction, 8-week-old C57BL/6 wild-type mice (Harlan, Rehovot, Israel) were sublethally irradiated (6.5 cGy) and transplanted with MLL-AF9-transduced cells (0.5 × 10⁶) from MTCH2 F/F or MTCH2 F/F VAV1-Cre mice. Animal studies were carried out according to the regulations and with approval of the Weizmann Institute Animal Care and Use Committee.
RNA sequencing
RNA was isolated from TEX cells 8 days after transduction with shRNA targeting MTCH2 or control, and was sequenced (Illumina Nextseq2500). During analysis, read adapters were removed using TRIM Galore 0.4.0, and reads were aligned against UCSC hg19, using Tophat v.2.0.11. Read counts per gene were obtained through htseq-count v.0.6.1p2. After removing genes whose CPM reads were less than 0.5, the edgeR package v.3.8.6 was used to normalize data using the trimmed mean of M values method, and to estimate differential expression by applying a generalized linear model between the control and MTCH2 knockdown. The 442 genes that were significantly differentially expressed at a false discovery rate (FDR) of 0.05 or less were divided into 233 genes with higher expression in MTCH2 knockdown compared with control and 209 with higher expression in control compared with MTCH2 knockdown. The gene expression data have been deposited in Gene Expression Omnibus database under the accession code GSE103834. Further details of the differential gene analysis are described in the supplemental Methods.
shRNA knockdown in cord blood, 8227 cells, and primary samples
Primary human CD34+-enriched cord blood, 8227 cells, and primary AML samples (CD34+ enriched) were transduced with GFP-containing lentivectors expressing MTCH2-shRNA2 or control shRNA. Equal numbers of cells (60 000 to 2 × 10⁶) were injected into sublethally irradiated nonobese diabetic (NOD)/severe combined immunodeficiency (SCID) mice (for cord blood and primary AML samples) or NOD/SCID-growth factor (GF) (for 8227 cells) mice 2 days after transduction. Eight weeks after injection, the percentage of human GFP+, CD45+ cells (for 8227 and cord blood) or the percentage of human GFP+, CD33+ cells (for primary samples) in the noninjected femur was determined. For other studies, GFP+ cells were flow-sorted and propagated for colony assay, flow cytometry, and immunoblotting.
Histone isolation
Acid extraction of histones was performed as described previously,19 and resolved by 12% sodium dodecyl sulfate-polyacrylamide gel electrophoresis and stained immunochemically with antibodies against acetylated-H4 (Millipore, Burlington, MA), acetylated-H3 (Abcam, Cambridge, UK), H3K9ac (Abcam), H3K14ac (Abcam), H3K18ac (Abcam) and H3K27ac (Abcam), H3 (Cell Signaling, Danvers, MA), and H4 (Millipore).
Chromatin immunoprecipitation and sequencing
Chromatin immunoprecipitation (ChIP) assays were performed in control and MTCH2 knockdown TEX cells that were treated with or without C646, as previously described,20 with a minor modification that cross-linked chromatin was sheared to ∼400- to 500-bp fragments by sonication. Antibodies against H3K27ac (Abcam) or an isotype-matched nonrelated immunoglobulin G (Millipore) were used as a negative control. ChIP DNA was sequenced on Illumina NovaSeq-6000. Details of data analysis are described in supplemental Methods.
Acetyl-coenzyme A level measurement
Whole-cell lysates were prepared using radioimmunoprecipitation assay buffer and nuclear fractions were isolated from 1 × 10⁷ cells for each treatment condition using a nuclei isolation kit (Sigma-Aldrich, St. Louis, MO). Acetyl-coenzyme A (CoA) level was measured by acetyl-CoA assay kit (Biovision, Milpitas, CA), following the manufacturer’s instructions.
Statistical analysis
GraphPad Prism 6.0 was used to perform analyses. Statistical analyses were performed by unpaired Student t test or 1-way analysis of variance (ANOVA) with post hoc Tukey’s test. Statistical significance was defined as P < .05.
Results
A CRISPR screen identifies MTCH2 as essential for growth and viability of leukemia cells
We sought to identify the components of mitochondrial proteome that were essential for growth and viability of AML cells via a CRISPR-Cas9 screen. OCI-AML2 cells overexpressing Cas9 were transduced with a lentiviral library of 91 320 guide RNAs (gRNAs) targeting 17 237 nuclear-encoded genes.16 Fourteen days after selection, genomic DNA was isolated, and the relative abundance of gRNA in the surviving cells was determined by Illumina sequencing. gRNAs negatively affecting the growth or viability of OCI-AML2 cells were inferred to be those significantly diminished in the final cell population relative to the cell population immediately after puromycin selection. In analyzing data, we focused on 5291 gRNAs that targeted 1050 nuclear-encoded mitochondrial genes. We identified the components of mitochondrial ribosome consistent with our prior reports that inhibition of mitochondrial translation killed AML cells and stem cells.21 Among the top 20 hits, we identified mitochondrial outer membrane protein MTCH2 (Figure 1A and supplemental Table 2). MTCH2 was also in the top 1% of hits in the whole screen (supplemental Figure 1). As no prior studies have investigated the role of MTCH2 in AML, we focused further analyses on this. Using 2 independent gRNAs, we confirmed that the knockout of MTCH2 reduced the growth and viability of Cas9-OCI-AML2 cells (Figure 1B).
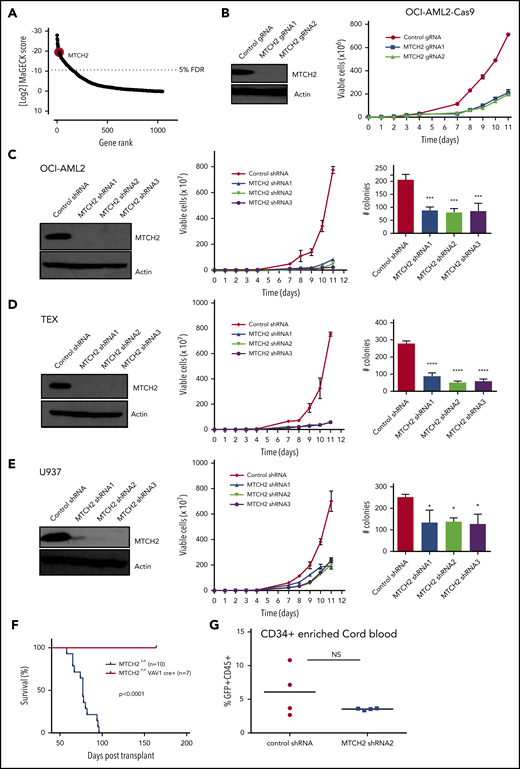
Knockout and knockdown of MTCH2 reduces the growth and viability of AML cells. (A) A CRISPR screen in Cas9-OCI-AML2 cells identified depleted gRNAs that target the 1050 nuclear-encoded mitochondrial proteins. Positive hits were identified at a FDR of less than 5%. Genes were ranked based on MAGeCK scores (log2 of P values) as calculated by the MAGeCK algorithm. (B) OCI-AML2-Cas9-expressing cells were transduced with gRNA targeting MTCH2. Seven days after transduction, MTCH2 protein levels were measured by immunoblotting. Viability and proliferation of cells were measured over time by trypan blue exclusion staining starting 4 days after transduction. Data represent mean viable cell counts ± standard deviation (SD) from representative experiments. (C–E) OCI-AML2 (C), TEX (D), and U937 (E) cells were transduced with shRNA targeting MTCH2 or control sequences. Seven days after transduction, levels of MTCH2 were detected by immunoblotting. Viability and proliferation of cells were measured from 4 days after the transduction of MTCH2 or control shRNA, using trypan blue exclusion staining. Data represent the mean ± SD of 3 independent experiments. Colony formation from control and MTCH2 knockdown clones. Mean ± SD colony counts are shown. *P < .05; **P < .01; ***P < .001, using 1-way ANOVA. (F) MLL-AF9 was transduced into MTCH2 F/F Vav1-Cre+ or MTCH2 F/F murine hematopoietic cells in vitro and then injected into secondary recipients. The survival of the mice was measured over time (MTCH2 F/F n = 10; MTCH2 F/F Vav1-Cre+, n = 7). (G) Human CD34-enriched cord blood was transduced with GFP-expressing plasmids containing control or MTCH2 shRNA2 sequences in lentiviral vectors. Forty-eight hours after transduction, 60 000 cells were injected intrafemorally into NSG mice (5 mice/group). Eight weeks after transplant, bone marrow aspirates were analyzed for human engraftment (anti-human CD45+) and GFP+ expression. The transduction efficiencies of the control and MTCH2 lentiviral vectors were 20.9% and 19.8%, respectively. No statistically significant differences were detected.
Knockout and knockdown of MTCH2 reduces the growth and viability of AML cells. (A) A CRISPR screen in Cas9-OCI-AML2 cells identified depleted gRNAs that target the 1050 nuclear-encoded mitochondrial proteins. Positive hits were identified at a FDR of less than 5%. Genes were ranked based on MAGeCK scores (log2 of P values) as calculated by the MAGeCK algorithm. (B) OCI-AML2-Cas9-expressing cells were transduced with gRNA targeting MTCH2. Seven days after transduction, MTCH2 protein levels were measured by immunoblotting. Viability and proliferation of cells were measured over time by trypan blue exclusion staining starting 4 days after transduction. Data represent mean viable cell counts ± standard deviation (SD) from representative experiments. (C–E) OCI-AML2 (C), TEX (D), and U937 (E) cells were transduced with shRNA targeting MTCH2 or control sequences. Seven days after transduction, levels of MTCH2 were detected by immunoblotting. Viability and proliferation of cells were measured from 4 days after the transduction of MTCH2 or control shRNA, using trypan blue exclusion staining. Data represent the mean ± SD of 3 independent experiments. Colony formation from control and MTCH2 knockdown clones. Mean ± SD colony counts are shown. *P < .05; **P < .01; ***P < .001, using 1-way ANOVA. (F) MLL-AF9 was transduced into MTCH2 F/F Vav1-Cre+ or MTCH2 F/F murine hematopoietic cells in vitro and then injected into secondary recipients. The survival of the mice was measured over time (MTCH2 F/F n = 10; MTCH2 F/F Vav1-Cre+, n = 7). (G) Human CD34-enriched cord blood was transduced with GFP-expressing plasmids containing control or MTCH2 shRNA2 sequences in lentiviral vectors. Forty-eight hours after transduction, 60 000 cells were injected intrafemorally into NSG mice (5 mice/group). Eight weeks after transplant, bone marrow aspirates were analyzed for human engraftment (anti-human CD45+) and GFP+ expression. The transduction efficiencies of the control and MTCH2 lentiviral vectors were 20.9% and 19.8%, respectively. No statistically significant differences were detected.
MTCH2 knockdown reduces proliferation of AML and progenitor cells
To further validate the results of CRISPR screen and test the effect of partial target inhibition, we knocked down MTCH2 in AML cell lines using multiple shRNA. Target knockdown was confirmed by immunoblotting. Similar to the knockout of MTCH2, MTCH2 knockdown reduced the growth and viability of OCI-AML2, TEX, U937, K562, NB4, and HL60 cells (Figure 1C-E and supplemental Figure 2). Despite reductions in cell growth in AML, MTCH2 knockdown did not induce apoptosis, as measured by Annexin V/PI staining, or induce cell cycle arrest (supplemental Figure 3). MTCH2 knockdown also significantly reduced the clonogenic growth of OCI-AML2 (>60%), TEX (>70%), and U937 (>40%) cells compared with controls (Figure 1C-E).
We also tested the effects of MTCH2 knockout in a murine model of leukemia. LSK+ hematopoietic cells from wild-type and MTCH2 flox/flox Vav1-cre mice were transduced with MLL-AF9 oncogene. Cells were then injected into secondary wild-type mice. Compared to wild-type, knockout of MTCH2 decreased the leukemogenic potential of MLL-AF9 oncogene and increased the survival of these mice (Figure 1F).Thus, MTCH2 knockdown or knockout profoundly affects the growth and viability of AML cells in vitro and in vivo. In contrast, knockdown of MTCH2 in primary CD34+ enriched human cord blood cells had minimal effects in marrow engraftment (Figure 1G), consistent with the effects on normal murine hematopoiesis.13 Knockout of MTCH2 did not change peripheral blood counts, but slightly (∼15%) reduced the abundance of hematopoietic stem cells with a corresponding increase in restricted progenitors.13
MTCH2 knockdown promotes differentiation of AML cells
To examine the effects of MTCH2 knockdown on AML stem cells and differentiation, we examined global changes in gene expression by RNA sequencing in TEX cells that exhibited pronounced effects after MTCH2 knockdown. TEX cells exhibit stem cell-like properties of hierarchical organization, differentiation, self-renewal, and marrow engraftment.15 We compared changes in gene expression with a public database of gene expression from 20 different subfractions of normal hematopoietic cells from 38 human samples.22 MTCH2 knockdown increased the expression of genes associated with a more differentiated myeloid population and decreased expression of genes associated with hematopoietic stem cells (supplemental Figure 4). Likewise, we compared changes in gene expression with genes that characterize fractions of primary AML stem (LSC+) and differentiated (LSC−) cells.23 MTCH2 knockdown increased expression of genes associated with more differentiated AML cells (LSC−) and decreased expression of genes associated with primitive/stem-like AML fractions (LSC+) (Figure 2A). Finally, we compared changes in gene expression after MTCH2 knockdown with bulk AML expression profile of relapsed AML of different origin24 (relapse origin-committed and relapse origin-primitive). MTCH2 knockdown increased expression of genes associated with AML with a committed/differentiated phenotype and decreased expression of genes associated with AML with a primitive phenotype (Figure 2A). Thus, the changes in gene expression suggest that MTCH2 affects AML stem cells and differentiation. We analyzed additional markers for the differentiation of AML cells. In OCI-AML2 cells, MTCH2 knockdown increased nonspecific esterase staining, a marker of monocytic differentiation (Figure 2B). Although no changes in macrophage markers CD11b and CD14 were detected (supplemental Figure 4E-F), increased expression of the myeloid granule protein, lysozyme,25 was detected in MTCH2 knockdown cells (Figure 2C). In addition, knockout of MTCH2 in the MLL-AF9 murine leukemia model increased the abundance of more differentiated Lin+ cells (Figure 2D).
![Knockdown of MTCH2 promotes differentiation of leukemia. (A) TEX cells were transduced with MTCH2 shRNA or control shRNA. Eight days after transduction, gene expression was measured by RNA sequencing. MTCH2 knockdown (233 genes) and control (209 genes) genes were used as signature gene sets in gene set enrichment analysis. Changes in gene expression were compared with LSC+ and LSC− populations of AML cells (top) or origins of relapsed AMLs (relapsed origin-committed [ROc] or relapsed origin-primitive [ROp]). (B) OCI-AML2 cells were transduced with MTCH2 shRNAs or control shRNA. Fifteen days after transduction, cells were stained for nonspecific esterase (NSE). NSE staining was quantified with ImageJ software. *P < .05; **P < .01; ***P < .001; ****P < .0001 by ANOVA. (C) mRNA levels of the Lysozyme (LYZ) in TEX cells after MTCH2 knockdown. Data represent relative mean ± SD (n = 3; control shRNA = 1.0). ****P ≤ .0001 by Student t test. (D) MTCH2 F/F and MTCH2 F/F Vav1-Cre+ LSK+ cells (stained for Ter119, CD11b, B220, Gr1, CD4, CD3, CD8a, cKit, and Sca1) were transduced with MLL-AF9. Two weeks after transduction, cells were analyzed for lineage-positive cells by staining for CD11b and Gr1 surface markers. Data represent 3 independent experiments. *P ≤ .05 by Student t test. (E) TEX AML cells were transduced with shRNA targeting MTCH2 or control sequences and then injected into sublethally irradiated NOD/SCID-GF mice. The percentage of human CD45+ cells in the noninjected femur was determined by flow cytometry (n = 10/group) after 5 weeks. The bar represents mean engraftment. **P = .0074 by Student t test. (F) 8227 leukemia cells were transduced with GFP lentivectors expressing MTCH2 shRNA2 or an empty control vector (Control). GFP+ cells were flow sorted and cultured. MTCH2 protein levels were measured by immunoblotting 5 days postsorting. The abundance of viable CD34+/CD38− cells were also analyzed by flow cytometry. The corresponding population in the control sample was set at 100%, and the population in the MTCH2 knockdown was expressed relative to control. *P ≤ .05; **P ≤ .01 by Student t test. (G) Colony formation from GFP+ control and MTCH2 knockdown clones in 8227 cells. Mean ± SD colony counts are shown. *P = .0136 by Student t test. (H) 8227 cells were transduced with GFP-expressing plasmids containing control or MTCH2 shRNA2 sequences and then injected (1 × 10⁶ cells/mice) into the sublethally irradiated NOD/SCID-GF mice (n = 8 mice/group). Eight weeks later, the percentage of human GFP+, CD45+ cells in the noninjected femur was determined by flow cytometry. The transduction efficiency of the control and MTCH2 lentiviral vectors was 30% and 32%, respectively. The bar represents mean engraftment. *P = .0233 by Student t test. (I) CD34+-enriched primary AML cells were transduced with GFP-expressing plasmids containing control or MTCH2 shRNA2 sequences and then injected (3.2 × 10⁵ cells/mice for patient 90249 and 5 × 10⁵ cells/mice for patient 100214) into the sublethally irradiated NOD-SCID mice (n = 8 mice/group). Eight weeks later, the percentage of human GFP+, CD33+ cells in the noninjected femur was determined by flow cytometry. The transduction efficiency of the control and MTCH2 lentiviral vectors was 11.9% and 15.1% for patient 90249 and 10.1% and 8.6% for patient 100214, respectively. (J) Secondary engraftments of primary AML cells were performed in NOD-SCID mice (for patient 90249, 2 × 10⁶ cells/mice were injected and n = 5 mice/group were used; for patient 100214, 1.7 × 10⁶ cells/mice were injected and n = 6 mice/group were used). Eight weeks later, the percentage of human GFP+, CD33+ cells in the noninjected femur was determined by flow cytometry. The bar represents mean engraftment, **P ≤ .01; ****P ≤ .0001 by Student t test.](https://ash.silverchair-cdn.com/ash/content_public/journal/blood/136/1/10.1182_blood.2019000106/4/m_bloodbld2019000106f2.png?Expires=1769201682&Signature=DxUvUEXtc19zYhoMfof~jGyCE4ND9w7QCrU6GyE-bNbYv7wrtZKPYrF5NIW~0N12yIpz4KrONAFF0OUH6u-YYrzybe6E88E6fSjqLP0oubsSzjLCGLgaZXGRqr~rCw~NEPtfRHqVH9Ac3HQcmKgvhnN1uq5Df1HkbnRK9R0Wv86WfWUWXlc1g1G91PZvhOjbQPFc~fIwnfRPtY-JmsyuM2dZEdqU3xnltZSh7eCRJlVQelu7zRM5DMxkd-hO-3gg5t7qtlPiChph45zkQXn21XvlfqR3kNoAq80zQ6krMm8nKCOFlNpsL7Kv3wncmSb0ymiByEQ7RUWpwa18jTIl2g__&Key-Pair-Id=APKAIE5G5CRDK6RD3PGA)
Knockdown of MTCH2 promotes differentiation of leukemia. (A) TEX cells were transduced with MTCH2 shRNA or control shRNA. Eight days after transduction, gene expression was measured by RNA sequencing. MTCH2 knockdown (233 genes) and control (209 genes) genes were used as signature gene sets in gene set enrichment analysis. Changes in gene expression were compared with LSC+ and LSC− populations of AML cells (top) or origins of relapsed AMLs (relapsed origin-committed [ROc] or relapsed origin-primitive [ROp]). (B) OCI-AML2 cells were transduced with MTCH2 shRNAs or control shRNA. Fifteen days after transduction, cells were stained for nonspecific esterase (NSE). NSE staining was quantified with ImageJ software. *P < .05; **P < .01; ***P < .001; ****P < .0001 by ANOVA. (C) mRNA levels of the Lysozyme (LYZ) in TEX cells after MTCH2 knockdown. Data represent relative mean ± SD (n = 3; control shRNA = 1.0). ****P ≤ .0001 by Student t test. (D) MTCH2 F/F and MTCH2 F/F Vav1-Cre+ LSK+ cells (stained for Ter119, CD11b, B220, Gr1, CD4, CD3, CD8a, cKit, and Sca1) were transduced with MLL-AF9. Two weeks after transduction, cells were analyzed for lineage-positive cells by staining for CD11b and Gr1 surface markers. Data represent 3 independent experiments. *P ≤ .05 by Student t test. (E) TEX AML cells were transduced with shRNA targeting MTCH2 or control sequences and then injected into sublethally irradiated NOD/SCID-GF mice. The percentage of human CD45+ cells in the noninjected femur was determined by flow cytometry (n = 10/group) after 5 weeks. The bar represents mean engraftment. **P = .0074 by Student t test. (F) 8227 leukemia cells were transduced with GFP lentivectors expressing MTCH2 shRNA2 or an empty control vector (Control). GFP+ cells were flow sorted and cultured. MTCH2 protein levels were measured by immunoblotting 5 days postsorting. The abundance of viable CD34+/CD38− cells were also analyzed by flow cytometry. The corresponding population in the control sample was set at 100%, and the population in the MTCH2 knockdown was expressed relative to control. *P ≤ .05; **P ≤ .01 by Student t test. (G) Colony formation from GFP+ control and MTCH2 knockdown clones in 8227 cells. Mean ± SD colony counts are shown. *P = .0136 by Student t test. (H) 8227 cells were transduced with GFP-expressing plasmids containing control or MTCH2 shRNA2 sequences and then injected (1 × 10⁶ cells/mice) into the sublethally irradiated NOD/SCID-GF mice (n = 8 mice/group). Eight weeks later, the percentage of human GFP+, CD45+ cells in the noninjected femur was determined by flow cytometry. The transduction efficiency of the control and MTCH2 lentiviral vectors was 30% and 32%, respectively. The bar represents mean engraftment. *P = .0233 by Student t test. (I) CD34+-enriched primary AML cells were transduced with GFP-expressing plasmids containing control or MTCH2 shRNA2 sequences and then injected (3.2 × 10⁵ cells/mice for patient 90249 and 5 × 10⁵ cells/mice for patient 100214) into the sublethally irradiated NOD-SCID mice (n = 8 mice/group). Eight weeks later, the percentage of human GFP+, CD33+ cells in the noninjected femur was determined by flow cytometry. The transduction efficiency of the control and MTCH2 lentiviral vectors was 11.9% and 15.1% for patient 90249 and 10.1% and 8.6% for patient 100214, respectively. (J) Secondary engraftments of primary AML cells were performed in NOD-SCID mice (for patient 90249, 2 × 10⁶ cells/mice were injected and n = 5 mice/group were used; for patient 100214, 1.7 × 10⁶ cells/mice were injected and n = 6 mice/group were used). Eight weeks later, the percentage of human GFP+, CD33+ cells in the noninjected femur was determined by flow cytometry. The bar represents mean engraftment, **P ≤ .01; ****P ≤ .0001 by Student t test.
Knockdown of MTCH2 promotes differentiation of leukemia. (A) TEX cells were transduced with MTCH2 shRNA or control shRNA. Eight days after transduction, gene expression was measured by RNA sequencing. MTCH2 knockdown (233 genes) and control (209 genes) genes were used as signature gene sets in gene set enrichment analysis. Changes in gene expression were compared with LSC+ and LSC− populations of AML cells (top) or origins of relapsed AMLs (relapsed origin-committed [ROc] or relapsed origin-primitive [ROp]). (B) OCI-AML2 cells were transduced with MTCH2 shRNAs or control shRNA. Fifteen days after transduction, cells were stained for nonspecific esterase (NSE). NSE staining was quantified with ImageJ software. *P < .05; **P < .01; ***P < .001; ****P < .0001 by ANOVA. (C) mRNA levels of the Lysozyme (LYZ) in TEX cells after MTCH2 knockdown. Data represent relative mean ± SD (n = 3; control shRNA = 1.0). ****P ≤ .0001 by Student t test. (D) MTCH2 F/F and MTCH2 F/F Vav1-Cre+ LSK+ cells (stained for Ter119, CD11b, B220, Gr1, CD4, CD3, CD8a, cKit, and Sca1) were transduced with MLL-AF9. Two weeks after transduction, cells were analyzed for lineage-positive cells by staining for CD11b and Gr1 surface markers. Data represent 3 independent experiments. *P ≤ .05 by Student t test. (E) TEX AML cells were transduced with shRNA targeting MTCH2 or control sequences and then injected into sublethally irradiated NOD/SCID-GF mice. The percentage of human CD45+ cells in the noninjected femur was determined by flow cytometry (n = 10/group) after 5 weeks. The bar represents mean engraftment. **P = .0074 by Student t test. (F) 8227 leukemia cells were transduced with GFP lentivectors expressing MTCH2 shRNA2 or an empty control vector (Control). GFP+ cells were flow sorted and cultured. MTCH2 protein levels were measured by immunoblotting 5 days postsorting. The abundance of viable CD34+/CD38− cells were also analyzed by flow cytometry. The corresponding population in the control sample was set at 100%, and the population in the MTCH2 knockdown was expressed relative to control. *P ≤ .05; **P ≤ .01 by Student t test. (G) Colony formation from GFP+ control and MTCH2 knockdown clones in 8227 cells. Mean ± SD colony counts are shown. *P = .0136 by Student t test. (H) 8227 cells were transduced with GFP-expressing plasmids containing control or MTCH2 shRNA2 sequences and then injected (1 × 10⁶ cells/mice) into the sublethally irradiated NOD/SCID-GF mice (n = 8 mice/group). Eight weeks later, the percentage of human GFP+, CD45+ cells in the noninjected femur was determined by flow cytometry. The transduction efficiency of the control and MTCH2 lentiviral vectors was 30% and 32%, respectively. The bar represents mean engraftment. *P = .0233 by Student t test. (I) CD34+-enriched primary AML cells were transduced with GFP-expressing plasmids containing control or MTCH2 shRNA2 sequences and then injected (3.2 × 10⁵ cells/mice for patient 90249 and 5 × 10⁵ cells/mice for patient 100214) into the sublethally irradiated NOD-SCID mice (n = 8 mice/group). Eight weeks later, the percentage of human GFP+, CD33+ cells in the noninjected femur was determined by flow cytometry. The transduction efficiency of the control and MTCH2 lentiviral vectors was 11.9% and 15.1% for patient 90249 and 10.1% and 8.6% for patient 100214, respectively. (J) Secondary engraftments of primary AML cells were performed in NOD-SCID mice (for patient 90249, 2 × 10⁶ cells/mice were injected and n = 5 mice/group were used; for patient 100214, 1.7 × 10⁶ cells/mice were injected and n = 6 mice/group were used). Eight weeks later, the percentage of human GFP+, CD33+ cells in the noninjected femur was determined by flow cytometry. The bar represents mean engraftment, **P ≤ .01; ****P ≤ .0001 by Student t test.
We then evaluated the effects of MTCH2 knockdown on the functions of the stem and progenitor cells in vivo. We knocked down MTCH2 in TEX cells, and then injected the control and knockdown cells into the marrow of NOD/SCID-GF mice. The knockdown of MTCH2 decreased marrow engraftment, demonstrating an effect on leukemia-initiating/progenitor cells (Figure 2E).
We extended our studies in the primary AML culture system, using 8227 cells.26 8227 cells are organized in a hierarchy of differentiated/committed cells and stem cells with stem cells residing in the CD34+CD38− fraction. To evaluate the effects of MTCH2 knockdown, 8227 cells were transduced with a GFP-containing–lentivirus vector expressing MTCH2-shRNA2 or a nontargeting control shRNA. MTCH2 knockdown level was confirmed by immunoblotting (Figure 2F). Three days after transduction, GFP+ cells were flow-sorted and propagated, and the proliferative, differentiation, and clonogenic capacity was evaluated. MTCH2 knockdown reduced the abundance of the CD34+CD38− population and the clonogenic capacity of 8227 cells (Figure 2F-G).
Finally, we performed bone marrow xenotransplantation studies with 8227 cells and primary AML samples. MTCH2 knockdown reduced the engraftment of these primary cells into immunodeficient mice (Figure 2H-I and supplemental Figure 5). In addition, MTCH2-depleted primary cells had decreased engraftment in secondary transplants (Figure 2J), indicating that MTCH2 knockdown can target leukemia-initiating cells. In contrast, MTCH2 knockdown in human cord blood had no effect on murine marrow engraftment (Figure 1G). Likewise, knockout of MTCH2 in mouse hematopoietic stem cells had minimal effects in reducing the colony-forming and engraftment potential of hematopoietic stem cells in bone marrow.13 Rather, increased proliferation of hematopoietic stem cells, hematopoietic stem and progenitor cells, and committed progenitors was also observed in this study.13
MTCH2 knockdown does not alter mitochondrial function
In murine hematopoietic cells, MTCH2 knockout leads to enlarged mitochondria, increased mitochondrial membrane potential, and basal oxygen consumption.13 Therefore, we examined mitochondrial function in OCI-AML2 cells after MTCH2 knockdown. In contrast to the effects of MTCH2 knockout on normal murine hematopoietic cells,13 we observed no changes in mitochondrial parameters, such as basal oxygen consumption, respiratory chain activity, or mitochondrial structure (supplemental Figure 6). Thus, MTCH2 regulates AML stem cells and differentiation independent of changes in oxidative phosphorylation.
Increased histone acetylation after MTCH2 knockdown is functionally important for differentiation of AML cells
Alterations in epigenetic marks can affect stem cells and differentiation. A recent study found that MTCH2 −/− mouse embryonic stem cells maintained high levels of histone acetylation.14 Therefore, we examined changes in histone acetylation. Knockdown of MTCH2 in OCI-AML2, TEX, and primary 8227 cells increased levels of pan-acetylated H3 (using an antibody that detects histone H3 acetylated on lysines 9, 14, 18, 23, and 27), and specifically H3K27ac and H3K18ac, without altering levels of H3K9/14ac or total H3 (Figure 3A and supplemental Figure 7). We also detected an increased in pan-acetylated H4 (using an antibody that detects histone H4 acetylated on lysines 5, 8, 12, and 16), without changes in levels of H4 (Figure 3A).
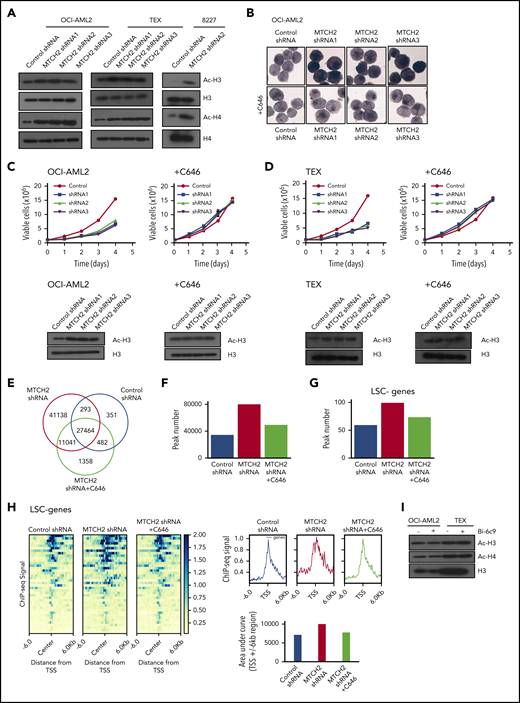
MTCH2 knockdown increase histone acetylation, which is functionally important for the differentiation of AML cells and independent of BID. (A) Histones were isolated from control and MTCH2 knockdown clones of OCI-AML2, TEX, and 8227 cells. Levels of total and acetylated histones H3 and H4 were measured by immunoblotting. Representative immunoblots are shown. (B) NSE staining of OCI-AML2 cells transduced with shRNA targeting MTCH2 with or without cotreatment with C646 (5 µM) for 4 days. Quantitative analysis of NSE staining was performed with ImageJ software. (C-D) Proliferation curves of OCI-AML2 (C) and TEX cells (D) transduced with shRNA targeting MTCH2 shRNAs with or without C646 (5 µM). Levels of total and acetylated H3 histones were measured in OCI-AML2 (C) and TEX cells (D) after MTCH2 knockdown and cotreatment with 5 µM C646 for 4 days. (E) Venn diagram of the number of peaks and overlapping peaks detected by MACS2 in control, MTCH2 knockdown, and MTCH2 knockdown cells treated with C646. (F) Bar graphs of total numbers of peaks of H3K27ac in control, MTCH2 knockdown, and MTCH2 knockdown TEX cells treated with C646, detected by MACS2. (G) The bar plot represents the number of H3K27ac peaks in control, MTCH2 knockdown, and MTCH2 knockdown cells treated with C646 that overlap with ±6-kb regions centered at the transcription start site (TSS) of the 40 LSC− genes that are upregulated in MTCH2 knockdown cells compared with control. (H) The average profiles and heat maps of the H3K27ac ChIP-seq signal in control, MTCH2 knockdown, and MTCH2 knockdown cells treated with C646 at ± 6kb of TSS of the 40 myeloid-like (LSC−) genes. The relative area under the curve (AUC) of TSS ± 6-kb regions is shown as bar graphs. (I) Histones were isolated from OCI-AML2 and TEX cells treated with or without Bid inhibitor, Bi-6C9, at Fas-inducing conditions (treated with CHX and CH-11). Levels of total and acetylated histones H3 and H4 were measured by immunoblotting. Representative immunoblots are shown.
MTCH2 knockdown increase histone acetylation, which is functionally important for the differentiation of AML cells and independent of BID. (A) Histones were isolated from control and MTCH2 knockdown clones of OCI-AML2, TEX, and 8227 cells. Levels of total and acetylated histones H3 and H4 were measured by immunoblotting. Representative immunoblots are shown. (B) NSE staining of OCI-AML2 cells transduced with shRNA targeting MTCH2 with or without cotreatment with C646 (5 µM) for 4 days. Quantitative analysis of NSE staining was performed with ImageJ software. (C-D) Proliferation curves of OCI-AML2 (C) and TEX cells (D) transduced with shRNA targeting MTCH2 shRNAs with or without C646 (5 µM). Levels of total and acetylated H3 histones were measured in OCI-AML2 (C) and TEX cells (D) after MTCH2 knockdown and cotreatment with 5 µM C646 for 4 days. (E) Venn diagram of the number of peaks and overlapping peaks detected by MACS2 in control, MTCH2 knockdown, and MTCH2 knockdown cells treated with C646. (F) Bar graphs of total numbers of peaks of H3K27ac in control, MTCH2 knockdown, and MTCH2 knockdown TEX cells treated with C646, detected by MACS2. (G) The bar plot represents the number of H3K27ac peaks in control, MTCH2 knockdown, and MTCH2 knockdown cells treated with C646 that overlap with ±6-kb regions centered at the transcription start site (TSS) of the 40 LSC− genes that are upregulated in MTCH2 knockdown cells compared with control. (H) The average profiles and heat maps of the H3K27ac ChIP-seq signal in control, MTCH2 knockdown, and MTCH2 knockdown cells treated with C646 at ± 6kb of TSS of the 40 myeloid-like (LSC−) genes. The relative area under the curve (AUC) of TSS ± 6-kb regions is shown as bar graphs. (I) Histones were isolated from OCI-AML2 and TEX cells treated with or without Bid inhibitor, Bi-6C9, at Fas-inducing conditions (treated with CHX and CH-11). Levels of total and acetylated histones H3 and H4 were measured by immunoblotting. Representative immunoblots are shown.
To determine whether increased histone/protein acetylation was functionally important for differentiation of AML cells, we knocked down MTCH2 while cotreating cells with an acetyltransferase inhibitor, C646.27 The addition of C646 prevented the increase in nonspecific esterase staining and histone acetylation, and restored the growth of MTCH2 knockdown cells to wild-type levels (Figure 3B-D and supplemental Figure 7).
To further investigate the involvement of locus-specific changes in histone acetylation to promote differentiation of AML and transcriptional reprogramming, we performed ChIP-sequencing with H3K27ac antibody after MTCH2 knockdown. H3K27ac is found at the active promoter/enhancer region of genes.28,29 Genome-wide H3K27ac occupancy analysis by ChIP-seq showed that MTCH2 knockdown increased H3K27ac peaks with the acquisition of 52 179 unique H3K27ac sites compared to control cells (Figure 3E). Cotreatment of MTCH2 knockdown cells with C646 restored total peaks towards the wild-type levels (Figure 3F). By RNA sequencing, we identified 226 genes that were upregulated after MTCH2 knockdown (FDR ≤ 0.05; Gene Expression Omnibus accession code: GSE103834). These genes showed increased H3K27ac peak numbers and diffused pattern of increased H3K27ac sites compared with control that reversed to wild-type levels after C646 treatment (supplemental Figure 8A-B).
Of the 226 upregulated genes, 86 were associated with LSC− myeloid differentiation (FDR ≤ 0.05 and LSC score ≤−1.5).23 Among these 86 genes, 40 had significant differential binding occupancy scores (FDR ≤ 0.05) after MTCH2 knockdown compared with control (supplemental Table 3). These genes also showed an increased peak number and a diffused increase pattern of H3K27ac sites, and the increased sites were returned to wild-type levels after treatment with C646 (Figure 3G-H). ChIP-seq tracks of representative genes are shown in supplemental Figure 8C. We selected 4 of these genes (S100A9, CSF2RB, LRPAP1, and NFκB) and confirmed their upregulation by quantitative reverse transcriptase–real time polymerase chain reaction and increased H3K27ac levels by ChIP-quantitative real time polymerase chain reaction. Both expression and H3K27ac levels were returned to wild-type levels by cotreatment with C646 (supplemental Figure 9A-B).
MTCH2 regulates AML differentiation independent of BID
MTCH2 acts as a tBID receptor-like protein to facilitate BID recruitment to mitochondria.3-5 In MTCH2−/− mouse embryonic stem cells and embryonic fibroblasts, decreased targeting of BID to mitochondria was observed.3 We thus tested whether differentiation and loss of stem cell function after MTCH2 knockdown was a result of inhibition of BID. We treated AML cells with BID inhibitor, BI-6c9. Consistent with its ability to inhibit BID, BI-6c9 prevented cell death after Fas activation (supplemental Figure 10). However, BID inhibition did not alter the level of histone acetylation or increase AML differentiation (Figure 3H). Thus, the effects of MTCH2 knockdown appeared independent of BID.
MTCH2 inhibition alters mitochondrial and nuclear pyruvate content and pyruvate dehydrogenase
To understand how MTCH2 increased histone acetylation, we examined changes in metabolites after MTCH2 knockdown. In murine embryonic stem cells, knockout of MTCH2 decreased the entry of glucose into the tricarboxylic acid (TCA) cycle.14 A compensatory increase in glutamine utilization and increased levels of TCA cycle metabolites arising from glutamine preserved total levels of TCA cycle substrates. Therefore, we examined changes in metabolites and focused on levels of pyruvate in OCI-AML2 cells. Knockdown of MTCH2 in OCI-AML2 cells decreased levels of pyruvate in the mitochondria consistent with metabolic flux experiments in murine embryonic stem cells. We also observed an increase in nuclear levels of pyruvate (Figure 4A). In addition, MTCH2 knockdown increased the levels of total and nuclear acetyl-CoA (supplemental Figure 11). However, levels of lactate did not change (Figure 4B).
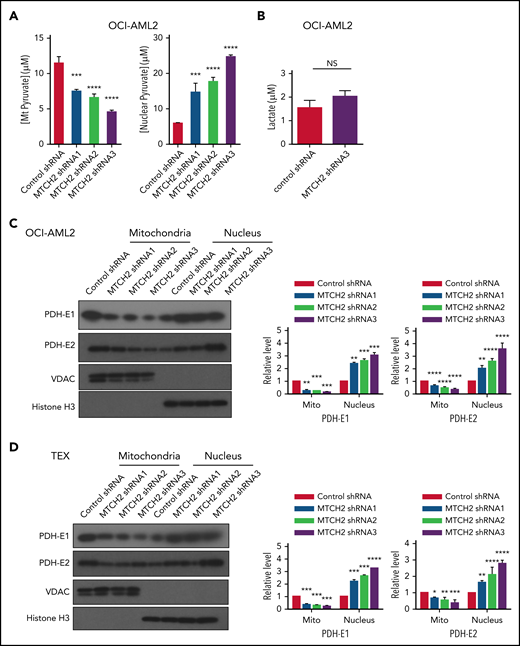
MTCH2 knockdown increases nuclear levels of pyruvate and nuclear levels of PDH complex. (A) Levels of mitochondrial and nuclear pyruvate were measured from control and MTCH2 shRNA-knockdown clones of OCI-AML2 cells as described in the supplemental Methods (****P < .0001). (B) Levels of intracellular lactate were quantified by nuclear magnetic resonance from control and MTCH2 shRNA-knockdown clones of OCI-AML2 cells, as described in the supplemental Methods. (C-D) Nuclear and mitochondrial fractions were isolated from control and MTCH2 shRNA-knockdown clones of (C) OCI-AML2 or (D) TEX cells and analyzed by immunoblotting. Antibodies against PDH (E1α and E2), VDAC, and histone H3 were used. Representative immunoblots are shown. The relative expression of PDH subunits, E1α and E2 in mitochondria and nucleus, was quantified by densitometry and normalized to loading controls SOD1 (for E1 α), VDAC (for E2), and histone H3, respectively, and was expressed relative to control shRNA. Data are represented as mean ± SD from 3 independent experiments. **P < .01; ***P < .001; ****P < .0001 by ANOVA.
MTCH2 knockdown increases nuclear levels of pyruvate and nuclear levels of PDH complex. (A) Levels of mitochondrial and nuclear pyruvate were measured from control and MTCH2 shRNA-knockdown clones of OCI-AML2 cells as described in the supplemental Methods (****P < .0001). (B) Levels of intracellular lactate were quantified by nuclear magnetic resonance from control and MTCH2 shRNA-knockdown clones of OCI-AML2 cells, as described in the supplemental Methods. (C-D) Nuclear and mitochondrial fractions were isolated from control and MTCH2 shRNA-knockdown clones of (C) OCI-AML2 or (D) TEX cells and analyzed by immunoblotting. Antibodies against PDH (E1α and E2), VDAC, and histone H3 were used. Representative immunoblots are shown. The relative expression of PDH subunits, E1α and E2 in mitochondria and nucleus, was quantified by densitometry and normalized to loading controls SOD1 (for E1 α), VDAC (for E2), and histone H3, respectively, and was expressed relative to control shRNA. Data are represented as mean ± SD from 3 independent experiments. **P < .01; ***P < .001; ****P < .0001 by ANOVA.
Pyruvate dehydrogenase (PDH) converts pyruvate to acetyl-CoA. Under conditions of mitochondrial stress, such as rotenone treatment, PDH can translocate to the nucleus, where it converts nuclear pyruvate to acetyl-CoA, and thereby increases histone acetylation.30 Therefore, we examined changes in nuclear and mitochondrial levels of PDH after MTCH2 knockdown. Knockdown of MTCH2 increased nuclear and decreased mitochondrial levels of PDH in OCI-AML2 and TEX cells (Figure 4C-D).
Inhibition of mitochondrial pyruvate carrier does not increase histone acetylation to promote AML differentiation
As MTCH2 knockdown decreased levels of mitochondrial pyruvate, we asked whether the decreased entry of pyruvate into mitochondria was sufficient to increase histone acetylation and promote differentiation in AML. The entry of pyruvate into the mitochondria is controlled by Mitochondrial Pyruvate Carrier. Therefore, to determine whether inhibiting the entry of pyruvate into mitochondria is sufficient to regulate the differentiation of AML cells and mimic the effects of MTCH2 knockdown, we inhibited Mitochondrial Pyruvate Carrier with specific chemical inhibitor, UK5099, by treating OCI-AML2 cells.31 UK5099 treatment decreased levels of pyruvate in the mitochondria, but it did not increase levels of histone acetylation (supplemental Figure 12).
Nuclear overexpression of PDH complex mimics the effects of MTCH2 knockdown
Next, we asked whether increased levels of nuclear PDH were sufficient to increase histone acetylation and differentiation in AML. We selectively increased levels of E1 (E1α) and E2 subunits of PDH in the nucleus of OCI-AML2 and NB4 cells without altering levels of mitochondrial PDH by overexpressing these subunits tagged with a nuclear localizing sequence (Figure 5A and supplemental Figure 13). Increasing nuclear PDH mimicked the effects of MTCH2 knockdown. Increased nuclear PDH elevated H3, H4 acetylation and differentiation, decreased clonogenic growth, and proliferation of AML cells (Figure 5B-E and supplemental Figure 13). A recent study in A549 cells discovered the translocation of PDH to the nucleus utilizes Hsp70,30 but we did not observe changes in the nuclear or total level of Hsp70 in MTCH2 knockdown AML cells (supplemental Figure 14).
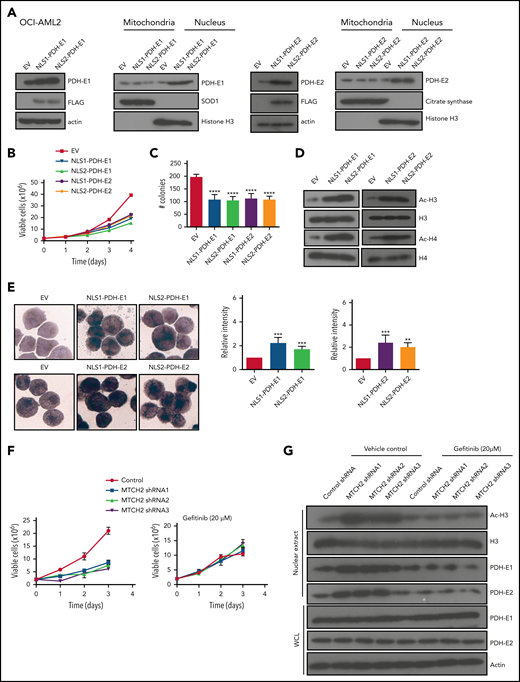
Overexpression of PDH complex mimics the effects of MTCH2 knockdown. (A) OCI-AML2 cells were transduced with cDNA encoding PDH-E1 (E1α) or PDH-E2 tagged with 1 of 2 different nuclear localization signals (NLS1 or NLS2) or empty vector. PDH-E1α or PDH-E2 expression was analyzed by immunoblotting of whole-cell lysates or nuclear or mitochondrial fractions. (B) Growth and viability of OCI-AML2 cells overexpressing PDH-E1 (E1α) or PDH-E2 with a nuclear localizing tag (NLS1 or NLS2) were measured with the trypan blue exclusion assay. (C) Colony formation assay of OCI-AML2 cells overexpressing PDH with a nuclear localizing tag. Mean ± SD colony counts are shown. ****P < .0001 by ANOVA. (D) Histones were isolated from OCI-AML2 cells transduced with empty vector (EV), PDH-E1 (E1α), or PDH-E2 cDNAs with NLS1 or NLS2 signals. Levels of total and acetylated H3 and H4 histones were measured by immunoblotting. (E) NSE staining of OCI-AML2 cells overexpressing PDH-E1α or PDH-E2 with NLS1 or NLS2. Quantitative analysis of NSE staining was performed with ImageJ software. **P < .01; ***P < .001; ****P < .0001 by ANOVA. (F) Proliferation curves of OCI-AML2 cells transduced with shRNAs targeting MTCH2 and cotreatment with gefitinib (20 µM) for 3 days. (G) Levels of total and acetylated H3 histones, levels of PDH-E1 (E1α) and E2 in whole-cell lysate, and nuclear extracts from OCI-AML2 after MTCH2 knockdown with or without cotreatment with gefitinib (20 µM) for 3 days. Representative immunoblots are shown.
Overexpression of PDH complex mimics the effects of MTCH2 knockdown. (A) OCI-AML2 cells were transduced with cDNA encoding PDH-E1 (E1α) or PDH-E2 tagged with 1 of 2 different nuclear localization signals (NLS1 or NLS2) or empty vector. PDH-E1α or PDH-E2 expression was analyzed by immunoblotting of whole-cell lysates or nuclear or mitochondrial fractions. (B) Growth and viability of OCI-AML2 cells overexpressing PDH-E1 (E1α) or PDH-E2 with a nuclear localizing tag (NLS1 or NLS2) were measured with the trypan blue exclusion assay. (C) Colony formation assay of OCI-AML2 cells overexpressing PDH with a nuclear localizing tag. Mean ± SD colony counts are shown. ****P < .0001 by ANOVA. (D) Histones were isolated from OCI-AML2 cells transduced with empty vector (EV), PDH-E1 (E1α), or PDH-E2 cDNAs with NLS1 or NLS2 signals. Levels of total and acetylated H3 and H4 histones were measured by immunoblotting. (E) NSE staining of OCI-AML2 cells overexpressing PDH-E1α or PDH-E2 with NLS1 or NLS2. Quantitative analysis of NSE staining was performed with ImageJ software. **P < .01; ***P < .001; ****P < .0001 by ANOVA. (F) Proliferation curves of OCI-AML2 cells transduced with shRNAs targeting MTCH2 and cotreatment with gefitinib (20 µM) for 3 days. (G) Levels of total and acetylated H3 histones, levels of PDH-E1 (E1α) and E2 in whole-cell lysate, and nuclear extracts from OCI-AML2 after MTCH2 knockdown with or without cotreatment with gefitinib (20 µM) for 3 days. Representative immunoblots are shown.
We used an EGF receptor inhibitor, Gefitinib, to decrease nuclear levels of PDH, as previously described.30 Reduction of the nuclear level of PDH rescued the MTCH2 knockdown phenotypes of cell growth and histone acetylation in AML cells (Figure 5F-G and supplemental Figure 15). Thus, our results demonstrate that increased nuclear PDH is functionally important for differentiation of AML cells.
Discussion
Through a CRISPR screen, we identified MTCH2 as an essential gene for the growth and survival of AML cells. We showed that knockdown of MTCH2-promoted AML cell differentiation by causing the accumulation of pyruvate and PDH in the nucleus leading to increased histone acetylation. As such, we defined new functions for MTCH2 and a new mechanism by which mitochondrial metabolism influences gene expression, stem cell function, and differentiation.
Previous studies have linked MTCH2 to metabolism, but the mechanisms have been unclear. For example, knockout of MTCH2 in skeletal muscle protected mice from weight gain despite having increased food intake compared with their littermate controls.12 Metabolic studies of these mice revealed increased levels of pyruvate and lactate in the muscle.12 Likewise, in a study of 4923 adults, MTCH2 SNP rs4752856 was associated with obesity.7 Potentially, the findings in mice and humans are related to our observations that MTCH2 affects the entry of pyruvate into the mitochondria as increasing or decreasing pyruvate flux into the TCA cycle could change metabolic rates. However, we noted important differences between MTCH2 inhibition in AML and normal cells. In murine hematopoietic and muscle cells, inhibiting MTCH2 increased rates of oxidative phosphorylation and mitochondrial mass.12,14 Although we cannot rule out more subtle effects on mitochondrial structure, knockdown of MTCH2 in AML cells did not change rates of oxygen consumption or affect the mitochondrial structure. Similar to the changes in metabolic flux observed after MTCH2 knockout in embryonic stem cells, we speculate that increased flux of glutamine into the TCA cycle compensated for decreased entry of pyruvate into the mitochondria after MTCH2 knockdown in AML, and preserved levels of TCA cycle metabolites and oxidative phosphorylation. Future metabolic flux studies in AML cells would help clarify changes in metabolic flux after MTCH2 knockdown and could trace the fate of pyruvate, glucose, and glutamine.
Upon inhibition of MTCH2, we observed decreased mitochondrial and increased nuclear levels of pyruvate along with increased levels of nuclear PDH and histone acetylation. We showed that overexpression of PDH in the nucleus was sufficient to increase histone acetylation and promote differentiation of AML cells. Our results are in agreement with a recent study30 that reported mitochondrial stress produced by inhibiting the respiratory chain complex promoted the translocation of PDH from mitochondria to nucleus. In nucleus, PDH converted pyruvate to acetyl-CoA and increased histone acetylation. We have shown that the locus-specific change in H3K27ac led to alterations in transcriptional programs to promote differentiation.
The pathways that control the import of proteins into mitochondria are well characterized. However, a large unanswered question in mitochondrial biology is how mature mitochondrial proteins exit the organelle after the import and folding. A recent study discovered that the translocation of PDH to the nucleus utlilized Hsp70,30 although we did not observe such a change in the nuclear or total level of Hsp70 in MTCH2 knockdown AML cells. Thus, further studies are required to define the pathway regulating the export of proteins from the mitochondria.
In conclusion, our data demonstrate that MTCH2 is required for AML stem cell survival. Inhibiting MTCH2 decreases the flux of pyruvate into the mitochondria, leading to an increase of PDH in the nucleus. PDH converts pyruvate to Acetyl-CoA in the nucleus, leading to increased acetylation of nuclear proteins, including histones. The increased histone acetylation alters gene expression, induces differentiation and decreases stem survival in AML cells. These data highlight new mechanisms by which mitochondrial pathways and metabolism affect AML stem cells and differentiation.
For original data, please contact the corresponding author: aaron.schimmer@uhn.ca.
The online version of this article contains a data supplement.
The publication costs of this article were defrayed in part by page charge payment. Therefore, and solely to indicate this fact, this article is hereby marked “advertisement” in accordance with 18 USC section 1734.
Acknowledgments
The authors thank Jill Flewelling (Princess Margaret Cancer Centre) for administrative assistance. They also thank Shai Izraeli (Tel Aviv University) for helping initiate the project.
This work was supported by the Canadian Institutes of Health Research, the Ontario Institute for Cancer Research with funding provided by the Ontario Ministry of Research and Innovation, the Princess Margaret Cancer Centre Foundation, and the Ministry of Long Term Health and Planning in the Province of Ontario. D.H.K. was supported by a fellowship from the Leukemia and Lymphoma Society of Canada. A.D.S. holds the Barbara Baker Chair in Leukemia and Related Diseases.
Authorship
Contribution: D.H.K. performed the conception and design, execution, collection, and/or assembly of data, data analysis, interpretation, and manuscript writing; M.M., Y.W., V.V., M.G., R.H., X.W., N.M., D.V.J., Y.J., G.W.X., R.L., A.S., Z.M.B., T.K., G.D.B., S.A.M., D.D.D.C., M.D.M., and A.G. performed the collection and/or assembly of data, data analysis, and interpretation; and A.D.S. performed the conception and design, financial support, collection and/or assembly of data, data analysis and interpretation, manuscript writing, and final approval of the manuscript.
Conflict-of-interest disclosure: A.D.S. has received research funding from Takeda Pharmaceuticals and Medivir AB and consulting fees/honorarium from Novartis, Jazz, and Otsuka Pharmaceuticals and also holds stock in AbbVie. D.D.D.C. has received research funding from Pfizer and Nektar therapeutics. The remaining authors declare no competing financial interests.
Correspondence: Aaron D. Schimmer, Princess Margaret Cancer Centre, 101 College St, 8th Floor, Room 8-706 Toronto, ON M5G 1L7, Canada; e-mail: aaron.schimmer@uhn.ca.

This feature is available to Subscribers Only
Sign In or Create an Account Close Modal