

Key Points
HRI activates ATF4 to promote BCL11A transcription and fetal hemoglobin silencing.
ATF4 regulates BCL11A in a species-selective manner.

Abstract
Reactivation of fetal hemoglobin remains a critical goal in the treatment of patients with sickle cell disease and β-thalassemia. Previously, we discovered that silencing of the fetal γ-globin gene requires the erythroid-specific eIF2α kinase heme-regulated inhibitor (HRI), suggesting that HRI might present a pharmacologic target for raising fetal hemoglobin levels. Here, via a CRISPR-Cas9–guided loss-of-function screen in human erythroblasts, we identify transcription factor ATF4, a known HRI-regulated protein, as a novel γ-globin regulator. ATF4 directly stimulates transcription of BCL11A, a repressor of γ-globin transcription, by binding to its enhancer and fostering enhancer-promoter contacts. Notably, HRI-deficient mice display normal Bcl11a levels, suggesting species-selective regulation, which we explain here by demonstrating that the analogous ATF4 motif at the murine Bcl11a enhancer is largely dispensable. Our studies uncover a linear signaling pathway from HRI to ATF4 to BCL11A to γ-globin and illustrate potential limits of murine models of globin gene regulation.
Introduction
Genetic defects in the β-globin gene locus can cause β-hemoglobinopathies such as sickle cell disease and β-thalassemia.1 Elevated levels of the fetal form of hemoglobin (HbF) can attenuate the severity of these disorders. For decades, studies have been aimed at identifying regulators of HbF production. Genome-wide association studies originally pointed to transcription factor BCL11A as an HbF repressor.2,3 More recent work suggests that BCL11A directly binds and represses the γ-globin genes, which encode the fetal β-like globin chains.4-6 BCL11A is an appealing target for therapeutic genome manipulation, such as disruption of its erythroid specific enhancer, but direct BCL11A perturbation via pharmacologic means has remained challenging.7,8
Previously, we reported that heme-regulated inhibitor (HRI), a highly erythroid-enriched member of the stress kinase family, functions as a novel regulator of γ-globin transcription.9 HRI thus might serve as a potential pharmacologic target for the treatment of β-hemoglobinopathies. Moreover, we found that HRI loss was associated with a reduction of BCL11A levels via an unknown mechanism.
When activated, HRI phosphorylates translation factor eIF2α to broadly attenuate cellular messenger RNA (mRNA) translation. However, active HRI promotes the translation of select transcripts, most prominently including transcription factor ATF4, which in turn activates genes involved in the cellular stress response.10-12
In the present study, we carried out a CRISPR-Cas9–guided loss-of-function genetic screen of 1446 transcription factors using HbF levels as readout, which uncovered ATF4 as a novel γ-globin regulator. By combining chromatin immunoprecipitation sequencing (ChIP-seq), Capture-C, and gene editing techniques, we determined that ATF4 binds to the BCL11A +55 enhancer to augment enhancer-promoter contacts and stimulate BCL11A transcription. HRI knockout mice display normal levels of both Bcl11a and Bcl11a target genes, suggesting that the HRI-ATF4-BCL11A pathway is not conserved in mice. ATF4 profiling and gene editing in murine cells showed that a corresponding ATF4 element in the murine Bcl11a enhancer is largely dispensable for Bcl11a transcription, providing an explanation for the species-selective effect. Our study thus uncovers a mechanism by which HRI regulates HbF levels.
Methods
Cell culture
HUDEP2 cells were cultured as described previously.9 Briefly, StemSpan SFEM (Stem Cell Technologies) was supplemented with 1 μg/mL of doxycycline, 1 μM of dexamethasone, 100 ng/mL of human stem cell factor, 3 units per mL of erythropoietin, and 1% penicillin/streptomycin. HUDEP2 cells were differentiated for 5 days in Iscove modified Dulbecco medium (IMDM) supplemented with 330 μg/mL of holotransferrin, 10 μg/mL of insulin, 10 μg/mL of heparin, 5% fetal bovine serum, 3 units per mL of erythropoietin, 1 μg/mL of doxycycline, and 1% penicillin/streptomycin.
Human CD34+ hematopoietic stem/progenitor cells (HSPCs) from mobilized peripheral blood were obtained from the Fred Hutchinson Cancer Research Center. Human CD34+ HSPCs were cultured as described previously.9 For phase 1 medium, IMDM was supplemented with 100 ng/mL of human stem cell factor, 1 ng/mL of interleukin-3, 3 units per mL of erythropoietin, 2% penicillin/streptomycin, 200 μg/mL of holotransferrin, 10 μg/mL of insulin, 5% human male A/B plasma, and 10 μg/mL of heparin. For phase 2 medium, the interleukin-3 was withdrawn after 9 days of culture. For phase 3 medium, the cells were cultured with IMDM supplemented with 3 units per mL of erythropoietin, 2% penicillin/streptomycin, 1 mg/mL of holotransferrin, 10 μg/mL of insulin, 5% human A/B plasma, and 10 μg/mL of heparin.
G1E-ER4 cells were cultured as described previously.13 IMDM was supplemented with 15% fetal bovine serum, 2% penicillin/streptomycin, 0.6% Kit ligand–conditioned medium, 0.15 mM of monothioglycerol, and 2 units per mL of erythropoietin.
Transcription factor CRISPR screen
A HUDEP2 cell line stably expressing Streptococcus pyogenes Cas9 (spCas9) was generated by infection with spCas9-expressing lentivirus and selection with puromycin for 5 days. The domain-focused CRISPR single guide RNA (sgRNA) library was constructed, and CRISPR screen of HbF enrichment was performed as previously described.9,14
CRISPR gene knockout in HUDEP2 cells
sgRNAs were cloned into lentiviral vectors as previously described.9,14 HUDEP2 cells with stable spCas9 integration were infected and sorted based on fluorescent reporters.
RNP electroporation in CD34+ cells
Chemically modified sgRNAs were purchased from Synthego. Ribonucleoprotein particle (RNP) complexes were assembled by mixing 100 pmol of modified sgRNA and 50 pmol of spCas9 protein (IDT) and incubated at room temperature for 15 minutes. CD34+ HSPCs (50 000-100 000) from days 3 to 4 of phase 1 culture were electroporated using a 4D Nucleofector (Lonza) with program DZ-100.15
Quantitative reverse transcription polymerase chain reaction
Cells were homogenized using TRIzol (Life Technologies). RNA was extracted using RNeasy Mini Kit (Qiagen). Reverse transcription was performed using iScript Reverse Transcription Supermix (Bio-Rad).
ATF4 and BCL11A overexpression
ATF4 coding sequences was cloned into a lentiviral vector driven by the EF1α promoter. HUDEP2 cells were sorted for green fluorescent protein. Undifferentiated cells were collected 3 days post infection.
BCL11A-ER construct was a gift from Merlin Crossley (University of New South Wales, Sydney, NSW, Australia). BCL11A-ER was subcloned into a lentiviral vector driven by the EF1α promoter. HUDEP2 cells were sorted for green fluorescent protein. Cells were maintained in expansion medium without tamoxifen. For induction of BCL11A-ER, cells were cultured for 1 day in expansion medium with 10 μM of tamoxifen and differentiated for 5 days in the presence of 10 μM of tamoxifen.5
Antibodies
Primary antibodies used for western blot were as follows: HRI (MBS2526743; Biosource), phosphorylated eIF2α (ab32157; Abcam), total eIF2α ab5369; Abcam), BCL11A (19487; Abcam), ATF4 (11815S; Cell Signaling Technology), γ-globin (NB110-41084; Novus Biologicals), and B-actin (47778; Santa Cruz Biotechnology).
Tunicamycin treatment
Undifferentiated HUDEP2 cells were cultured in the expansion medium with 2.5 μg/mL of tunicamycin (T7765; MilliporeSigma) for 3 days.
ChIP-seq and analysis
Undifferentiated HUDEP2, primary erythroblasts from day 11 of culture, and G1E-ER4 cells were crosslinked with 1% formaldehyde at room temperature for 10 minutes. ATF4 (11815S; Cell Signaling Technology) ChIP was performed as previously described.16 ChIP-seq libraries were prepared using TruSeq ChIP-seq Sample Preparation Kit (IP-202-1012; Illumina) according to the manufacturer’s instructions. Reads were aligned with Bowtie2 local alignment to allow the mapping of indels.17 All ChIP-seq experiments were performed in 2 biological replicates. Enriched biological processes were analyzed using the Genomic Regions Enrichment of Annotations Tool (GREAT; version 4.0.4) with the single nearest genes within 500 kb of ATF4 peaks.18
Capture-C
Capture-C was performed using NlaIII enzyme as described.19 All experiments were performed in 2 biological replicates. Biotin-labeled DNA probes are listed in supplemental Table 6, available on the Blood Web site. The libraries were sequenced on an Illumina Nextseq 500 with paired-end sequencing. The reads were processed using published scripts.20 Capture-C interactions of biological replicates were combined and normalized to total interactions.
Generation of HRI/Townes mice
Mice were maintained at the Children’s Hospital of Philadelphia animal facility, and all experiments were carried out using protocols approved by the Children’s Hospital of Philadelphia Institutional Animal Care and Use Committee. HRI−/− mice were generated by the University of Pennsylvania Transgenic and Chimeric Mouse Facility using CRISPR-Cas9–mediated genetic deletion. Briefly, Cas9 mRNA alongside sgRNA targeting HRI (HRI 5′ target sequence 5′-TGAGCGTTTATGATGCCTACAGG-3′; HRI 3′ target sequence 5′-GTCTACGCTCTACCCGTTTGTGG-3′) was microinjected into blastocysts to produce founder mice, which were subsequently crossed with C57Bl/6 mice to obtain heterozygous N1 animals. Townes mice (B6;129-Hbbtm2(HBG1,HBB*)Tow/Hbbtm3(HBG1,HBB)Tow Hbatm1(HBA)Tow/J) were purchased from Jackson Labs (#013071) and crossed with HRI+/− heterozygous mice as above to achieve HRI+/+βAβS, HRI+/−βAβS, and HRI−/−βAβS mice containing a humanized α-globin locus.
All genotyping was performed by polymerase chain reaction of tail DNA using the AccuStart II Mouse Genotyping Kit (95135-500; Quanta Biosciences). HRI homologous recombinants were identified using a combination of primers internal (primers 1 and 2) and external (primers 3 and 4) to the excised region. Townes βA, βS, and α-globin genotyping was performed as per the Genotyping Protocols Database from Jackson Laboratories (protocols #27991 for βA and βS and #25243 for α-globin).
Blood/marrow extraction and peripheral blood analysis
Male Townes HRI+/+, HRI+/−, and HRI−/− were euthanized at 6 to 7 months of age by carbon dioxide narcosis. Bone marrow was obtained by flushing of mouse femurs with phosphate-buffered saline in 10 μg/mL of heparin and single-cell suspensions made by trituration. White blood cell count, Hb, platelet count, mean corpuscular volume, red blood cell count, and mean corpuscular Hb were obtained by analysis on the HemaVet 950 (Drew Scientific).
Isolation of erythroid cells from mouse bone marrow
Bone marrow cells were blocked in phosphate-buffered saline/0.1% bovine serum albumin (Sigma-Aldrich) and stained with PE-CD71 (113808; Biolegend) and PE-Cy7 Ter119 (116222; Biolegend), and CD71+Ter119+ cells were sorted on the FACSAria Fusion (BD Biosciences).
Data availability
The ChIP-seq and Capture-C data have been deposited into the Gene Expression Omnibus database (GSE143963).
Results
CRISPR screen identifies ATF4 as a novel γ-globin repressor
In an attempt to identify nuclear factors that might act downstream of HRI to regulate HbF levels, we performed a loss-of-function CRISPR screen in the human erythroid line HUDEP2 against the DNA binding domains of 1446 human transcription factors.21 Top and bottom 10% of HbF-expressing cells were sorted after HbF staining, and representation of each sgRNA was assessed by deep sequencing. As expected, control sgRNAs were evenly distributed between HbF-high and -low populations. sgRNAs targeting the known γ-globin repressors BCL11A, LRF, MBD2, and MTA2 were highly enriched in the HbF-high population (Figure 1A), validating our screen.22-24 Notably, all 6 sgRNAs in the library targeting ATF4, a known HRI regulated transcription factor, were enriched in the HbF-high cells (Figure 1A). HRI phosphorylates eIF2α, which in turn promotes the translation of ATF4 mRNA.11 Depletion of ATF4 with 2 independent sgRNAs in HUDEP2 cells increased γ-globin mRNA and protein levels, confirming the results from the screen (Figure 1B-C). Moreover, ATF4- and HRI-depleted cells displayed similar levels of γ-globin reactivation. To test ATF4 function in primary human erythroid cells, we initially used RNPs as delivery tools for ATF4 sgRNAs. However, because near-complete loss of ATF4 was not well tolerated by primary cells (data not shown), consistent with mouse knockout studies, we used short hairpin RNAs (shRNAs) in an attempt to only partially reduce ATF4 levels.25 A reduction of ATF4 by ∼50% modestly raised γ-globin mRNA (supplemental Figure 1A-B). Together, these results support a role for ATF4 as a γ-globin regulator.
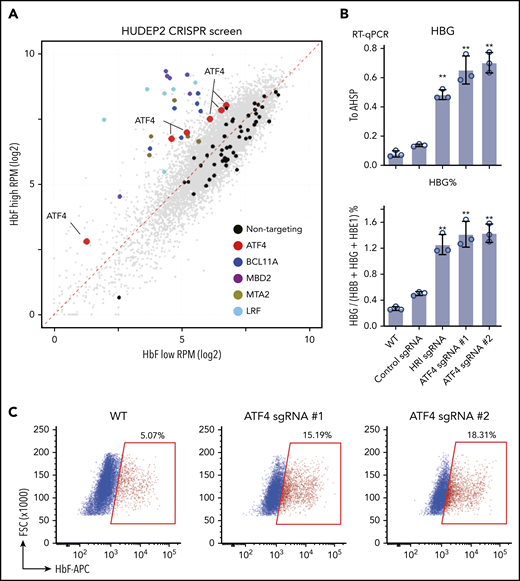
CRISPR screen identifies ATF4 as a novel γ-globin regulator. (A) Scatter plot of the transcription factor DNA binding domain–focused CRISPR screen results. Each dot represents an sgRNA. BCL11A, LRF, and NuRD components MBD2 and MTA are expected targets that validated the screen. (B) γ-globin mRNA measured by RT-qPCR relative to AHSP (top) and as percentage of total β-like globin transcripts (bottom). Control: nontargeting sgRNA. Results are shown as mean ± standard deviation (n = 3). (C) Representative flow cytometric analysis of cells stained with anti-HbF antibody. **P < .01 by Student t test. FSC, forward scatter; RPM, reads per million; RT-qPCR, quantitative reverse transcription polymerase chain reaction; WT, wild type.
CRISPR screen identifies ATF4 as a novel γ-globin regulator. (A) Scatter plot of the transcription factor DNA binding domain–focused CRISPR screen results. Each dot represents an sgRNA. BCL11A, LRF, and NuRD components MBD2 and MTA are expected targets that validated the screen. (B) γ-globin mRNA measured by RT-qPCR relative to AHSP (top) and as percentage of total β-like globin transcripts (bottom). Control: nontargeting sgRNA. Results are shown as mean ± standard deviation (n = 3). (C) Representative flow cytometric analysis of cells stained with anti-HbF antibody. **P < .01 by Student t test. FSC, forward scatter; RPM, reads per million; RT-qPCR, quantitative reverse transcription polymerase chain reaction; WT, wild type.
ATF4 links HRI to BCL11A and γ-globin production
Previously, we noticed that loss of HRI was accompanied by diminished BCL11A expression, but the mechanism remained unresolved.9 To examine whether ATF4 serves as a link between HRI and BCL11A, we measured BCL11A mRNA levels in primary cells partially depleted for ATF4 and detected a modest reduction in BCL11A mRNA levels, whereas levels of LRF, another major direct γ-globin repressor, remained unchanged (supplemental Figure 1A).
To further explore whether ATF4 might functionally link HRI to BCL11A, we depleted HRI in HUDEP2 via CRISPR-Cas9–facilitated gene editing. Both ATF4 and BCL11A protein levels were decreased upon HRI loss (Figure 2A). Similar experiments using CRISPR-Cas9 RNPs against HRI in primary human erythroid cells likewise led to reduced BCL11A levels and elevated γ-globin synthesis (supplemental Figure 2A). We note that the effects of CRISPR-Cas9 RNP-mediated HRI depletion were less pronounced than those observed with shRNA-facilitated HRI knockdown in our previous study.9 Why the use of shRNAs seems to amplify the effects of HRI depletion remains unclear, especially considering that diverse control nontargeting shRNAs or shRNAs against irrelevant targets do not influence HbF levels.
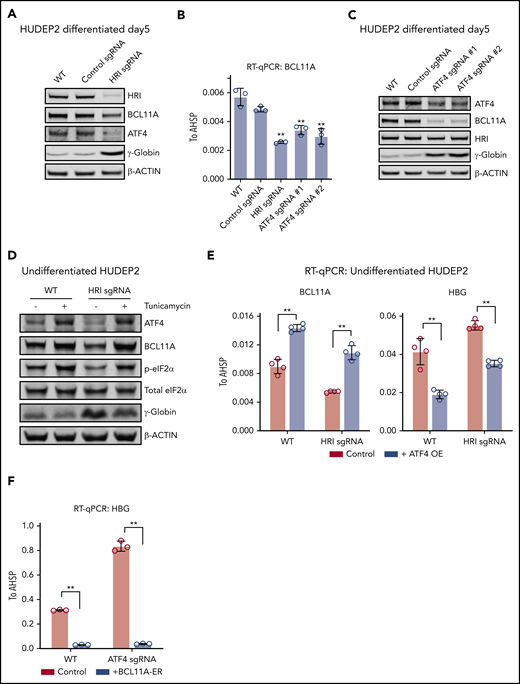
ATF4 links HRI to BCL11A and γ-globin production. (A) Immunoblot analysis of differentiated HUDEP2 after depletion of HRI. (B) BCL11A mRNA levels measured by quantitative reverse transcription polymerase chain reaction (RT-qPCR) in indicated cells. Results are shown as mean ± standard deviation (SD; n = 3). (C) Immunoblot analysis of HUDEP2 upon depletion of ATF4. (D) Immunoblot analysis of undifferentiated HUDEP2 cells treated with 2.5 μg/mL of tunicamycin for 3 days. (E) BCL11A and γ-globin mRNA levels measured by RT-qPCR in parental or ATF4 overexpressing (ATF4 OE) undifferentiated HUDEP2 cells. Results are shown as mean ± SD (n = 4). (F) γ-globin mRNA levels measured by RT-qPCR with overexpression of BCL11A-ER in differentiated HUDEP2 cells. Results are shown as mean ± SD (n = 3). **P < .01 by Student t test. WT, wild type.
ATF4 links HRI to BCL11A and γ-globin production. (A) Immunoblot analysis of differentiated HUDEP2 after depletion of HRI. (B) BCL11A mRNA levels measured by quantitative reverse transcription polymerase chain reaction (RT-qPCR) in indicated cells. Results are shown as mean ± standard deviation (SD; n = 3). (C) Immunoblot analysis of HUDEP2 upon depletion of ATF4. (D) Immunoblot analysis of undifferentiated HUDEP2 cells treated with 2.5 μg/mL of tunicamycin for 3 days. (E) BCL11A and γ-globin mRNA levels measured by RT-qPCR in parental or ATF4 overexpressing (ATF4 OE) undifferentiated HUDEP2 cells. Results are shown as mean ± SD (n = 4). (F) γ-globin mRNA levels measured by RT-qPCR with overexpression of BCL11A-ER in differentiated HUDEP2 cells. Results are shown as mean ± SD (n = 3). **P < .01 by Student t test. WT, wild type.
We next tested whether the reduction in ATF4 production in HRI-depleted cells accounted for the diminished BCL11A levels. To this end, we targeted ATF4 in HUDEP2 cells using CRISPR-Cas9 and indeed observed diminished BCL11A mRNA and protein levels (Figure 2B-C), suggesting that ATF4 directly or indirectly regulates BCL11A transcription.
If eIF2α phosphorylation by HRI is a critical step in the activation of ATF4 and BCL11A, increasing eIF2α phosphorylation is predicted to reverse the effects of HRI loss. We exposed HRI-deficient HUDEP2 cells to tunicamycin, which activates the eIF2α kinase PERK. As expected, this elevated phosphorylated eIF2α and ATF4 levels (Figure 2D). In addition, BCL11A production was increased, and γ-globin levels were reduced (Figure 2D). Although this result supports eIF2α signaling in ATF4 and BCL11A regulation, the interpretation of this experiment is somewhat limited by the pleiotropic effects of tunicamycin and toxicity of the drug.
We next overexpressed ATF4 in undifferentiated HUDEP2 cells and observed increased BCL11A and diminished γ-globin levels (Figure 2E). Furthermore, overexpression of ATF4 restored BCL11A and γ-globin levels in HRI-deficient HUDEP2 cells (Figure 2E), consistent with the notion that ATF4 is the critical component linking HRI signaling to BCL11A production. Note that the effect sizes were blunted because of the use of undifferentiated HUDEP2 cells (excess ATF4 was not well tolerated in differentiated cells). Finally, overexpression of an inducible form of BCL11A (BCL11A-ER) restored γ-globin silencing in ATF4-depleted HUDEP2 cells (Figures 2F; supplemental Figure 2B). Taken together, these results suggest that BCL11A is regulated by both HRI and ATF4, consistent with an HRI>phosphorylated eIF2α (p-eIF2α)>ATF4>BCL11A>γ-globin pathway.
ATF4 specifically binds to the BCL11A +55 enhancer
ATF4 might regulate BCL11A directly or indirectly, and it might also exert direct effects at the β-globin locus. To address these possibilities, we performed replicate anti-ATF4 ChIP-seq in HUDEP2 and primary erythroblasts (Figure 3A-B). Motif analysis using MEME-ChIP uncovered an ATF4 element as the most enriched motif under the peaks in all data sets (Figure 3A).26 Consistent with the role as a primary regulator of the integrated stress response, the genes closest to the ATF4 binding peaks were enriched in gene ontology terms related to stress response and apoptotic pathways (supplemental Figure 3A-B).27
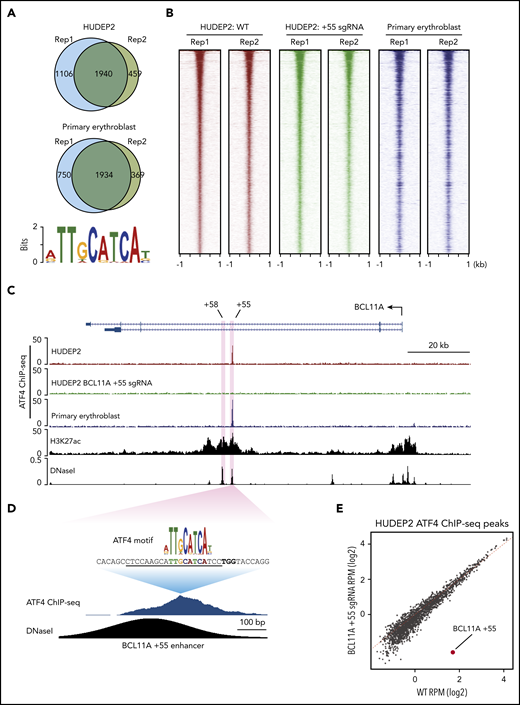
ATF4 specifically binds to the BCL11A +55 enhancer. (A) Venn diagrams of the ATF4 ChIP-seq peaks in HUDEP2 and primary erythroblasts and the most enriched ATF4 binding motif in primary erythroblasts. (B) Heat maps of high-confidence ATF4 peaks in HUDEP2, BCL11A +55 sgRNA-treated, and primary erythroblasts. (C) Representative ATF4 ChIP-seq track of the BCL11A locus. The erythroid-specific enhancers +55 and +58 are shaded in purple. H3K27ac and DNaseI were obtained from published data.41 (D) ATF4 ChIP binding profile at the BCL11A +55 enhancer. The sgRNA targeting the ATF4 consensus motif is underlined, and the PAM sequence is shown in bold. (E) Genome-wide coverage of high-confident ATF4 peaks in HUDEP2 wild-type (WT) and BCL11A +55 sgRNA-treated cells. The BCL11A +55 peak is highlighted in red. RPM, reads per million.
ATF4 specifically binds to the BCL11A +55 enhancer. (A) Venn diagrams of the ATF4 ChIP-seq peaks in HUDEP2 and primary erythroblasts and the most enriched ATF4 binding motif in primary erythroblasts. (B) Heat maps of high-confidence ATF4 peaks in HUDEP2, BCL11A +55 sgRNA-treated, and primary erythroblasts. (C) Representative ATF4 ChIP-seq track of the BCL11A locus. The erythroid-specific enhancers +55 and +58 are shaded in purple. H3K27ac and DNaseI were obtained from published data.41 (D) ATF4 ChIP binding profile at the BCL11A +55 enhancer. The sgRNA targeting the ATF4 consensus motif is underlined, and the PAM sequence is shown in bold. (E) Genome-wide coverage of high-confident ATF4 peaks in HUDEP2 wild-type (WT) and BCL11A +55 sgRNA-treated cells. The BCL11A +55 peak is highlighted in red. RPM, reads per million.
We did not observe significant enrichment of ATF4 binding or even any ATF4 consensus motifs at the γ-globin promoters (supplemental Figure 3C) and observed minimal signals across the entire β-globin locus, suggesting that ATF4 does not directly regulate the globin genes. However, in both HUDEP2 and primary erythroblasts, we detected a single peak at the BCL11A locus, specifically at the previously described +55 kb intronic enhancer (Figure 3C).28 Notably, this was the only ATF4 peak within the entire 2-Mb topologically associating domain encompassing the locus. Because topologically associating domains can constrain the functional range of enhancers, it is therefore likely that this element controls BCL11A but not other genes.
ATF4 regulates BCL11A through the +55 enhancer
To determine the function of ATF4 binding at the BCL11A +55 element, we disrupted it via CRISPR-Cas9–mediated KO in pooled HUDEP2 cells (Figure 3D; supplemental Figure 4A). Both ChIP-seq and ChIP–quantitative polymerase chain reaction verified specific and complete abrogation of ATF4 binding at the BCL11A +55 enhancer (Figure 3C-E; supplemental Figure 3D). As a consequence, BCL11A mRNA levels were reduced by ∼50% (Figure 4A; supplemental Figure 4B). Similar results were obtained when disrupting the ATF4 element in primary erythroblasts (editing efficiency of 80% based on TIDE analysis; Figure 4B; supplemental Figure 4A,C).29 Subsequently, both γ-globin mRNA levels and F-cell numbers were significantly elevated (Figure 4A-C; supplemental Figure 4B-E). In primary cells, the degree of BCL11A loss and γ-globin induction was comparable to that achieved with disruption of the GATA motif at the +58 enhancer. Finally, forced expression of BCL11A-ER restored γ-globin levels in pooled HUDEP2 cells with the ATF4 element disrupted (supplemental Figure 4G). Together, these results indicate that ATF4 regulates BCL11A transcription through binding at the BCL11A +55 enhancer in HUDEP2 and primary human erythroid cells.
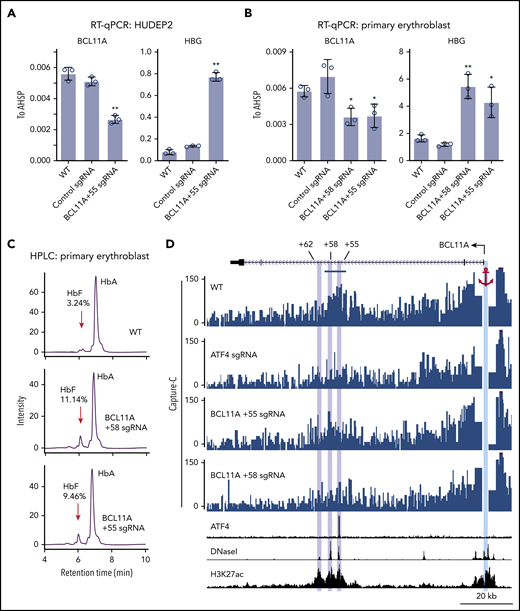
ATF4 regulates BCL11A through the +55 enhancer. (A) BCL11A mRNA (top) and γ-globin mRNA (bottom) levels measured by quantitative reverse transcription polymerase chain reaction (RT-qPCR) relative to AHSP mRNA in BCL11A +55 sgRNA-treated and control HUDEP2 cells. Results are shown as mean ± standard deviation (SD; n = 3). (B) BCL11A mRNA (top) and γ-globin mRNA (bottom) levels measured by RT-qPCR relative to AHSP mRNA in BCL11A +55 sgRNA-treated and control primary erythroid cells. An sgRNA against the +58 enhancer served as positive control. Results are shown as mean ± SD (n = 3). (C) Representative high-performance liquid chromatography (HPLC) analysis of Hb in primary erythroid cells. HbF peaks are indicated by red arrows, and HbF peak area is displayed as percentage of total HbF + HbA. (D) Capture-C using the BCL11A promoter as anchor. The erythroid specific enhancers +55, +58, and +62 are highlighted in purple, and the BCL11A promoter anchor in cyan. The segment used for quantification of reads is indicated by the blue bar (supplemental Figure 4G). H3K27ac and DNaseI were obtained from published data.41 *P < .05, **P < .01 by Student t test. WT, wild type.
ATF4 regulates BCL11A through the +55 enhancer. (A) BCL11A mRNA (top) and γ-globin mRNA (bottom) levels measured by quantitative reverse transcription polymerase chain reaction (RT-qPCR) relative to AHSP mRNA in BCL11A +55 sgRNA-treated and control HUDEP2 cells. Results are shown as mean ± standard deviation (SD; n = 3). (B) BCL11A mRNA (top) and γ-globin mRNA (bottom) levels measured by RT-qPCR relative to AHSP mRNA in BCL11A +55 sgRNA-treated and control primary erythroid cells. An sgRNA against the +58 enhancer served as positive control. Results are shown as mean ± SD (n = 3). (C) Representative high-performance liquid chromatography (HPLC) analysis of Hb in primary erythroid cells. HbF peaks are indicated by red arrows, and HbF peak area is displayed as percentage of total HbF + HbA. (D) Capture-C using the BCL11A promoter as anchor. The erythroid specific enhancers +55, +58, and +62 are highlighted in purple, and the BCL11A promoter anchor in cyan. The segment used for quantification of reads is indicated by the blue bar (supplemental Figure 4G). H3K27ac and DNaseI were obtained from published data.41 *P < .05, **P < .01 by Student t test. WT, wild type.
Regulatory elements can function over large genomic distances, and intronic enhancers can sometimes ignore the genes in which they are embedded and instead control genes farther away.30 Measurements of physical proximity can enable the assignment of enhancer targets. Therefore, we examined whether the BCL11A +55 enhancer is in physical proximity to the BCL11A promoter and whether this requires ATF4. We performed Capture-C using the BCL11A promoter as anchor.20 In nontargeted HUDEP2 cells, the BCL11A promoter strongly interacted with both the BCL11A +58 and +55 enhancers (Figure 4D). These interactions were reduced upon depletion of ATF4 or mutation of the ATF4 binding motif at the BCL11A +55 enhancer (Figure 4D; supplemental Figure 4H). These results suggest that ATF4 binding promotes enhancer-promoter contacts to enhance BCL11A transcription.
ATF4 regulates BCL11A in a species-selective manner
Our previous studies found that HRI promotes BCL11A expression in human erythroid cells, but not in primary cultured fetal liver murine erythroid cells, suggesting that this mechanism might be species selective.9 Given the general usefulness of mice as preclinical models in the study of globin gene regulation and the testing of therapeutic strategies, we decided to investigate this in whole animals and explore the underlying mechanism. HRI-null mice have previously been shown to be viable and fertile, with slightly increased red blood cell volume but otherwise normal red cell parameters.12,31 We generated HRI knockout mice by CRISPR-Cas9–based deletion and detected the same peripheral blood phenotype (supplemental Figure 5A). To test whether HRI depletion leads to Bcl11a loss and subsequent γ-globin induction in mice, we crossed HRI-null mice with Townes mice, an established sickle cell disease murine model in which animals carry the human α-globin and βS-globin transgenes.32 Phenotypic analysis of Townes βAβS mice indicated that loss of HRI did not significantly alter white blood cell, Hb, or platelet counts, whereas the mean corpuscular volume was slightly increased (Figure 5A), similar to parental HRI-null mice (supplemental Figure 5A). Transcriptional analysis of CD71+Ter119+ stage-matched erythroid cells from Townes βAβS bone marrow indicated that, despite complete loss of HRI, Bcl11a levels were not significantly reduced, and human γ-globin transgene transcription remained unchanged (Figure 5B; supplemental Figure 5B). These results confirm that HRI regulates BCL11A in a species-selective manner.
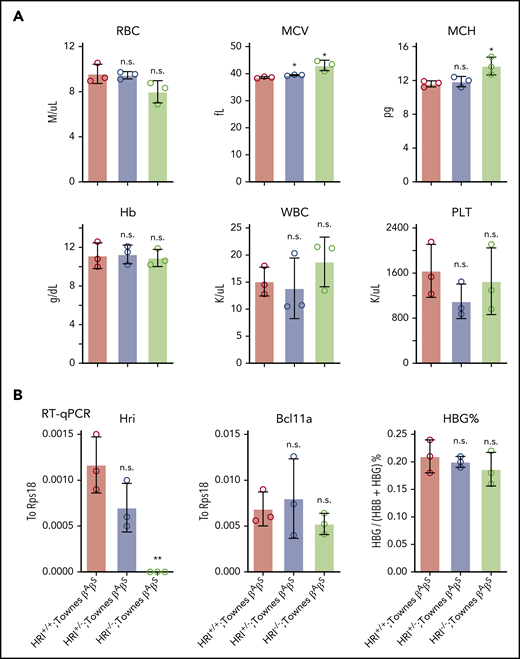
Bcl11a and human γ-globin transgene levels remain unchanged in HRI knockout Townes mice. (A) Complete blood cell count of HRI+/+, HRI+/−, and HRI−/− Townes βAβS mice. Results are shown as mean ± standard deviation (SD; n = 3). (B) HRI (left), Bcl11a (middle), and γ-globin (right) mRNA levels as measured by quantitative reverse transcription polymerase chain reaction (RT-qPCR) of sorted CD71+Ter119+ bone marrow cells in HRI+/+, HRI+/−, and HRI−/− Townes βAβS mice. HRI and Bcl11a are displayed as absolute values normalized to RPS18, whereas γ-globin is displayed as percentage of total β-like globin transcripts. Results are shown as mean ± SD (n = 3). *P < .05, **P < .01 by Student t test. MCV, mean corpuscular volume; MCH, mean corpuscular hemoglobin; n.s., not significant; PLT, platelet count; WBC, white blood cell count.
Bcl11a and human γ-globin transgene levels remain unchanged in HRI knockout Townes mice. (A) Complete blood cell count of HRI+/+, HRI+/−, and HRI−/− Townes βAβS mice. Results are shown as mean ± standard deviation (SD; n = 3). (B) HRI (left), Bcl11a (middle), and γ-globin (right) mRNA levels as measured by quantitative reverse transcription polymerase chain reaction (RT-qPCR) of sorted CD71+Ter119+ bone marrow cells in HRI+/+, HRI+/−, and HRI−/− Townes βAβS mice. HRI and Bcl11a are displayed as absolute values normalized to RPS18, whereas γ-globin is displayed as percentage of total β-like globin transcripts. Results are shown as mean ± SD (n = 3). *P < .05, **P < .01 by Student t test. MCV, mean corpuscular volume; MCH, mean corpuscular hemoglobin; n.s., not significant; PLT, platelet count; WBC, white blood cell count.
To determine the mechanism underlying the species-specific regulation of BCL11A, we performed ATF4 ChIP-seq in the mouse erythroid cell line G1E-ER4 (Figure 6A). Murine ATF4 specifically bound to a region analogous to the human BCL11A +55 enhancer (Figure 6B-C). Importantly, destruction of the ATF4 element completely abrogated ATF4 binding at the murine Bcl11a +55 enhancer but only slightly reduced Bcl11a transcription, reminiscent of the minimal effect of HRI knockout on Bcl11a transcription in murine cells (Figures 6D; supplemental Figure 6A-B). Accordingly, the mouse embryonic Hbb-bh1 gene, a Bcl11a target, remained unaffected (Figure 6D). As a positive control, knockout of Bcl11a using an sgRNA-targeting Bcl11a exon 2 strongly reactivated Hbb-bh1 expression as expected (Figure 6D). In agreement with our findings, analysis of published CRISPR tilling screens across BCL11A regulatory regions revealed that sgRNAs predicted to target the ATF4 element at the BCL11A +55 enhancer scored in human cells (as assessed by fetal globin expression) but not murine cells (as assessed by embryonic globin expression; supplemental Figure 6C).33 Together, these results suggest that the divergent function of ATF4 binding at the BCL11A +55 enhancer leads to species-selective regulation of BCL11A.
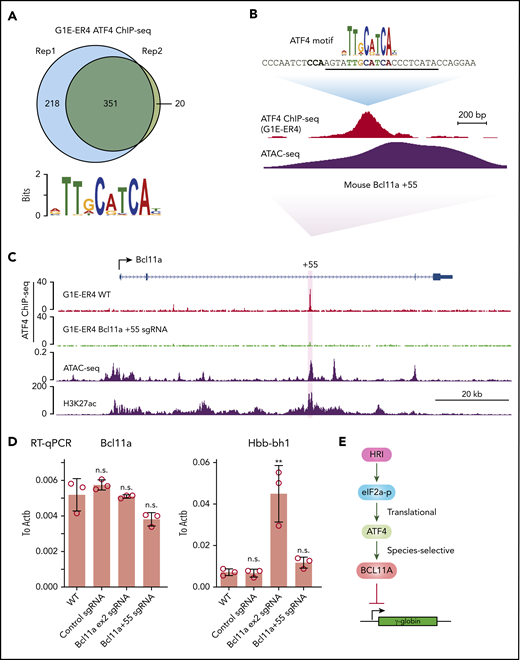
ATF4 regulates BCL11A in a species-selective manner. (A) Venn diagrams of the ATF4 ChIP-seq peaks in G1E-ER4 cells and the most enriched ATF4 binding motif. (B) ATF4 binding profile at mouse Bcl11a +55 enhancer. The sgRNA targeting the mouse ATF4 consensus motif is underlined, and the PAM sequence is shown in bold. (C) Representative ATF4 ChIP-seq track of the murine Bcl11a locus. The region orthologous to the human BCL11A +55 enhancer is highlighted in purple. ATAC-seq was obtained from ENCODE (ENCSR428BSK), and H3K27ac was obtained from published data.42 (D) Bcl11a (left) and Hbb-bh1 (right) mRNA levels in indicated cells. Note: the loss of function of Bcl11a by the sgRNA targeting exon 2 did not diminish transcript levels but depleted Bcl11a protein levels. Results are shown as mean ± standard deviation (n = 3). (E) Model depicting HRI and ATF4 regulation of BCL11A and γ-globin levels. **P < .01 by Student t test. n.s., not significant.
ATF4 regulates BCL11A in a species-selective manner. (A) Venn diagrams of the ATF4 ChIP-seq peaks in G1E-ER4 cells and the most enriched ATF4 binding motif. (B) ATF4 binding profile at mouse Bcl11a +55 enhancer. The sgRNA targeting the mouse ATF4 consensus motif is underlined, and the PAM sequence is shown in bold. (C) Representative ATF4 ChIP-seq track of the murine Bcl11a locus. The region orthologous to the human BCL11A +55 enhancer is highlighted in purple. ATAC-seq was obtained from ENCODE (ENCSR428BSK), and H3K27ac was obtained from published data.42 (D) Bcl11a (left) and Hbb-bh1 (right) mRNA levels in indicated cells. Note: the loss of function of Bcl11a by the sgRNA targeting exon 2 did not diminish transcript levels but depleted Bcl11a protein levels. Results are shown as mean ± standard deviation (n = 3). (E) Model depicting HRI and ATF4 regulation of BCL11A and γ-globin levels. **P < .01 by Student t test. n.s., not significant.
Discussion
Using a domain-focused CRISPR screen, we identified ATF4 as a novel regulator of γ-globin through direct transcriptional control of BCL11A. Depletion of ATF4 or removal of the ATF4 element within the BCL11A +55 enhancer reduced BCL11A transcription. Removal of the corresponding ATF4 binding element at Bcl11a +55 enhancer in murine cells lowered Bcl11a levels only very modestly and insufficiently to reactivate BCL11A-controlled murine embryonic globin genes. Hence, the dependence of BCL11A transcription on binding of ATF4 to the BCL11A +55 enhancer varies between species. Together, these data delineate a linear HRI>ATF4>BCL11A>γ-globin pathway with a species-selective component at the ATF4-BCL11A juncture (Figure 6E).
The BCL11A +58 enhancer is a validated target for therapeutic genome editing.7,8 Our data show that disruption of the ATF4 element at the BCL11A +55 enhancer has an effect size not dissimilar to that of perturbation of the BCL11A +58 enhancer in primary erythroblasts. This suggests that the BCL11A +55 enhancer could serve as an additional target for therapeutic genome editing.
ATF4 is expressed in a wide range of tissues and plays roles in diverse biological processes. Atf4-null mice are severely anemic at the fetal stage, which is explained by the essential role of ATF4 in the proliferation and expansion of hematopoietic progenitors in the murine fetal liver.25,34 CRISPR-Cas9–based depletion of Atf4 in murine G1E-ER4 cells or primary human erythroblasts also impaired cell viability (data not shown). Moreover, overexpression of ATF4 in HUDEP2 cells led to cell proliferation defects, suggesting that proper ATF4 levels are critical for maintaining erythroid homeostasis. It is worth mentioning that Atf4-null murine embryos displayed elevated levels of embryonic globins. However, this increase was due to persistent primitive erythroid cells and not reactivation of the genes in definitive erythroid cells.25
Our results suggest that ATF4 promotes BCL11A transcription to contribute to the repression of the γ-globin genes. ATF4 is a critical component of the stress signaling pathways downstream of HRI and related stress-activated protein kinases. Tunicamycin-induced ER stress, which signals through PERK and augments ATF4 production, lowered γ-globin levels in HUDEP2 cells (Figure 2D). These results pose somewhat of a conundrum, because a variety of erythropoietic stress conditions, including exposure to in vitro culture (both human and murine cells culture systems), are associated with elevated HbF levels.35 Furthermore, it has been suggested that salubrinal-induced p-eIF2α can enhance translation of γ-globin mRNA.36,37 In contrast, our study revealed that diminished p-eIF2α is accompanied by reduced ATF4 and BCL11A levels, along with elevated γ-globin transcription. This suggests that net γ-globin production is balanced by transcriptional and posttranscriptional mechanisms. To add to the complexities of stress signaling, a recent study described a reduction of ATF4 levels in response erythroid stress as a consequence of diminished β-globin expression. This in turn lowered BCL11A and increased γ-globin transcription.38 In that study, ATF4 binding at BCL11A was not detected, and the mechanism of BCL11A reduction remained unclear. Our study strongly suggests that ATF4 directly regulates BCL11A transcription by binding to the BCL11A +55 enhancer, raising the possibility that diverse stress conditions that elevate ATF4 may converge on the same pathway.
Despite the conservation of ATF4 binding at the BCL11A +55 enhancer, HRI knockout mice bearing a humanized γ-globin locus had normal levels of Bcl11a, γ-globin, and endogenous embryonic globins, indicating that the HRI-ATF4-BCL11A pathway is not conserved in mice. The species-selective activity of ATF4 binding is in line with previously published CRISPR tilling screens, in which 2 sgRNAs targeting the ATF4 binding motif were both enriched for HbF in human cells, whereas 2 sgRNAs targeting the ATF4 motif were inconsequential in murine cells (supplemental Figure 6C).33 It is unclear why ATF4 binding at the BCL11A locus has divergent functions in humans and mice, but it is known that enhancer elements and transcription factor binding sites do not always act similarly across species.39,40 Moreover, we cannot rule out that differences between murine and human culture systems influence the outcome of ATF4 depletion or elimination of the ATF4 element in the BCL11A enhancer.
In summary, our study uncovers a major regulatory signaling pathway that extends linearly from HRI to ATF4 to BCL11A to γ-globin (Figure 6D). This species-selective enhancer function is relevant when considering mouse models, such as the Townes or BERK mouse models, for the preclinical testing of γ-globin inducers. Our findings suggest that lack of a phenotypic effect in mice should not discourage clinical advancement of therapeutic approaches with promising results in human cell systems.
The ChIP-seq and Capture-C data have been deposited into the GEO database (GSE143963).
The online version of this article contains a data supplement.
The publication costs of this article were defrayed in part by page charge payment. Therefore, and solely to indicate this fact, this article is hereby marked “advertisement” in accordance with 18 USC section 1734.
Acknowledgments
The authors thank laboratory members for helpful discussions; the University of Pennsylvania Transgenic and Chimeric Mouse Facility, especially Jorge Henao-Mejia and Jean Richa for assistance with generating HRI knockout mice; the Children’s Hospital of Philadelphia Flow Cytometry Core for help with cell sorting; R. Kurita and Y. Nakamura for contributing the HUDEP2 cells; and the DiGaetano family for their very generous support.
This work was supported by National Institutes of Health (NIH) grants from the National Heart, Lung, and Blood Institute (HL119479) and the National Institute of Diabetes and Digestive and Kidney Diseases (DK054937), and research funding from Pfizer (G.A.B.); NIH grants from the National Institute of Diabetes and Digestive and Kidney Diseases (R56DK065806) and the National Human Genome Research Institute (U54HG006998) (R.C.H.); a fellowship by the Cooley’s Anemia Foundation (X.L.); an American Society of Hematology Research Training Award for Fellows (E.K.); the St Jude Children’s Research Hospital Collaborative Research Consortium; and the DiGaetano family.
Authorship
Contribution: P.H. and G.A.B. conceived the study and designed experiments; P.H., S.A.P., X.L., E.K., J.A.Y., M.S., C.A.K., B.G., K.Q., O.A., and J.S. performed experiments; P.H., S.A.P., X.L., E.K., C.A.K., B.G., R.C.H., and G.A.B. analyzed data; and P.H., S.A.P., and G.A.B. wrote the manuscript with input from the other authors.
Conflict-of-interest disclosure: The authors declare no competing financial interests.
Correspondence: Junwei Shi, Perelman School of Medicine, University of Pennsylvania, 421 Curie Blvd, Philadelphia, PA 19104; e-mail: jushi@upenn.edu; and Gerd A. Blobel, Children’s Hospital of Philadelphia, 3615 Civic Center Blvd, Philadelphia, PA 19104; e-mail: blobel@email.chop.edu.

This feature is available to Subscribers Only
Sign In or Create an Account Close Modal