

Key Points
CD19 CAR T cells with concurrent ibrutinib for R/R CLL were well tolerated, with low CRS severity and high response rates by iwCLL criteria.
The 1-year PFS probabilities were 38% and 50% after CD19 CAR T cells, with or without concurrent ibrutinib, respectively (P = .91).

Abstract
We previously reported durable responses in relapsed or refractory (R/R) chronic lymphocytic leukemia (CLL) patients treated with CD19-targeted chimeric antigen receptor-engineered (CD19 CAR) T-cell immunotherapy after ibrutinib failure. Because preclinical studies showed that ibrutinib could improve CAR T cell-antitumor efficacy and reduce cytokine release syndrome (CRS), we conducted a pilot study to evaluate the safety and feasibility of administering ibrutinib concurrently with CD19 CAR T-cell immunotherapy. Nineteen CLL patients were included. The median number of prior therapies was 5, and 17 patients (89%) had high-risk cytogenetics (17p deletion and/or complex karyotype). Ibrutinib was scheduled to begin ≥2 weeks before leukapheresis and continue for ≥3 months after CAR T-cell infusion. CD19 CAR T-cell therapy with concurrent ibrutinib was well tolerated; 13 patients (68%) received ibrutinib as planned without dose reduction. The 4-week overall response rate using 2018 International Workshop on CLL (iwCLL) criteria was 83%, and 61% achieved a minimal residual disease (MRD)-negative marrow response by IGH sequencing. In this subset, the 1-year overall survival and progression-free survival (PFS) probabilities were 86% and 59%, respectively. Compared with CLL patients treated with CAR T cells without ibrutinib, CAR T cells with concurrent ibrutinib were associated with lower CRS severity and lower serum concentrations of CRS-associated cytokines, despite equivalent in vivo CAR T-cell expansion. The 1-year PFS probabilities in all evaluable patients were 38% and 50% after CD19 CAR T-cell therapy, with and without concurrent ibrutinib, respectively (P = .91). CD19 CAR T cells with concurrent ibrutinib for R/R CLL were well tolerated, with low CRS severity, and led to high rates of MRD-negative response by IGH sequencing.
Introduction
Lymphodepletion chemotherapy, followed by infusion of autologous T cells engineered to express a CD19-targeted chimeric antigen receptor (CD19 CAR T cells), can lead to high response rates in relapsed or refractory (R/R) B-cell malignancies.1-4 Chronic lymphocytic leukemia (CLL) is the most prevalent lymphoid malignancy in the United States5 and usually follows an indolent course; however, patients with high-risk cytogenetic abnormalities have a poor prognosis.6 Targeted agents, such as ibrutinib7,8 and venetoclax,9,10 have markedly improved the prognosis of patients with high-risk CLL, but responses induced by these targeted agents remain impacted by high-risk features, such as fludarabine (Flu) refractoriness,11 the number of prior therapies,7,8 the presence of bulky adenopathies,11,12 and complex cytogenetics.6,11 We previously demonstrated that CD19 CAR T-cell immunotherapy could provide durable responses in high-risk patients with R/R CLL who had failed ibrutinib therapy.13-15 In that study, ibrutinib was discontinued prior to lymphodepletion chemotherapy; however, there are potential advantages to continuing ibrutinib through leukapheresis, lymphodepletion, and CAR T-cell immunotherapy. Continuation of ibrutinib could abrogate rapid disease progression that can be seen after ibrutinib withdrawal,16 and it might mobilize CLL cells from lymph nodes into blood or marrow,17-19 sites that were more responsive to CD19 CAR T cells.13 Furthermore, preclinical studies suggest advantages of combination therapy: ibrutinib improved T-cell numbers and function in CLL patients,20 was associated with better CAR T-cell proliferation and antitumor efficacy in mice treated with human CD19 CAR T cells,21 and appeared to attenuate cytokine release syndrome (CRS).22 Administration of ibrutinib with Flu and cyclophosphamide (Cy) is safe23 ; however, the safety and feasibility of concurrent ibrutinib administration through leukapheresis, lymphodepletion, and CD19 CAR T-cell immunotherapy have not been established.
Patients and methods
Study design and patient selection
We treated patients with B-cell malignancies on a phase 1/2 clinical trial of CD19 CAR T-cell immunotherapy (NCT01865617). Inclusion and exclusion criteria are available in supplemental Material (available on the Blood Web site). Patients were eligible if they had failed an anti-CD20 antibody and Flu or bendamustine or were ineligible for these therapies. Patients for whom ibrutinib was standard first-line therapy must have progressed on or not responded to ibrutinib. Nineteen patients with R/R CLL were treated in a pilot cohort of this trial with concurrent ibrutinib and CD19 CAR T cells (Con-ibr cohort). The objective was to evaluate the feasibility and safety of the administration of ibrutinib before, during, and after CD19 CAR T-cell immunotherapy. The study was conducted with informed consent and approval of the Fred Hutchinson Cancer Research Center Institutional Review Board.
Treatment regimen for the Con-ibr cohort
Autologous CD4+ and bulk CD8+ T cells were immunomagnetically selected and then modified with a lentivirus encoding a chimeric antigen receptor containing a CD19-specific scFv, immunoglobulin G4 hinge, CD28 transmembrane domain, and 4-1BB and CD3z signaling domains. The chimeric antigen receptor was separated by a ribosomal skip sequence from a truncated human epidermal growth factor receptor, which enabled CAR T-cell enumeration by flow cytometry and formulation of a 1:1 CD4+/CD8+ CAR T-cell ratio for infusion, as previously described.1,2 All patients underwent lymphodepletion with Cy (300 mg/m2 per day) and Flu (30 mg/m2 per day) for 3 days, followed by the infusion of 2 × 10⁶ CD19 CAR T cells per kilogram. Patients were scheduled to receive ibrutinib 420 mg per day beginning ≥2 weeks prior to leukapheresis and continuing until ≥3 months after CD19 CAR T-cell infusion. Dose reduction was permitted for toxicity.
Patient selection and treatment regimen in the No-ibr cohort
Thirty R/R CLL patients were previously treated with CAR T cells without ibrutinib on the same phase 1/2 clinical trial as the Con-ibr cohort (NCT01865617) (supplemental Figure 1). For some analyses, we compared the characteristics and outcomes of patients treated in the Con-ibr cohort with patients who received CD19 CAR T-cell immunotherapy without concurrent ibrutinib (No-ibr cohort; n = 19). To limit differences in patient and treatment characteristics between the cohorts, we only included patients in the No-ibr cohort who received Cy/Flu lymphodepletion and 2 × 10⁶ CAR T cells per kilogram. Patients with Richter’s transformation without coexisting CLL were excluded (n = 2).
Clinical response and toxicity assessment
Patients with measurable nodal disease underwent a whole-body computed tomography (CT) scan before and 4 weeks after CAR T-cell administration. Responses were evaluated according to the 2018 International Workshop on CLL (iwCLL) criteria.24 Marrow biopsies were obtained before lymphodepletion and 4 weeks after CAR T-cell infusion. Minimal residual disease (MRD) in the marrow was assessed 4 weeks after CAR T-cell infusion using multiparameter flow cytometry (sensitivity, 10−4)25,26 and IGH sequencing (sensitivity, 10−6; clonoSEQ; Adaptive Biotechnologies, Seattle, WA).26 CRS was graded per protocol, according to 2014 Lee et al consensus criteria.27 Treatment with tocilizumab and dexamethasone was recommended for patients developing grade ≥3 CRS or grade 2 CRS with progressive signs. Other toxicities, including neurologic toxicity, were graded using the National Cancer Institute Common Toxicity Criteria for Adverse Events (version 4.03). Toxicity rates were evaluated in all infused patients.
CAR T-cell enumeration and cytokine analysis
CAR T-cell enumeration was assessed by flow cytometry, and quantitative polymerase chain reaction and serum cytokine concentrations were evaluated by Luminex assay (Luminex Corporation, Austin, TX), as previously described.1,2
Statistical analyses
Comparisons of continuous variables between 2 categories were made using the Wilcoxon rank-sum test, and comparisons of categorical variables between 2 categories were made using the Fisher’s exact test. When comparing concentrations of cytokines, T-cell phenotypes in the peripheral blood prior to leukapheresis, and CAR T-cell product characteristics, P values (Wilcoxon rank-sum test) were adjusted for multiple comparisons using the Benjamini-Hochberg procedure.28 All P values are 2-sided. For time-to-event analyses, the Kaplan-Meier method was used to estimate survival distributions, and the reverse Kaplan-Meier estimator method was used to estimate median follow-up time, as described29 ; log-rank tests were used to compare between-group differences in Kaplan-Meier survival curves. Multivariable proportional odds ordinal logistic regression was performed to predict the grade of CRS. The ordinality assumption was assessed for each predictor using the plot.xmean.ordinaly function in R (rms package). All statistical analyses were performed using RStudio software (version 1.1.456, RStudio, Boston, MA) and the following packages: openxlsx, ggplot2, ggpubr, scales, survminer, knitr, dplyr, tidyr, rms, tableone, and rlang.
Results
Patient characteristics and prior therapies
Nineteen patients (median age, 65 years) received ibrutinib concurrently with lymphodepletion and CD19 CAR T-cell infusion (Con-ibr cohort; Table 1). Eighteen patients received 1 CAR T-cell infusion; only 1 patient received a second CAR T-cell infusion for persistent disease 50 days after the first infusion. No manufacturing failures were reported, and all patients enrolled on this pilot study received CAR T cells. Prior to lymphodepletion, all patients had high-risk disease, including 17 patients (89%) with high-risk cytogenetics. All patients had measurable marrow disease by flow cytometry (median, 26%), and all but 1 patient had measurable marrow disease by immunohistochemistry (median percentage of CLL cells, 35%). Seventeen patients (89%) had fluorodeoxyglucose-avid disease (median maximum standardized uptake value, 4.4). Four patients had a history of Richter’s transformation prior to CAR T-cell therapy (supplemental Table 1). The median number of prior therapies was 5 (range, 1-10). All patients had failed ibrutinib (progressive disease [PD], n = 18; stable disease [SD], n = 1) prior to study entry. Twelve patients (63%) were still receiving ibrutinib at study enrollment (median time on ibrutinib before leukapheresis, 726 days; supplemental Figure 2A), of whom 2 had received ibrutinib or an ibrutinib-based combination as first-line therapy (PD on ibrutinib in both cases). The 7 patients (37%) who had previously ceased ibrutinib because of PD recommenced it before leukapheresis (median time on ibrutinib before leukapheresis, 24 days; supplemental Figure 2B). Mutations in BTK (C481S in all cases) were reported in 2 patients (11%), whereas no BTK mutation was detected in 3 patients (16%), prior to study entry. The mutational status of BTK was unknown in 14 patients (74%).
Characteristics of patients receiving CD19 CAR T-cell immunotherapy with concurrent ibrutinib (N = 19)
| Characteristic | Data |
|---|---|
| Age, y | |
| Median, IQR | 65 (56-69) |
| Range | 40-71 |
| Sex | |
| Female | 7 (37) |
| Male | 12 (63) |
| ECOG score | |
| 0 | 10 (53) |
| 1 | 9 (47) |
| History of Richter’s transformation | 4 (21) |
| High-risk cytogenetics* | 17 (89) |
| 17p deletion | 14 (74) |
| Complex karyotype† | 14 (74) |
| Cross-sectional tumor area, mm2‡ | |
| Median (IQR) | 1538 (840-3958) |
| Range | 0-9097 |
| Bulky disease (largest node ≥ 5 cm) | 4 (21) |
| Maximum SUV | |
| Median (IQR) | 4.4 (3.4-7.0) |
| Range | 0.0-24.0 |
| Serum LDH concentration (U/L) | |
| Median (IQR) | 155 (135-206) |
| Range | 90-387 |
| Absolute lymphocyte count – blood (109cells/L) | |
| Median (IQR) | 1.12 (0.84-3.95) |
| Range | 0.20-59.00 |
| Absolute CLL cell count – blood (109cells/L) | |
| Median (IQR) | 0.45 (0.13-3.13) |
| Range | 0.01-54.00 |
| Marrow CLL burden | |
| Immunohistochemistry (bone marrow biopsy, % cellularity) | |
| Median (IQR) | 35 (9-70) |
| Range | 0-90 |
| Flow cytometry (bone marrow aspirate, % of leukocytes) | |
| Median (IQR) | 26 (12-60) |
| Range | 2-90 |
| Prior therapies | |
| Median (IQR) | 5 (4-7) |
| Range | 1-10 |
| Prior allogeneic stem cell transplantation | 3 (16) |
| Prior intolerance to ibrutinib | 2 (10) |
| Duration of last treatment with ibrutinib, d§ | |
| Median (IQR) | 105 (26-741) |
| Range | 14-2185 |
| Prior idelalisib treatment | 4 (21) |
| Prior venetoclax treatment | 11 (58)¶ |
Unless otherwise noted, data are n (%). All variables were assessed prior to lymphodepletion chemotherapy, unless specified.
ECOG, Eastern Cooperative Oncology Group; IQR, interquartile range; LDH, lactate dehydrogenase; SUV, standardized uptake value.
Defined as 17p deletion and/or complex karyotype.
Defined as ≥3 chromosomal abnormalities.
In patients with evaluable nodal disease (n = 16); sum of the product of the diameters of up to 6 of the largest lymph nodes or masses evaluated on the prelymphodepletion CT scan.
Duration of the last continuous ibrutinib therapy before leukapheresis.
Six of 11 patients had progressed on venetoclax.
Durable responses in patients treated with CD19 CAR T cells and concurrent ibrutinib
After exclusion of a patient who died 4 days after infusion from a presumed ibrutinib-related cardiac arrhythmia during grade 2 CRS, 18 of 19 patients were evaluable for response 4 weeks after CAR T-cell infusion (Table 2; supplemental Table 2). Fifteen patients (83%) responded according to iwCLL criteria (complete remission with incomplete hematologic recovery [CRi], n = 4, 22%; partial response [PR], n = 11, 61%). Concurrent ibrutinib and CAR T-cell immunotherapy resulted in MRD-negative marrow responses by flow cytometry in 13 of 18 patients (72%) and by IGH sequencing in 11 of 18 patients (61%). Ten of 14 patients (71%) with lymph node disease responded (complete response [CR], 1/14; PR, 9/14; supplemental Table 2). Persistent nodal disease (PR, SD, or PD by iwCLL CT criteria) at 4 weeks was observed in 13 of 14 patients (93%) with lymph node disease. CAR T-cell expansion in blood was associated with antitumor efficacy and was higher in responding patients by iwCLL criteria (P = .009; Figure 1A) and in patients achieving MRD-negative marrow response by flow cytometry (P = .038; Figure 1B).
Comparison of response and toxicity between the Con-ibr and No-ibr cohorts
| Con-ibr cohort | No-ibr cohort | P* | |
|---|---|---|---|
| Response at 4 wk | |||
| iwCLL 2018, CR/CRi/PR† | 15/18 (83) | 10/18 (56) | .15 |
| iwCLL 2018 CT response, CR/PR‡ | 10/14 (71) | 9/17 (53) | .46 |
| Marrow CR by flow cytometry | 13/18 (72) | 12/18 (67) | 1 |
| Marrow CR by IGH sequencing§ | 11/13 (85) | 6/10 (60) | .34 |
| Toxicity | |||
| CRS grade | |||
| Median (range) | 1 (0-2) | 2 (0-5) | .04 |
| Any grade CRS | 14/19 (74) | 18/19 (95) | .49 |
| Grade ≥3 CRS | 0/19 (0) | 2/19 (11) | .18 |
| Neurotoxicity grade | |||
| Median (range) | 0 (0-3) | 0 (0-5) | .33 |
| Any grade neurotoxicity | 5/19 (26) | 8/19 (42) | .49 |
| Grade ≥3 neurotoxicity | 5/19 (26) | 7/19 (37) | .73 |
| Grade 5 (fatal) events | Presumed ibrutinib-related cardiac arrhythmia (n = 1) | CRS and neurotoxicity (n =1) | Not applicable |
Unless otherwise noted, data are n/N (%).
Two-sided P values calculated using the Fisher’s exact test.
Two patients were not evaluable for response (early death before first disease restaging).
In patients with measurable nodal disease by CT.
In patients with no detectable disease by flow cytometry and with a trackable clone.
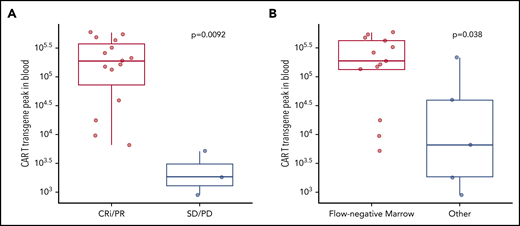
Responses to CD19 CAR T cells with concurrent ibrutinib were associated with better in vivo expansion of CAR T cells. CAR T-cell transgene peak in blood was measured by quantitative polymerase chain reaction (FLAP-EF1α copies per microgram of genomic DNA in blood) according to response by the 2018 iwCLL criteria (A) and marrow response by flow cytometry (sensitivity 10−4) (B). Bold horizontal lines represent the median, the box represents the interquartile range (IQR), and the vertical lines represent quartiles ± 1.5 × IQR. Data are from patients evaluable for response (n = 18). The P values were calculated using the Wilcoxon rank-sum test (2-sided).
Responses to CD19 CAR T cells with concurrent ibrutinib were associated with better in vivo expansion of CAR T cells. CAR T-cell transgene peak in blood was measured by quantitative polymerase chain reaction (FLAP-EF1α copies per microgram of genomic DNA in blood) according to response by the 2018 iwCLL criteria (A) and marrow response by flow cytometry (sensitivity 10−4) (B). Bold horizontal lines represent the median, the box represents the interquartile range (IQR), and the vertical lines represent quartiles ± 1.5 × IQR. Data are from patients evaluable for response (n = 18). The P values were calculated using the Wilcoxon rank-sum test (2-sided).
Responding patients had superior long-term outcomes compared with nonresponding patients, after a median follow-up of 12 months (range, 4-17 months; Figure 2A-B). The 1-year probabilities of overall survival (OS) and progression-free survival (PFS) in 18 evaluable patients were 64% (95% confidence interval [CI], 42-98) and 38% (95% CI, 19-78), respectively. The 1-year OS probabilities in CRi, PR, and SD/PD patients by iwCLL criteria were 100% (no event; 95% CI not evaluable), 58% (95% CI; 30-100), and 33% (95% CI, 6-100), respectively (P = .006). The 1-year PFS probabilities in CRi and PR patients were 67% (95% CI, 30-100) and 38% (95% CI, 14-100), respectively (P < .0001). In patients who achieved MRD-negative marrow response by flow cytometry (n = 13), the 1-year probabilities of OS and PFS were 79% (95% CI, 56-100) and 55% (95% CI, 29-100), respectively. The depth of marrow response was associated with OS and PFS; among patients without evidence of disease in the marrow by flow cytometry after CD19 CAR T-cell immunotherapy (n = 13), those who achieved an MRD-negative marrow response by IGH sequencing (n = 11) had superior OS and PFS (Figure 2C-D). The 1-year OS and PFS probabilities in patients without detectable disease in marrow by IGH sequencing were 86% (95% CI, 63-100) and 59% (95% CI, 32-100), respectively. In this group, the only relapses occurred at 10.2 and 12 months after infusion, and 1 on-going responder died of a myocardial infarction 12 months after CAR T-cell infusion.
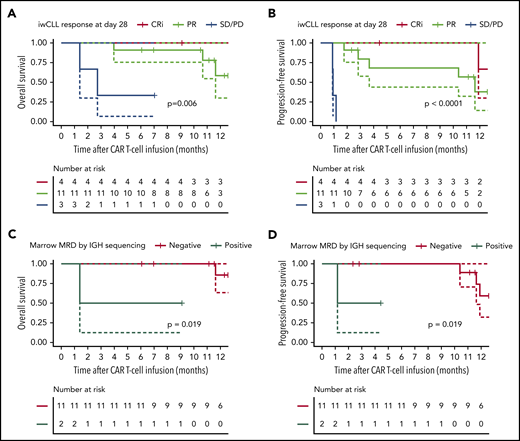
OS and PFS probabilities after CD19 CAR T-cell immunotherapy with concurrent ibrutinib. OS and PFS probabilities in CLL patients according to response by the 2018 iwCLL criteria (A-B) and marrow response by IGH sequencing (sensitivity 10−6) (C-D). Data are from patients evaluable for response (n = 18). (C-D) Data from patients who achieved MRD-negative marrow response by flow cytometry (n = 13), categorized according to the presence (n = 2) or absence (n = 11) of the residual malignant clone in the marrow by IGH sequencing. The solid lines represent the Kaplan-Meier estimates; the dashed lines represent 95% CIs. The P values were calculated using the log-rank test.
OS and PFS probabilities after CD19 CAR T-cell immunotherapy with concurrent ibrutinib. OS and PFS probabilities in CLL patients according to response by the 2018 iwCLL criteria (A-B) and marrow response by IGH sequencing (sensitivity 10−6) (C-D). Data are from patients evaluable for response (n = 18). (C-D) Data from patients who achieved MRD-negative marrow response by flow cytometry (n = 13), categorized according to the presence (n = 2) or absence (n = 11) of the residual malignant clone in the marrow by IGH sequencing. The solid lines represent the Kaplan-Meier estimates; the dashed lines represent 95% CIs. The P values were calculated using the log-rank test.
Adverse events after CD19 CAR T-cell immunotherapy with concurrent ibrutinib
CD19 CAR T-cell immunotherapy with concurrent ibrutinib was feasible in most patients; however, ibrutinib dose reduction or discontinuation was required for 6 patients (32%), and 1 other patient died from probable ibrutinib-associated cardiac arrhythmia during mild grade 2 CRS not requiring vasopressor support (supplemental Table 3). Fourteen patients (74%) developed CRS (grade 1, n = 7, 37%; grade 2, n = 7, 37%) at a median onset of 3 days (range, 0-25) after CAR T-cell infusion. Grade ≥-3 CRS was not observed. No patients received vasopressors, and the maximum oxygen requirement was 5 L/min (nasal cannulae). Five patients developed neurotoxicity (grade 3 in all cases, n = 5, 26%) a median of 5 days after infusion (range, 5-22). Three patients (16%) received tocilizumab (median time to first administration, 5 days; range, 5-18), and 5 patients (26%) received dexamethasone (median time to first administration, 5 days; range, 5-23). The median number of tocilizumab and dexamethasone administrations was 1 (range, 1-2) and 19 (range, 2-22), respectively. The median treatment duration with dexamethasone was 5 days (range, 1-10). We observed a trend toward higher CAR T-cell expansion in blood from patients with CRS compared with those without CRS (median, 188 339 vs 9579 copies per microgram of DNA, respectively; P = .16). CAR T-cell expansion was comparable between patients with and without neurotoxicity (P = .42).
Hematologic toxicity accounted for the most frequently observed grade 3-4 adverse events (supplemental Table 4), with grade ≥ 3 neutropenia, anemia, and thrombocytopenia observed in 100%, 79%, and 68% of patients, respectively. Cytopenias were transient in most patients, and beyond day 28 after CAR T-cell infusion, only 4 of 18 evaluable patients (22%) required granulocyte colony-stimulating factor, red cell transfusion, and/or platelet transfusion support. All of these patients had grade 2-4 cytopenias before study enrollment. At 4 weeks after CAR T-cell infusion, all evaluable patients had an absolute neutrophil count > 500 cells per microliter, and 16 of 18 patients (89%) did not require ongoing granulocyte colony-stimulating factor support; 14 of 18 patients (78%) were red cell transfusion independent; and 17 of 18 patients (94%) were platelet transfusion independent. Two patients, both with grade 2 CRS and grade 3 neurotoxicity, developed grade 3-4 hypofibrinogenemia; however, with the exception of a patient with disseminated intravascular coagulation who sustained a traumatic subgaleal hematoma, hemorrhage was infrequent. Two thromboembolic events were observed: 1 asymptomatic pulmonary embolus and 1 microembolic stroke.
Concurrent ibrutinib with CAR T cells was associated with lower CRS severity compared with CAR T cells alone
We observed a low risk for severe CRS in our pilot study. To determine whether the addition of ibrutinib to CAR T-cell immunotherapy might contribute to a lower risk for severe CRS, we retrospectively compared patients treated with Cy/Flu, CD19 CAR T cells, and concurrent ibrutinib (Con-ibr cohort, n = 19) with patients who received Cy/Flu and the same CD19 CAR T-cell product at the same dose level (2 × 10⁶ cells per kilogram) without ibrutinib (No-ibr cohort, n = 19; supplemental Table 5). We observed lower CRS severity in the Con-ibr cohort (median CRS grade, 1; range, 0-2) compared with the No-ibr cohort (median CRS grade, 2; range, 0-5; P = .04; Figure 3). The severity of neurotoxicity was comparable between the 2 cohorts (P = .33). In the Con-ibr cohort, only 3 patients (16%) received tocilizumab and 5 patients (26%) received dexamethasone compared with 7 patients (37%) and 10 patients (53%), respectively, in the No-ibr cohort (P = .27 and P = .18, respectively). The median time to first tocilizumab administration was 5 days (range, 5-18) in the Con-ibr cohort and 6.5 days (range, 5-10) in the No-ibr cohort (P = .89). The median time to first dexamethasone administration was 5 days (range, 5-23) in the Con-ibr cohort and 6 days (range, 4-10) in the No-ibr cohort (P = .82). The number of tocilizumab administrations was comparable between the Con-ibr and No-ibr cohorts (median, 0; range, 0-2 vs median, 0; range, 0-3, respectively; P = .14). The number of dexamethasone administrations was also comparable between the Con-ibr and No-ibr cohorts (median, 0; range 0-22; vs median, 1; range, 0-13; P = .26). The median duration of dexamethasone treatment was 5 days (range, 1-10) in the Con-ibr cohort compared with 2 days (range, 1-6) in the No-ibr cohort (P = .25).
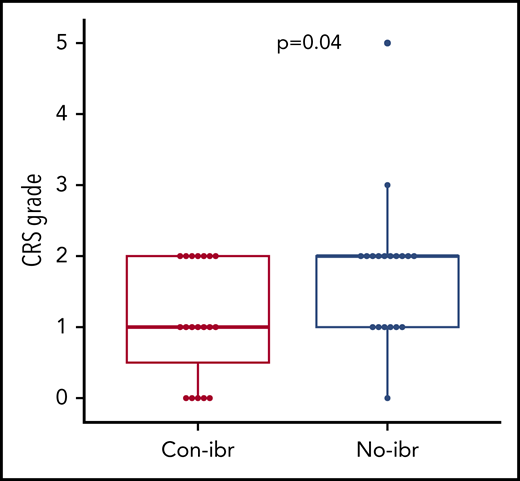
Lower CRS severity in the Con-ibr cohort. CRS grade according to the 2014 Lee et al consensus criteria.27 Bold horizontal lines represent the median, the box represents the interquartile range (IQR), and the vertical lines represent quartiles ± 1.5 × IQR. The P values were calculated using the Wilcoxon rank-sum test (2-sided).
Lower CRS severity in the Con-ibr cohort. CRS grade according to the 2014 Lee et al consensus criteria.27 Bold horizontal lines represent the median, the box represents the interquartile range (IQR), and the vertical lines represent quartiles ± 1.5 × IQR. The P values were calculated using the Wilcoxon rank-sum test (2-sided).
Continuation of ibrutinib therapy through leukapheresis and cell manufacturing could minimize the risks of rapid tumor progression after ibrutinib withdrawal and reduce tumor burden before CAR T-cell immunotherapy. Because the tumor burden is associated with CAR T-cell expansion in CLL13,30 and with CRS,31 we considered that a lower tumor burden in patients who received ibrutinib through leukapheresis and lymphodepletion could contribute to the reduced risk for severe CRS in the Con-ibr cohort. Consistent with this notion, lower prelymphodepletion lactate dehydrogenase concentrations (median, 155 vs 225 UI/L, P = .009) and lower cross-sectional tumor area (median, 1538 vs 3229 mm2, P = .04; supplemental Table 5) were measured in the Con-ibr cohort compared with the No-ibr cohort.
To determine whether ibrutinib might also reduce the risk of CRS by mechanisms other than tumor burden reduction, we investigated whether treatment in the Con-ibr cohort was independently associated with the risk of CRS. In a proportional odds regression model predicting the grade of CRS and adjusting for the marrow CLL burden, the prelymphodepletion serum lactate dehydrogenase concentration, and the cross-sectional tumor area, we found that treatment in the Con-ibr cohort independently predicted lower grades of CRS, with an estimated odds ratio of 0.25 (95% CI, 0.06-0.99; P = .05; supplemental Table 6). The adjusted predicted probabilities of grade ≥ 2 CRS are shown in supplemental Figure 3. These data suggest that tumor burden reduction may not be the only mechanism by which ibrutinib attenuates CRS severity after CAR T-cell immunotherapy.
Robust CART-cell expansion with lower CRS-related cytokine concentrations after CAR T-cell infusion with concurrent ibrutinib compared with CAR T cells without ibrutinib
Because ibrutinib inhibits interleukin-2-inducible T-cell kinase and might affect antigen-dependent signaling in T cells,20 we examined whether there were differences in in vivo CAR T-cell expansion that could contribute to the lower incidence of CRS in the Con-ibr cohort. Despite lower CRS severity in the Con-ibr cohort, we measured a trend toward a higher peak of CD4+ CAR T-cell counts in the Con-ibr cohort compared with the No-ibr cohort (median, 23 cells per microliter; interquartile range [IQR], 11-75 vs median, 6 cells per microliter; IQR, 2-23; P = .064), although the difference was not statistically significant. We measured comparable peak CD8+ CAR T-cell counts in the 2 cohorts (median, 192 cells per microliter; IQR, 17-495 vs median, 35 cells per microliter; IQR, 12-137; P = .40; Figure 4A-D). In patients who developed grade 1-2 CRS, we found higher CD4+ CAR T-cell counts (median, 31 cells per microliter; IQR, 14-76 vs median, 8 cells per microliter; IQR, 3-27; P = .049) and comparable CD8+ CAR T-cell counts (median, 273 cells per microliter; IQR, 24-634 vs median, 39 cells per microliter; IQR, 17-299; P = .42) in the Con-ibr cohort compared with the No-ibr cohort (Figure 4E-F). This indicated that ibrutinib-associated impairment of CAR T-cell expansion was unlikely to be the cause of the lower CRS severity in the Con-ibr cohort.
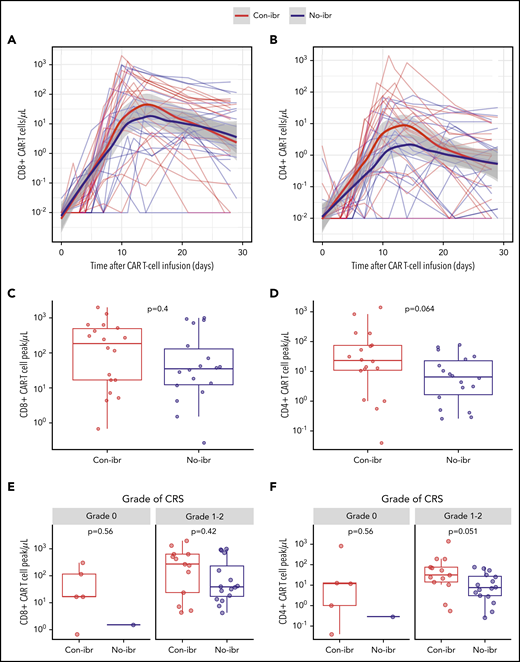
Robust CAR T-cell expansion in blood in the Con-ibr cohort. CD8+ (A) and CD4+ (B) CAR T-cell kinetics in blood between the day of CAR T-cell infusion and day 30. The bold curves are polynomial regression lines using the LOESS (locally estimated scatterplot smoothing) method, and the shaded areas show the 95% CIs of the estimates. CD8+ (C) and CD4+ (D) CAR T-cell peak counts in blood. CD8+ (E) and CD4+ (F) CAR T-cell peak counts in patients stratified by CRS grade, according to Lee et al consensus criteria. The P values were calculated using the Wilcoxon rank-sum test (2-sided). Bold horizontal lines represent the median, the box represents the IQR, and the vertical lines represent quartiles ± 1.5 × IQR. The figure shows data from patients treated with 2 × 10⁶ CAR T cells per kilogram and Cy/Flu lymphodepletion (Con-ibr, n = 18; No-ibr, n = 18). Two patients who died before the peak of CAR T-cell expansion were excluded.
Robust CAR T-cell expansion in blood in the Con-ibr cohort. CD8+ (A) and CD4+ (B) CAR T-cell kinetics in blood between the day of CAR T-cell infusion and day 30. The bold curves are polynomial regression lines using the LOESS (locally estimated scatterplot smoothing) method, and the shaded areas show the 95% CIs of the estimates. CD8+ (C) and CD4+ (D) CAR T-cell peak counts in blood. CD8+ (E) and CD4+ (F) CAR T-cell peak counts in patients stratified by CRS grade, according to Lee et al consensus criteria. The P values were calculated using the Wilcoxon rank-sum test (2-sided). Bold horizontal lines represent the median, the box represents the IQR, and the vertical lines represent quartiles ± 1.5 × IQR. The figure shows data from patients treated with 2 × 10⁶ CAR T cells per kilogram and Cy/Flu lymphodepletion (Con-ibr, n = 18; No-ibr, n = 18). Two patients who died before the peak of CAR T-cell expansion were excluded.
We investigated whether the phenotypes of manufactured CAR T cells differed between patients in the Con-ibr and No-ibr cohorts. We observed comparable percentages of naive and memory T-cell subsets across the Con-ibr and No-ibr cohorts in end-manufacturing CAR T-cell products, as well as comparable T-cell and CAR T-cell expansion during manufacturing (supplemental Table 7). We then sought to further evaluate the effects of ibrutinib on the function of CAR T cells from patients in each cohort. We identified 2 groups of patients with available research samples: the first group was receiving ibrutinib treatment at the time of leukapheresis in the Con-ibr cohort (n = 6); the second group of patients had stopped ibrutinib at least 6 weeks prior to leukapheresis in the No-ibr cohort (n = 7; median time to last ibrutinib administration, 110 days; range, 44-909). We stimulated CAR T cells with K562 cells expressing CD19 or with unmodified K562 cells and found a trend toward greater proliferation of CD4+ CAR T cells (day 4, P = .07; day 7, P = .10) and CD8+ CAR T cells (day 7; P = .10) in patients in the Con-ibr cohort (supplemental Table 6A). We also observed a trend toward a higher percentage of polyfunctional CD8+ CAR T cells expressing ≥2 cytokines in the Con-ibr group (P = .054; supplemental Table 6B). Assessment of inhibitory receptor expression on aliquots of infused CAR T cells demonstrated a trend toward a lower percentage of CD4+ CAR T cells expressing >2 inhibitory receptors in the Con-ibr group compared with the No-ibr group (P = .10, supplemental Table 6C). Although our findings did not reach statistical significance at the 0.05 level, they suggest that ibrutinib treatment prior to leukapheresis might be associated with improved CAR T-cell function.
Despite a trend toward higher numbers of CD4+ CAR T cells in vivo, the Con-ibr cohort was associated with lower CRS severity, suggesting differences in the cytokine milieu. To better characterize these differences in toxicity, we compared the peak serum concentrations of cytokines (supplemental Table 8), including those shown to correlate with CRS severity. Despite equivalent or higher CAR T-cell counts, patients in the Con-ibr cohort had lower peak MCP-1 concentrations (median, 411.38 pg/mL; IQR, 197.01-1124.65 vs median, 1738.22 pg/mL; IQR, 986.54-2440.56; P = .018) and soluble interleukin-2Rα (IL-2Rα) concentrations (median, 165.70 pg/mL; IQR, 139.53-637.46 vs median, 4469.28 pg/mL; IQR, 2107-8751; P < .001) compared with the No-ibr cohort (Figure 5A-B) and consistent with the lower CRS severity observed in the Con-ibr cohort. We did not identify significantly lower peak IL-6 concentrations in the Con-ibr cohort compared with the No-ibr cohort (median, 25 pg/mL; IQR, 3.28-83.47 vs median, 53.78 pg/mL; IQR, 13.30-597.62, respectively; P = .278; Figure 5C). The data indicate that the concentrations of cytokines associated with severe CRS were not higher in patients receiving CAR T cells with concurrent ibrutinib, despite robust in vivo CAR T-cell expansion.31,32
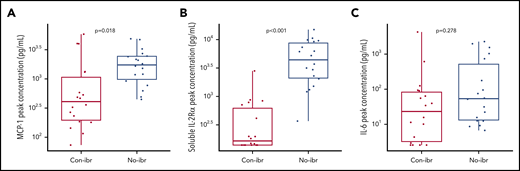
Greater numbers of CAR T cells were associated with lower serum concentrations of cytokines strongly correlated with severity. Peak serum MCP-1 (A), soluble IL-2Rα (B), and IL-6 (C) concentrations (log10 pg/µL) in patients who received 2 × 10⁶ CAR T cells per kilogram and Cy/Flu lymphodepletion (Con-ibr, n = 18; No-ibr, n = 18). Bold horizontal lines represent the median, the box represents the IQR, and the vertical lines represent quartiles ± 1.5 × IQR. Two patients who died before the peak of CAR T-cell expansion were excluded. The P values were calculated using the Wilcoxon rank-sum test (2-sided) and were adjusted for multiple comparisons using the Benjamini-Hochberg procedure. No-ibr, ibrutinib discontinued prior to lymphodepletion.
Greater numbers of CAR T cells were associated with lower serum concentrations of cytokines strongly correlated with severity. Peak serum MCP-1 (A), soluble IL-2Rα (B), and IL-6 (C) concentrations (log10 pg/µL) in patients who received 2 × 10⁶ CAR T cells per kilogram and Cy/Flu lymphodepletion (Con-ibr, n = 18; No-ibr, n = 18). Bold horizontal lines represent the median, the box represents the IQR, and the vertical lines represent quartiles ± 1.5 × IQR. Two patients who died before the peak of CAR T-cell expansion were excluded. The P values were calculated using the Wilcoxon rank-sum test (2-sided) and were adjusted for multiple comparisons using the Benjamini-Hochberg procedure. No-ibr, ibrutinib discontinued prior to lymphodepletion.
Comparable response rates and long-term outcomes in the Con-ibr and No-ibr cohorts
The robust CD4+ and CD8+ CAR T-cell counts in the Con-ibr cohort suggested that ibrutinib did not impair the ability of CAR T cells to recognize tumor and proliferate in vivo.
As shown in Table 2, comparable overall response rates (ORR), by iwCLL criteria, were observed in the Con-ibr and No-ibr cohorts (83% vs 56%, respectively; P = .15), as well as comparable rates of MRD-negative marrow response by flow cytometry (72% vs 67%, respectively; P = 1). Comparable nodal responses were also observed between the 2 cohorts (Table 2; supplemental Figure 4). Of patients who achieved MRD-negative marrow response by flow cytometry, 85% in the Con-ibr cohort had no detectable clone by IGH sequencing compared with 60% in the No-ibr cohort (P = .34). We could not reject the hypothesis of comparable CR/CRi rates between the Con-ibr and No-ibr cohorts (CR/CRi vs PR vs SD/PD, P = .12; CR/CRi vs PR/SD/PD, P = .34).
We also compared the OS and PFS probabilities of patients in the Con-ibr and No-ibr cohorts (supplemental Figure 5). The 1-year OS probabilities were 64% (95% CI, 42-98%) and 61% (95% CI, 42-88%) in the Con-ibr and No-ibr cohorts, respectively (P = .80), and the 1-year PFS probabilities were 38% (95% CI, 19-78%) and 50% (95% CI, 31-79%), respectively (P = .91). Comparable OS (P = .36) and PFS (P = .18) were also observed when limiting these analyses to patients achieving a CR or PR by iwCLL criteria after CAR T-cell immunotherapy. In patients with an MRD-negative marrow response by IGH sequencing, the 1-year PFS in the Con-ibr and No-ibr cohorts was 100% and 59% (95% CI, 32-100), respectively (P = .09), and it was 78% (95% CI, 58-100) in the pooled Con-ibr and No-ibr cohorts (n = 17); the 2-year PFS in the No-ibr cohort was 67% (95% CI, 38-100). The 2-year PFS in the Con-ibr cohort could not be estimated because of the shorter follow-up duration. Last, the estimated median durations of B-cell aplasia were comparable between the 2 cohorts: 391 days (95% CI, 385-not reached) in the Con-ibr cohort vs 398 days (95% CI, 377-not reached) in the No-ibr cohort (P = .68).
Discussion
We and other investigators have reported encouraging results in R/R high-risk CLL patients treated with CD19 CAR T cells.13,33 Because preclinical data suggested that ibrutinib might enhance the efficacy21 and decrease the toxicity22 of CAR T cells in CLL, we conducted a pilot study to determine whether the concurrent administration of ibrutinib through leukapheresis, lymphodepletion, and CD19 CAR T-cell infusion could improve outcomes of CAR T-cell immunotherapy in heavily pretreated high-risk R/R CLL patients who had failed ibrutinib. Combination therapy with ibrutinib and CD19 CAR T cells resulted in high response rates by iwCLL (ORR, 83%), including high rates of MRD-negative marrow response by flow cytometry (72%) and IGH sequencing (61%) and high lymph node response rates (71%) with a low incidence of severe toxicity. Because restaging was performed 4 weeks after CAR T-cell infusion, the study was limited in its capacity to identify patients with initial PR and/or MRD who might later have achieved MRD-negative CR. Although we cannot discount a contribution from Cy/Flu lymphodepletion to the antitumor response, the finding that 95% of patients (n = 36) had high-risk cytogenetics and/or had previously failed Cy/Flu suggests that this is unlikely to be the main mechanism of action. The 1-year OS and PFS in our study (86% and 59%, respectively, in patients achieving MRD-negative marrow response by IGH sequencing) compare favorably with published data in the ibrutinib-refractory setting.6,9,14,15
Concurrent administration of ibrutinib with CAR T cells was well tolerated in most patients; however, we observed 1 sudden death from a probable cardiac arrhythmia in the context of mild grade 2 CRS not requiring vasopressors. Ibrutinib is known to be arrhythmogenic, and ventricular arrhythmia and sudden death have been reported.34-37 A fatal cardiac arrhythmia occurred in another study after treatment with CTL119 and concurrent ibrutinib,38 indicating that caution is warranted in patients with CRS while receiving ibrutinib after CAR T-cell immunotherapy. Although data from a larger cohort of treated patients will be required to establish formal guidelines, we use careful cardiac work-up prior to therapy and telemetry to monitor patients on ibrutinib presenting with CRS or neurotoxicity after CAR T-cell immunotherapy.
A retrospective comparison demonstrated lower CRS severity after CAR T-cell immunotherapy with concurrent ibrutinib compared with CAR T cells alone, even after adjusting for disease burden in a multivariable regression model. Lower disease burden could contribute to the lower CRS severity in the Con-ibr cohort; however, if this were the case, one would expect it to be accompanied by lower in vivo CAR T-cell expansion, which was not what we observed.13 Because we measured equivalent numbers of CAR T cells in patients who received concurrent ibrutinib, we hypothesize that the ibrutinib-induced inhibition of in vivo CAR T-cell expansion was not responsible for lower CRS severity. In contrast with the high CAR T-cell counts observed in patients treated with concurrent ibrutinib, we found lower concentrations of CRS-associated cytokines: MCP-1 and soluble IL-2Rα.31,32 These data suggest that ibrutinib might mitigate CRS without impairing CAR T-cell proliferation. Our observations are consistent with preclinical data; Ruella et al reported that mice receiving ibrutinib and CD19 CAR T cells had lower serum concentrations of CRS-associated cytokines and higher numbers of CAR T cells in the blood compared with mice treated with CAR T cells in the absence of ibrutinib.22 Ibrutinib might reduce CRS by altering cytokine production by distinct cell types: CAR T cells, unmodified T cells,20,39 tumor cells,22 monocytes,40-42 and other immune subsets. Additionally, the ibrutinib-related inhibition of interleukin-2-inducible T-cell kinase signaling20 may mediate the observed reduction in severe CRS. Despite lower CRS severity with concurrent ibrutinib, we observed comparable response rates by iwCLL 2018 criteria (global and nodal response), as well as comparable rates of MRD-negative marrow response by IGH sequencing. Whether ibrutinib can deepen responses to CD19 CAR T-cell immunotherapy remains to be determined in further studies; this clinical trial was a pilot study not adequately powered to detect differences in response.
We acknowledge that our findings are limited by the retrospective nature of the analysis and the small cohort sizes in this single-center pilot phase 1 study. Additional studies are needed to delineate the effects of ibrutinib in combination with CD19 CAR T cells, to confirm the associated mechanisms, and to establish the optimal timing of ibrutinib administration relative to leukapheresis, lymphodepletion, and CAR T infusion. Nonrandomized studies to prospectively evaluate the combination of ibrutinib and CD19 CAR T cells are on-going (NCT03331198, NCT02640209).
In conclusion, CD19 CAR T-cell immunotherapy with concurrent ibrutinib was feasible in most patients, and led to high response rates without severe CRS in patients with high-risk CLL after prior ibrutinib failure.
Presented in abstract form at the 60th annual meeting of the American Society of Hematology, San Diego, CA and at the 2019 TCT | Transplantation and Cellular Therapy Meeting, Houston, TX.
The online version of this article contains a data supplement.
The publication costs of this article were defrayed in part by page charge payment. Therefore, and solely to indicate this fact, this article is hereby marked “advertisement” in accordance with 18 USC section 1734.
Acknowledgments
The authors thank the Fred Hutchinson Cancer Research Center Cell Processing Facility, the Seattle Cancer Care Alliance Cell Therapy Laboratory, and the staff of the Program in Immunology and Seattle Cancer Care Alliance Immunotherapy Clinic. The authors are especially grateful to Yin Hang and Eeva Cieslak for help with data collection.
This work was supported by grants from the National Institutes of Health (NIH) National Cancer Institute (R01 CA136551, P30 CA15704, and R35 CA197734), NIH National Institute of Diabetes and Digestive and Kidney Diseases (P30 DK56465), the Life Science Discovery Fund, the Bezos Family Foundation, the University of British Columbia Clinical Investigator Program, the National Gene Vector Biorepository at Indiana University (funded by NIH National Heart, Lung, and Blood Institute grant 75N92019D00018), and Juno Therapeutics, a Celgene Company.
Authorship
Contribution: J.G., C.J.T., S.R.R., and D.G.M. conceived of and designed the study; J.G., C.J.T., and D.G.M. collected and assembled data; J.G., J.L., C.J.T., and D.G.M. analyzed and interpreted data; and J.G., A.V.H., J.P., K.A.H., J.L., D.H.L., C.C.S.Y., A.S., B.S.P., R.M.H., A.V., T.-D.P., R.N.S., M.S., S.R.R., D.G.M., and C.J.T. wrote and approved the final version of the manuscript and are accountable for all aspects of the work.
Conflict-of-interest disclosure: K.A.H. has served on advisory boards for Celgene. J.L. and D.L. are employees of and have equity ownership in Juno Therapeutics, a Bristol-Myers Squibb Company. M.S. has received research funding from Mustang Bio, Celgene, Pharmacyclics, Gilead, Genentech, AbbVie, TG Therapeutics, Beigene, Acerta Pharma, and Merck and has served on advisory boards for AbbVie, Genentech, Astra Zeneca, Sound Biologics, Verastem, ADC Therapeutics, and Atara Biotherapeutics. S.R.R. holds equity ownership in, has served as an advisor for, and has patents licensed to Juno Therapeutics, a Bristol-Myers Squibb Company; is a founder of Lyell Immunopharma; and has served on advisory boards for Adaptive Biotechnologies and Nohla. D.G.M. has received research funding from Kite Pharma, Juno Therapeutics, a Bristol-Myers Squibb Company, and Celgene and has received honoraria for participation in advisory board meetings from Kite Pharma, Gilead, Genentech, Novartis, and Eureka. C.J.T. receives research funding from Juno Therapeutics, a Bristol-Myers Squibb Company, and Nektar Therapeutics; has patents pending and licensed to Juno Therapeutics, a Celgene company; has served on advisory boards and has equity ownership in Caribou Biosciences, Eureka Therapeutics, Precision Biosciences, ArsenalBio, and Myeloid Therapeutics; and has served on advisory boards for Aptevo, Juno Therapeutics, a Bristol-Myers Squibb Company, Kite, a Gilead Company, Humanigen, Nektar Therapeutics, Novartis, T-CURX, Allogene, AstraZeneca, and PACT Pharma. The remaining authors declare no competing financial interests.
Correspondence: Jordan Gauthier, Clinical Research Division, Fred Hutchinson Cancer Research Center, 1100 Fairview Ave N, Seattle, WA 98109; e-mail: jgauthier@fredhutch.org.

This feature is available to Subscribers Only
Sign In or Create an Account Close Modal