

Key Points
Two common AML mutations, NPM1c and FLT3-TKD, cooperate to induce a rapid-onset disease in mice.
Mechanistically, NPM1c alters FLT3-TKD localization and changes its signaling properties, which may be useful for therapeutic intervention.

Abstract
Activating mutations in FMS-like tyrosine kinase receptor-3 (FLT3) and Nucleophosmin-1 (NPM1) are most frequent alterations in acute myeloid leukemia (AML), and are often coincidental. The mutational status of NPM1 has strong prognostic relevance to patients with point mutations of the FLT3 tyrosine kinase domain (TKD), but the biological mechanism underlying this effect remains unclear. In the present study, we investigated the effect of the coincidence of NPM1c and FLT3-TKD. Although expression of FLT3-TKD is not sufficient to induce a disease in mice, coexpression with NPM1c rapidly leads to an aggressive myeloproliferative disease in mice with a latency of 31.5 days. Mechanistically, we could show that FLT3-TKD is able to activate the downstream effector molecule signal transducer and activator of transcription 5 (STAT5) exclusively in the presence of mutated NPM1c. Moreover, NPM1c alters the cellular localization of FLT3-TKD from the cell surface to the endoplasmic reticulum, which might thereby lead to the aberrant STAT5 activation. Importantly, aberrant STAT5 activation occurs not only in primary murine cells but also in patients with AML with combined FLT3-TKD and NPM1c mutations. Thus, our data indicate a new mechanism, how NPM1c mislocalizes FLT3-TKD and changes its signal transduction ability.
Introduction
Acute myeloid leukemia (AML) is a heterogeneous disease accounting for approximately 12% of all hematologic malignancies.1 Whole-genome studies identified FMS-like tyrosine kinase receptor-3 (FLT3) and Nucleophosmin-1 (NPM1) mutations as the most common gene aberrations, which are frequently cooccurring.2,3
Two types of FLT3 mutations are described in AML: tandem duplication of the juxtamembraneous domain (ITD) in 20% to 27%, as the most prevalent one, and point mutations of the tyrosine kinase domain (TKD) in 7%.4-6 Interestingly, in acute lymphoblastic leukemia (ALL), FLT3-TKD mutations are present in 3% of the patients,7-9 whereas FLT3-ITD mutations are rarely found. Cytoplasmic NPM1 mutations (NPM1c) are present in 35% of AML cases, but do not occur in lymphoblastic neoplasms.2
Preclinical mouse models somehow reflect the clinical phenotype of these mutations, as solely expression of both most prevalent AML mutations (NPM1c and FLT3-ITD) induce a myeloproliferative neoplasm (MPN) in murine models,10-12 whereas FLT3-TKD expression leads to a lymphoid disorder.13 Coexpression of NPM1c and FLT3-ITD rapidly induces an AML in mice.14-16 Furthermore, it has been shown that NPM1c leads to an overexpression of Hox genes12 and alters the localization of several proteins such as c-Myc or p19Arf.17
Recently, the presence of NPM1 mutations in patients with FLT3-TKD+ AML has been defined as a strong prognostic factor,18 but the mechanistic role of NPM1c in AML induction remains unclear, and mouse models, which combine NPM1c and FLT3-TKD mutations, are missing.
Here, we analyzed the cooperative effect of NPM1c mutations and FLT3-TKD in murine transplantation assays, human AML cell lines, and primary AML patient samples. Our results indicate that NPM1c and FLT3-TKD mutations cooperate by altering critical cellular signaling components, and may thereby explain the different therapeutic response of NPM1 mutant vs NPM1 wt FLT3-TKD+ AML.
Study design
Detailed methodology is provided in supplemental Methods, available on the Blood Web site.
Results and discussion
Coexpression of NPM1c and FLT3-D835Y induces a STAT5-mediated rapid-onset MPN in mice
To investigate the effect of NPM1c and FLT3-D835Y cooccurrence, we chose a model combining conditional Npm1c knockin mice12 with retroviral Flt3-TKD transduction. Mice transplanted with Flt3-D835Y+Npm1flox-cA/+Mx1-Cre+ bone marrow (BM; n = 26; hereafter referred to as Flt3-D835Y+Npm1c+ mice) succumbed of a leukemic disorder after a median latency of 31.5 days. In contrast, mice transplanted with Flt3-D835Y+Npm1flox cA/+ BM without Mx1-Cre (referred to as Flt3-D835Y+Npm1 wt; n = 13), Flt3-D835Y+Npm1+/+Mx1-Cre+ BM (n = 5), or Npm1flox cA/+Mx1-Cre BM infected with empty vector (n = 5) did not develop leukemia (Figure 1A). Moribund animals demonstrated significantly increased leukemic burden, as well as a profound splenomegaly in Flt3-D835Y+Npm1c+ mice compared with Flt3-D835Y+Npm1 wt animals (Figure 1B-D; supplemental Figure 1A). Flow cytometric analysis showed that 88.5% (23/26) of Flt3-D835Y+Npm1c+ mice succumbed of an immunophenotypic MPN, which was serially transplantable, whereas control mice did not (Figure 1E; supplemental Figures 1B, 2, and 3; supplemental Table 1). Our study thereby supports several other publications showing differences in disease phenotype and latency in dependence of cooperating oncogenes,14-16,19 and reinforces the two-hit model of leukemogenesis.20
![Figure 1. Coexpression of NPM1c and FLT3-D835Y induces a STAT5-mediated rapid onset MPN in mice. (A) Kaplan-Meier plots for survival of recipients of 25 000 Npmflox cA/+ or Npm1+/+ BM cells transduced with FLT3-D835Y, FLT3-ITD, or empty vector (MiG) showing the rapid onset of leukemic disease in Flt3-D835Y+Npm1c+ mice. A total of 26 mice (from 4 independent transplantations) are presented that received Flt3-D835Y+ Npm1flox cA/+ Mx1-Cre BM. Seven mice received Flt3-ITD+ Npm1flox cA/+ Mx1-Cre BM, 5 mice Flt3-ITD+ Npm1+/+ Mx1-Cre BM, 13 mice received Flt3-D835Y+ Npm1flox cA/+ BM in the absence of Mx1-Cre, 5 mice received Flt3-D835Y+ Npm1+/+ Mx1Cre BM, and 5 mice received MiG Npm1flox cA/+ Mx1-Cre BM. (B) Percentage of PB EGFP+ cells at indicated times demonstrating increased leukemic burden in Flt3-D835Y+ Npm1c+ mice compared with Flt3-D835Y+ Npm1 wt mice (21 days posttransplant: n = 28 [NPM1c], n = 17 [NPM1 wt]; 33 days posttransplant: n = 12 [NPM1c], n = 7 [NPM1 wt]; 48 days posttransplant: n = 7 [NPM1c], n = 15 [NPM1 wt]). (C) Fold induction of BM EGFP+ cells shows a significantly enhanced leukemic burden in Flt3-D835Y+ Npm1c+ moribund mice (n = 22) compared with Flt3-D835Y+ Npm1 wt mice (n = 7; sacrificed after more than 130 days). (D) Increased spleen weights of Flt3-D835Y+ Npm1c+ moribund mice (n = 22) compared with Flt3-D835Y+ Npm1 wt group; (n = 6; sacrificed after more than 130 days). (E) CD45+ BM cells from a representative mouse were stained for Gr-1, B220, or Thy1.2 and analyzed by flow cytometry. Numbers indicate percentage of cells in the respective quadrant gate. Flt3-D835Y+ Npm1c+ Mx1-Cre mice display a phenotypic shift to a myeloproliferative disease with elevated numbers of EGFP+/Gr-1+ cells. Phenotype distributions are shown in supplemental Table 1 and supplemental Figure 1. (F) Immunofluorescence staining of pSTAT5 in EGFP+ BM cells from moribund mice showing STAT5 activation only in Flt3-D835Y+ Npm1c+ cells. (G) Quantification of the percentage of positive cells in n = 9 (NPM1c) and n = 4 (NPM1 wt) pictures. (H) Immunofluorescence staining of pSTAT3 in EGFP+ BM cells. pSTAT3 is exclusively present in Flt3-D835Y+ Npm1 wt cells. (I) Quantification of the percentage of positive cells in n = 7 (NPM1c) and n = 4 (NPM1 wt) pictures. (J) Splenocytes from moribund mice were analyzed for STAT5, STAT3, and ERK1/2 signaling by immunoblotting. Flt3-D835Y+ Npm1c+ cells display a strong induction of STAT5 signaling and little STAT3 activation. Flt3-D835Y+ Npm1 wt cells show no STAT5 activation, but activation of STAT3. (K) Flow cytometric analysis of pSTAT5 and pSTAT3 in EGFP+ BM cells from moribund mice confirming the activation of STAT5 in Flt3-D835Y+ Npm1c+ cells, but not in Flt3-D835Y+ Npm1 wt cells. *P < .05, **P < .01, and ***P < .001, by unpaired, 2-tailed Student t test (panels B-D, G, and I) or logrank test (panel A).](https://ash.silverchair-cdn.com/ash/content_public/journal/blood/134/4/10.1182_blood.2018883140/3/m_blood883140f1.png?Expires=1765922963&Signature=V2cZsAVU4U~EgY1W~2OgKbt1ao6sngTIAwXIYnW9UqMcPXpkBWhVM-Do4Fm4kKQX5CRh7l~QHaoOAxZ1T7Qfs0blWSihlsRRElQ1NvfYDIFPG~NTxZc~Fg~hzOjOjqyOqY~EJtIWuH11u9ibYPgx~ZG213063bVJzrAZXWUc0nGsJkqZxek~jInQfJbhs05ufvGlauHgUVuC-XX8xcAzn~AzXC-Daj3yaH9JK0dHeM6HX6CGdh3BS50ksOaqlKgfTcmOlrEoghaZrciwUUcC5y39lO8kh4VaWZWpldhk4LPsqWuDAQVz~YO3rS6XpBMEbJTYsr3qmS56JaBiyA~ylQ__&Key-Pair-Id=APKAIE5G5CRDK6RD3PGA)
Coexpression of NPM1c and FLT3-D835Y induces a STAT5-mediated rapid onset MPN in mice. (A) Kaplan-Meier plots for survival of recipients of 25 000 Npmflox cA/+ or Npm1+/+ BM cells transduced with FLT3-D835Y, FLT3-ITD, or empty vector (MiG) showing the rapid onset of leukemic disease in Flt3-D835Y+Npm1c+ mice. A total of 26 mice (from 4 independent transplantations) are presented that received Flt3-D835Y+Npm1flox cA/+Mx1-Cre BM. Seven mice received Flt3-ITD+Npm1flox cA/+Mx1-Cre BM, 5 mice Flt3-ITD+Npm1+/+Mx1-Cre BM, 13 mice received Flt3-D835Y+Npm1flox cA/+ BM in the absence of Mx1-Cre, 5 mice received Flt3-D835Y+Npm1+/+Mx1Cre BM, and 5 mice received MiG Npm1flox cA/+Mx1-Cre BM. (B) Percentage of PB EGFP+ cells at indicated times demonstrating increased leukemic burden in Flt3-D835Y+Npm1c+ mice compared with Flt3-D835Y+Npm1 wt mice (21 days posttransplant: n = 28 [NPM1c], n = 17 [NPM1 wt]; 33 days posttransplant: n = 12 [NPM1c], n = 7 [NPM1 wt]; 48 days posttransplant: n = 7 [NPM1c], n = 15 [NPM1 wt]). (C) Fold induction of BM EGFP+ cells shows a significantly enhanced leukemic burden in Flt3-D835Y+Npm1c+ moribund mice (n = 22) compared with Flt3-D835Y+Npm1 wt mice (n = 7; sacrificed after more than 130 days). (D) Increased spleen weights of Flt3-D835Y+Npm1c+ moribund mice (n = 22) compared with Flt3-D835Y+Npm1 wt group; (n = 6; sacrificed after more than 130 days). (E) CD45+ BM cells from a representative mouse were stained for Gr-1, B220, or Thy1.2 and analyzed by flow cytometry. Numbers indicate percentage of cells in the respective quadrant gate. Flt3-D835Y+Npm1c+Mx1-Cre mice display a phenotypic shift to a myeloproliferative disease with elevated numbers of EGFP+/Gr-1+ cells. Phenotype distributions are shown in supplemental Table 1 and supplemental Figure 1. (F) Immunofluorescence staining of pSTAT5 in EGFP+ BM cells from moribund mice showing STAT5 activation only in Flt3-D835Y+Npm1c+ cells. (G) Quantification of the percentage of positive cells in n = 9 (NPM1c) and n = 4 (NPM1 wt) pictures. (H) Immunofluorescence staining of pSTAT3 in EGFP+ BM cells. pSTAT3 is exclusively present in Flt3-D835Y+Npm1 wt cells. (I) Quantification of the percentage of positive cells in n = 7 (NPM1c) and n = 4 (NPM1 wt) pictures. (J) Splenocytes from moribund mice were analyzed for STAT5, STAT3, and ERK1/2 signaling by immunoblotting. Flt3-D835Y+Npm1c+ cells display a strong induction of STAT5 signaling and little STAT3 activation. Flt3-D835Y+Npm1 wt cells show no STAT5 activation, but activation of STAT3. (K) Flow cytometric analysis of pSTAT5 and pSTAT3 in EGFP+ BM cells from moribund mice confirming the activation of STAT5 in Flt3-D835Y+Npm1c+ cells, but not in Flt3-D835Y+Npm1 wt cells. *P < .05, **P < .01, and ***P < .001, by unpaired, 2-tailed Student t test (panels B-D, G, and I) or logrank test (panel A).
Coexpression of NPM1c and FLT3-D835Y induces a STAT5-mediated rapid onset MPN in mice. (A) Kaplan-Meier plots for survival of recipients of 25 000 Npmflox cA/+ or Npm1+/+ BM cells transduced with FLT3-D835Y, FLT3-ITD, or empty vector (MiG) showing the rapid onset of leukemic disease in Flt3-D835Y+Npm1c+ mice. A total of 26 mice (from 4 independent transplantations) are presented that received Flt3-D835Y+Npm1flox cA/+Mx1-Cre BM. Seven mice received Flt3-ITD+Npm1flox cA/+Mx1-Cre BM, 5 mice Flt3-ITD+Npm1+/+Mx1-Cre BM, 13 mice received Flt3-D835Y+Npm1flox cA/+ BM in the absence of Mx1-Cre, 5 mice received Flt3-D835Y+Npm1+/+Mx1Cre BM, and 5 mice received MiG Npm1flox cA/+Mx1-Cre BM. (B) Percentage of PB EGFP+ cells at indicated times demonstrating increased leukemic burden in Flt3-D835Y+Npm1c+ mice compared with Flt3-D835Y+Npm1 wt mice (21 days posttransplant: n = 28 [NPM1c], n = 17 [NPM1 wt]; 33 days posttransplant: n = 12 [NPM1c], n = 7 [NPM1 wt]; 48 days posttransplant: n = 7 [NPM1c], n = 15 [NPM1 wt]). (C) Fold induction of BM EGFP+ cells shows a significantly enhanced leukemic burden in Flt3-D835Y+Npm1c+ moribund mice (n = 22) compared with Flt3-D835Y+Npm1 wt mice (n = 7; sacrificed after more than 130 days). (D) Increased spleen weights of Flt3-D835Y+Npm1c+ moribund mice (n = 22) compared with Flt3-D835Y+Npm1 wt group; (n = 6; sacrificed after more than 130 days). (E) CD45+ BM cells from a representative mouse were stained for Gr-1, B220, or Thy1.2 and analyzed by flow cytometry. Numbers indicate percentage of cells in the respective quadrant gate. Flt3-D835Y+Npm1c+Mx1-Cre mice display a phenotypic shift to a myeloproliferative disease with elevated numbers of EGFP+/Gr-1+ cells. Phenotype distributions are shown in supplemental Table 1 and supplemental Figure 1. (F) Immunofluorescence staining of pSTAT5 in EGFP+ BM cells from moribund mice showing STAT5 activation only in Flt3-D835Y+Npm1c+ cells. (G) Quantification of the percentage of positive cells in n = 9 (NPM1c) and n = 4 (NPM1 wt) pictures. (H) Immunofluorescence staining of pSTAT3 in EGFP+ BM cells. pSTAT3 is exclusively present in Flt3-D835Y+Npm1 wt cells. (I) Quantification of the percentage of positive cells in n = 7 (NPM1c) and n = 4 (NPM1 wt) pictures. (J) Splenocytes from moribund mice were analyzed for STAT5, STAT3, and ERK1/2 signaling by immunoblotting. Flt3-D835Y+Npm1c+ cells display a strong induction of STAT5 signaling and little STAT3 activation. Flt3-D835Y+Npm1 wt cells show no STAT5 activation, but activation of STAT3. (K) Flow cytometric analysis of pSTAT5 and pSTAT3 in EGFP+ BM cells from moribund mice confirming the activation of STAT5 in Flt3-D835Y+Npm1c+ cells, but not in Flt3-D835Y+Npm1 wt cells. *P < .05, **P < .01, and ***P < .001, by unpaired, 2-tailed Student t test (panels B-D, G, and I) or logrank test (panel A).
As activation of signal transducer and activator of transcription 5 (STAT5) was proposed to be crucial for MPN induction by FLT3-ITD,21 we investigated activation of STAT molecules and mitogen-activated protein kinase pathways and detected a profound STAT5, but not STAT3, activation in Flt3-D835Y+Npm1c+ splenocytes. In contrast, Flt3-D835Y+Npm1 wt cells show negligible STAT5 activation but high pSTAT3 levels (Figure 1F-K), whereas mitogen-activated protein kinase signaling was not altered between Flt3-D835Y+Npm1c+ and Flt3-D835Y+Npm1 wt cells (Figure 1J). Consistent with our results, previous studies showed marginal STAT5 activation by FLT3-D835Y, which was comparable to FLT3 wt.22 Sole expression of NPM1c did not activate STAT5 (supplemental Figure 4A-C).
Presence of NPM1c shifts FLT3-D835Y localization to the endoplasmic reticulum
Mislocalization of oncogenic receptor tyrosine kinases is a frequent phenomenon and leads to aberrant downstream signaling. For FLT3-ITD, it has been shown that its ability to activate STAT5 is dependent on a mislocalization to the endoplasmic reticulum (ER).23,24 Interestingly, flow cytometry analysis demonstrated a significant reduction of FLT3 surface expression in Flt3-D835Y+Npm1c+ BM cells compared with Flt3-D835Y+Npm1 wt control cells (Figure 2A-B). In addition, colocalization of FLT3-TKD and the ER marker Calnexin was shown in NPM1c+ cells, but not in NPM1 wt cells (Figure 2C). This result was confirmed in human AML cell lines, where NPM1c-positive OCI-AML3 cells show more colocalization of FLT3 and PDI (ER marker) compared with NPM1 wt HL-60 cells (Figure 2D). Using a colocalization-specific algorithm analysis, we could detect significantly increased colocalization of FLT3 and ER markers in both murine and human cells (Figure 2E-F). Overexpression of murine FLT3-D835Y revealed a reduction of surface mFLT3 in NPM1c+ OCI-AML3 in comparison with NPM1 wt HL-60 cells (supplemental Figure 5A). Further experiments in different human cell lines verified these results: ectopic expression of FLT3-D835Y in NPM1c+ AML cells (OCI-AML3) led to an intracellular 130-kDa form, whereas a highly glycosylated, membrane-associated 150-kDa form of FLT3-D835Y could be found in NPM1 wt AML cells (HL-60; Figure 2G; supplemental Figure 5B-E), indicating differential FLT3-D835Y localization in the presence of NPM1c.
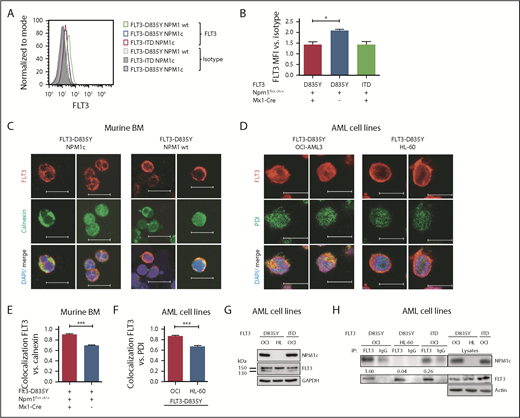

Presence of NPM1c shifts FLT3-D835Y localization to the endoplasmic reticulum. (A) Flow cytometry analysis of FLT3 surface expression reveals reduced FLT3-D835Y expression on the surface in NPM1c+ cells (blue) compared with NPM1 wt cells (green). FLT3-D835Y expression in NPM1c+ cells is comparable to FLT3-ITD surface expression (red). Gray peaks represent isotype controls. (B) Statistical analysis of FLT3-D835Y surface mean fluorescence intensity in NPM1c+ cells compared with NPM1 wt cells (n = 3). (C) Immunofluorescence staining shows colocalization of FLT3-D835Y with the ER marker Calnexin in murine NPM1c+ EGFP+ BM. (D) Immunofluorescence staining shows colocalization of FLT3-D835Y with the ER marker PDI in a NPM1c+ AML cell line (OCI-AML3), but not in NPM1 wt expressing HL-60 cells. (E) Mander’s coefficient analysis for colocalization of FLT3 with Calnexin in murine FLT3-D835Y+ NPM1c+ BM cells (n = 9 images with 49 cells) and in FLT3-D835Y+ NPM1 wt BM cells (n = 6 images with 189 cells). (F) Mander’s coefficient analysis for colocalization of FLT3-D835Y with PDI in OCI-AML3 (n = 6 images with 169 cells) and HL-60 cells (n = 4 images with 57 cells). (G) Immunoblot analysis of AML cell line lysates reveals expression of underglycosylated ER-localized 130-kDa form of FLT3-D835Y and FLT3-ITD in OCI-AML3, but not in HL-60, cells. (H) Co-immunoprecipitation of FLT3 shows interaction with NPM1c in OCI-AML3 FLT3-D835Y cells, low interaction in OCI-AML3 FLT3-ITD and no interaction in HL-60 FLT3-D835Y (negative control) cells. (I) Intracellular flow cytometric analysis of pSTAT5 in c-kit+ BM blasts from representative patients with AML reveals a significantly increased STAT5 activation in FLT3-TKD/NPM1c cells compared with FLT3-TKD/NPM1 wt cells (FLT3-TKD/NPM1c: n = 4 patients; FLT3-TKD/NPM1 wt: n = 4 patients). (J) Representative immunohistochemical staining of pSTAT5 in BM from patients with AML with cooccurred FLT3-TKD and NPM1c mutations shows increased positivity for pSTAT5 (red color) compared with samples from patients harboring FLT3-TKD together with NPM1 wt. (K) Flow cytometric analysis of BM cells from patients with AML reveals significantly decreased FLT3-TKD surface levels in NPM1c+ compared with NPM1 wt patient cells (FLT3-TKD/NPM1c: n = 5 patients; FLT3-TKD/NPM1 wt: n = 6 patients). *P < .05 and ***P < .001, by unpaired, 2-tailed Student t test (panels B, E, F, I and K).
Presence of NPM1c shifts FLT3-D835Y localization to the endoplasmic reticulum. (A) Flow cytometry analysis of FLT3 surface expression reveals reduced FLT3-D835Y expression on the surface in NPM1c+ cells (blue) compared with NPM1 wt cells (green). FLT3-D835Y expression in NPM1c+ cells is comparable to FLT3-ITD surface expression (red). Gray peaks represent isotype controls. (B) Statistical analysis of FLT3-D835Y surface mean fluorescence intensity in NPM1c+ cells compared with NPM1 wt cells (n = 3). (C) Immunofluorescence staining shows colocalization of FLT3-D835Y with the ER marker Calnexin in murine NPM1c+ EGFP+ BM. (D) Immunofluorescence staining shows colocalization of FLT3-D835Y with the ER marker PDI in a NPM1c+ AML cell line (OCI-AML3), but not in NPM1 wt expressing HL-60 cells. (E) Mander’s coefficient analysis for colocalization of FLT3 with Calnexin in murine FLT3-D835Y+ NPM1c+ BM cells (n = 9 images with 49 cells) and in FLT3-D835Y+ NPM1 wt BM cells (n = 6 images with 189 cells). (F) Mander’s coefficient analysis for colocalization of FLT3-D835Y with PDI in OCI-AML3 (n = 6 images with 169 cells) and HL-60 cells (n = 4 images with 57 cells). (G) Immunoblot analysis of AML cell line lysates reveals expression of underglycosylated ER-localized 130-kDa form of FLT3-D835Y and FLT3-ITD in OCI-AML3, but not in HL-60, cells. (H) Co-immunoprecipitation of FLT3 shows interaction with NPM1c in OCI-AML3 FLT3-D835Y cells, low interaction in OCI-AML3 FLT3-ITD and no interaction in HL-60 FLT3-D835Y (negative control) cells. (I) Intracellular flow cytometric analysis of pSTAT5 in c-kit+ BM blasts from representative patients with AML reveals a significantly increased STAT5 activation in FLT3-TKD/NPM1c cells compared with FLT3-TKD/NPM1 wt cells (FLT3-TKD/NPM1c: n = 4 patients; FLT3-TKD/NPM1 wt: n = 4 patients). (J) Representative immunohistochemical staining of pSTAT5 in BM from patients with AML with cooccurred FLT3-TKD and NPM1c mutations shows increased positivity for pSTAT5 (red color) compared with samples from patients harboring FLT3-TKD together with NPM1 wt. (K) Flow cytometric analysis of BM cells from patients with AML reveals significantly decreased FLT3-TKD surface levels in NPM1c+ compared with NPM1 wt patient cells (FLT3-TKD/NPM1c: n = 5 patients; FLT3-TKD/NPM1 wt: n = 6 patients). *P < .05 and ***P < .001, by unpaired, 2-tailed Student t test (panels B, E, F, I and K).
Evidence accumulates that cytoplasmic NPM1 alters the localization of signaling molecules by direct interaction.17 In FLT3 coimmunoprecipitations, we demonstrate interaction of FLT3-TKD with NPM1c, but not with NPM1 wt (Figure 2H; supplemental Figure 6A), which may explain the altered localization of FLT3-TKD and differences in downstream signaling. To identify the essential domains/residues for the FLT3-D835Y-NPM1c interaction, we generated different mutants and were able to show that the c-terminal part of the FLT3 kinase domain is indispensable for NPM1c binding (supplemental Figure 6B-C). Interestingly, we could show that phosphorylation of FLT3 at amino acid 835 is crucial for NPM1c interaction by creating phospho-mimic (D835F) and phospho-deficient mutants (D835E) of FLT3 (supplemental Figure 6D-E). In conclusion, phosphorylated FLT3-835 interacts with NPM1c, thereby leading to its intracellular localization and activation of STAT5.
To analyze the clinical significance of our results, we expanded our analysis to primary AML BM samples with either FLT3-TKD mutation alone or in combination with NPM1c. For detailed patient characteristics, see supplemental Table 2. Consistent with the murine data, FLT3-TKD+ NPM1c+ patient samples showed a significantly increased pSTAT5 signal compared with FLT3-TKD+ NPM1 wt samples by intracellular flow cytometry (Figure 2I; supplemental Figure 7A) and immunohistochemical stainings (Figure 2J). Furthermore, FLT3-TKD+ NPM1c+ AML patient blasts showed a reduction in FLT3 surface levels as well as increased ER localization of FLT3 compared with FLT3-TKD+ NPM1 wt blasts (Figure 2K; supplemental Figure 7B-C). Interestingly, recent human studies suggest that presence of NPM1c significantly changes the prognosis of FLT3-TKD-positive patients,18 thereby emphasizing the need for elucidating mechanistic links between FLT3-TKD and NPM1c in molecular and murine model studies.
In conclusion, we demonstrate that FLT3-TKD and NPM1c cooperate to induce a myeloid disease with short latency. Furthermore, we describe a novel role for NPM1c influencing the signaling properties of FLT3-TKD by its retention at the ER. Analysis of human AML cells resembled the results from the FLT3-TKD+ NPM1c mouse model, which might be a useful tool for diagnostics and therapeutic improvements of this defined AML subgroup.
For original data, please contact: lena.illert@uniklinik-freiburg.de
The online version of this article contains a data supplement.
The publication costs of this article were defrayed in part by page charge payment. Therefore, and solely to indicate this fact, this article is hereby marked “advertisement” in accordance with 18 USC section 1734.
Acknowledgments
The authors thank D. Herchenbach and M. Follo for fluorescence-activated cell sorting.
This study was supported by research grants from the Deutsche José Carreras Leukämie-Stiftung (DJCLS R08/02 and DJCLS 02FN/2017) (T.A.M.), a Deutsche Forschungsgemeinschaft grant (FOR 2033) (J.D. and T.A.M.), and a grant of the German cancer consortium (DKTK L693) (A.L.I.). A.L.I and T.P. were supported by the European Union Horizon 2020 Marie Sklodowska-Curie Innovative Training Network (grant no. 675712). A.L.I. was further supported by a research grant from University Clinic Freiburg and from the government Baden-Württemberg.
Authorship
Contribution: A.R., T.A.M., J.D., and A.L.I. conceived of and designed the experiments; A.R., T.A.M., and A.L.I. analyzed the data; A.R., T.A.M., C.K., T.P., T.R., A.S.-G., and A.G. performed the experiments; S.K., S.P.G., P.P., C.B., R.Z., G.S.V., and A.B. provided critical materials; A.R., T.A.M., and A.L.I. wrote the manuscript; and all authors edited the manuscript.
Conflict-of-interest disclosure: The authors declare no competing financial interests.
Correspondence: Anna Lena Illert, Department of Hematology and Oncology, Freiburg University Medical Center, Albert-Ludwigs-University of Freiburg, D-79106 Freiburg, Germany; e-mail: lena.illert@uniklinik-freiburg.de.

This feature is available to Subscribers Only
Sign In or Create an Account Close Modal