

Key Points
Gait speed is a marker of frailty and can independently predict survival and hospital utilization among older patients with blood cancers.
Assessing gait speed in oncology clinics may substantially improve patient assessment, prognostication, and individualization of care.

Abstract
This study aimed to evaluate whether gait speed and grip strength predicted clinical outcomes among older adults with blood cancers. We prospectively recruited 448 patients aged 75 years and older presenting for initial consultation at the myelodysplastic syndrome/leukemia, myeloma, or lymphoma clinic of a large tertiary hospital, who agreed to assessment of gait and grip. A subset of 314 patients followed for ≥6 months at local institutions was evaluated for unplanned hospital or emergency department (ED) use. We used Cox proportional hazard models calculated hazard ratios (HRs) and 95% confidence intervals (CIs) for survival, and logistic regression to calculate odds ratios (ORs) for hospital or ED use. Mean age was 79.7 (± 4.0 standard deviation) years. After adjustment for age, sex, Charlson comorbidity index, cognition, treatment intensity, and cancer aggressiveness/type, every 0.1-m/s decrease in gait speed was associated with higher mortality (HR, 1.20; 95% CI, 1.12-1.29), odds of unplanned hospitalizations (OR, 1.33; 95% CI, 1.16-1.51), and ED visits (OR, 1.34; 95% CI, 1.17-1.53). Associations held among patients with good Eastern Cooperative Oncology Group performance status (0 or 1). Every 5-kg decrease in grip strength was associated with worse survival (adjusted HR, 1.24; 95% CI, 1.07-1.43) but not hospital or ED use. A model with gait speed and all covariates had comparable predictive power to comprehensive validated frailty indexes (phenotype and cumulative deficit) and all covariates. In summary, gait speed is an easily obtained “vital sign” that accurately identifies frailty and predicts outcomes independent of performance status among older patients with blood cancers.
Introduction
Age is an increasingly important risk factor for cancer as life expectancy continues to rise worldwide.1 As age increases, so does the prevalence of frailty, a state of decreased physiologic reserve associated with vulnerability to disability and death.2 Measures of frailty are often more accurate in predicting important clinical outcomes than chronologic age.3,4 Frailty may be particularly prevalent among older patients with hematologic malignancies; more than half have evidence of malnutrition, and more than a third have impaired physical function.5 Moreover, hematologic malignancies and their treatment can lead to frailty in a patient of any age. Whatever its source, frailty is associated with increased chemotherapy-related toxicity, poor response to therapy, and mortality in solid and hematologic malignancies.6-8 Accordingly, leading professional organizations, such as the American Society of Clinical Oncology (ASCO) and the National Comprehensive Cancer Network, now recommend that geriatric and frailty assessments be incorporated into the routine care of older patients with cancer.4,9
Physician-assigned performance status (PS) is commonly used to assess functional status10 and predict tolerance to cancer treatment11 ; however, it does not adequately capture frailty.12,13 Indeed, geriatric assessment can identify previously undetected vulnerabilities in patients thought to have good to excellent PS (0-1) by traditional assessment.14-17 Although the majority of cancer patients are 65 years or older, geriatric assessment tools are rarely used in oncology practice, likely because of a lack of time, experience, or resources.18 Brief screening tests for frailty that can easily fit into the clinic workflow and predict important clinical outcomes are needed.
Gait speed and grip strength are easily obtainable objective measures of physical function that take no more time to measure than a typical vital sign. Gait speed19-23 accurately predicts mortality, disability, and hospitalizations across populations worldwide. Recent guidelines by ASCO recommend gait speed as a practical assessment of function and physical performance in older adults with cancer.9 Several studies identify an association between grip strength and survival.24-26 Grip strength is primarily a measure of physical function and is not as well established as gait speed as a marker of frailty, but it may be useful in patients who are nonambulatory. Gait speed requires only a stopwatch and a short 4-m course, whereas grip strength can be quantified in a few seconds using a dynamometer. Despite the growing evidence, few studies have investigated the potential utility of these measures in patients with hematologic malignancies.27
We sought to determine the value of 2 brief functional tests, previously associated with frailty status, in predicting important clinical outcomes. We hypothesized that gait speed and grip strength would be closely correlated with validated measures of frailty, the Fried phenotype model28,29 and the Rockwood cumulative deficit index,29,30 and strongly predict the survival and the risk of acute care hospitalization. The purpose of our analysis was to examine the potential value of gait speed or grip strength as a screening test for frailty in older patients with blood cancers that could be easily integrated into the workflow of a busy clinic.
Methods
Patient population
All patients aged 75 years and older who presented for an initial consultation in the myelodysplastic syndrome (MDS)/leukemia, myeloma, or lymphoma clinics of the Dana-Farber Cancer Institute between 1 February 2015 and 31 October 2017 were eligible for participation. The patient population is the same as in our previous study (n = 360)31 but with extended enrollment. We excluded patients referred for transplantation consultation. Of the 541 consecutive patients approached in this interval, 464 consented and 16 were lost to follow-up, leaving 448 (83%) for analysis. Eligible patients were given an appointment with a research assistant and received a patient packet with details on frailty screening, to be conducted by the assistant, before their first meeting with the oncologist. The assistant was trained in frailty screening by a board-certified geriatrician and was carefully observed before performing the test independently. Among consented individuals, 272 had an Eastern Cooperative Oncology Group (ECOG) PS recorded in the medical record by the oncologist at their initial visit. The study was approved by the Dana-Farber/Harvard Cancer Center Office for the Protection of Human Research Subjects.
Predictors
Gait speed and grip strength were measured in all 448 consented patients. Gait speed was obtained using the National Institutes of Health 4-m gait speed test.32 From a standing start, participants were asked to walk at a usual pace (normal gait speed) for 4 meters using distinct landmarks, and the speed was recorded in meters per second (m/s) using a stopwatch. Patients who were nonambulatory (n = 31) were recorded as having a gait speed of 0.33 Grip strength was measured using a Jamar Hydraulic Hand Dynamometer (Sammons Preston Roylan, Bolingbrook, IL) once with each hand; the strength (in kilograms) of the dominant hand, determined by the dynamometer, was used in this study.34 ECOG PS was measured on an ordinal scale from 0 to 5, as defined by ECOG.10,11 Screening tests for cognitive impairment included recall of 5 words after a 5-minute delay (as measured by 5-word recall from the Montreal Cognitive Assessment35,36 ) and the Clock-in-the-Box (CIB),37,38 a variation on the clock-drawing test that measures executive function. Patients were considered to have probable cognitive impairment if they had ≥2 errors on the 5-word recall or ≥4 errors on the CIB, as defined in our previous article.31
The phenotype frailty model takes into account unintentional weight loss, self-reported exhaustion, low energy expenditure, slow gait speed, and weak grip strength (supplemental Appendix, available on the Blood Web site). Patients with ≥3 of these factors are categorized as “frail,” people with 1 or 2 factors are considered “prefrail,” and people with no factors are considered “robust.”28,29 For the cumulative deficit index, the total number of deficits is determined by adding all deficits present (deficit present = 1, deficit absent = 0, and for some variables, partial deficit = 0.25, 0.5, or 0.75) and dividing the sum by the total number of items in the index, resulting in a continuous score. After calculating a total frailty score on the 0 to 1 scale, cut points of 0 to 0.2 for “robust,” 0.2 to 0.35 for “prefrail,” and 0.35 to 1 for “frail” were used to categorize patients, as in the study by Sheppard et al.39 We used a frailty index comprising 42 items, as defined in the supplemental Appendix.
Baseline characteristics, including sex, age, cancer aggressiveness, treatment intensity, and Charlson comorbidity index (CCI) were abstracted from the medical records. As in our prior work,11,31 hematologic malignancies were categorized as aggressive (diffuse large B cell lymphoma, mantle cell lymphoma, multiple myeloma, acute myeloid leukemia, and acute lymphocytic leukemia) or indolent (marginal zone lymphoma, follicular lymphoma, chronic lymphocytic leukemia, monoclonal gammopathy of unknown significance, MDS, myeloproliferative neoplasm/myeloproliferative disease, Waldenstrom hypergammaglobulinemia, and hairy cell leukemia). We also categorized cancers by type, including myeloid neoplasms (myeloproliferative neoplasm, MDS, acute myeloid leukemia [AML]), plasma cell neoplasms (multiple myeloma, Waldenstrom hypergammaglobulinemia), and non-Hodgkin lymphomas (NHLs; NHL, chronic lymphocytic leukemia, diffuse large B cell lymphoma, marginal zone lymphoma). Treatments were categorized as intensive or nonintensive. Nonintensive treatment consisted of no treatment (including surveillance) or supportive/less intensive treatment (only receiving erythropoiesis-stimulating agents, blood transfusions, or significantly dose-reduced chemotherapy). Hypomethylating agents used as monotherapy or combined with other supportive treatments for the purpose of low-intensive therapy were also categorized as nonintensive.
Outcome measures
All patients (n = 448) had ≥6 months of follow-up on their survival status, with their date last seen determined by a combination of chart review and calls to their primary provider. We identified a subset of 314 patients who were followed at the Dana-Farber/Harvard Cancer Center or an affiliated institution (community or academic) for 6 months following initial consultation. These individuals were included in the analyses of emergency department (ED) visits and unplanned hospitalizations (elective procedures or planned treatment were excluded). This analysis was limited to patients followed in our own health care system because we did not have permission to request records from outside institutions.
Data analysis
We reported descriptive means and proportions for baseline characteristics, including age, sex, disease aggressiveness, treatment type, CCI, cognition (Montreal Cognitive Assessment and CIB), and gait speed. The Student t test was used to calculate the relationship between cognitive impairment metrics and gait speed. We examined gait speed as a continuous variable in 0.1-m/s increments,16,22 which corresponds to a large clinically meaningful difference,40 and grip strength as a continuous variable41 in 5-kg increments. We used spline regression to verify the appropriateness of modeling gait speed and grip strength as linear variables.
We used Cox proportional hazards regression to evaluate the relationship between gait speed or grip strength and survival, adjusting for baseline characteristics. The proportionality of the hazards assumption was verified using Schoenfeld residual plots and testing for interaction with log person-time.42 We performed interaction analyses between gait speed/grip strength and cancer aggressiveness or cancer type for the same Cox regression models. We then performed subgroup analyses, assessing the association between gait speed and survival within each cancer type, adjusting for covariates aside from cancer aggressiveness. Incident death, 1-year survival, 2-year survival, and median survival rates for intervals of gait speed (<0.4, 0.4-0.6, 0.6-0.8, and >0.8 m/s, categorized in 0.2-m/s increments for graphical purposes22 ) were calculated using Kaplan-Meier survival curves. We chose the highest cutoff (≥0.8 m/s), because there were relatively few individuals with a gait speed ≥1.0, another commonly used cutoff. In the subset of patients followed in affiliated hospitals, we assessed the relationship of gait speed or grip strength with any unplanned hospitalizations or ED visits within 6 months of cohort entry using multivariable logistic regression.
Subgroup analyses were conducted among the patients with a physician-reported ECOG PS. First, models of gait speed or grip strength adjusted for baseline characteristics and ECOG PS were analyzed for survival, unplanned hospitalizations, and ED visits. We repeated these analyses in a subset of patients with very good PS (ECOG 0-1).
The concordance statistic (c-statistic, also known as area under the receiver operating curve) was calculated to compare the discrimination of various models.43 The frailty phenotype was included in models as a categorical variable, and the cumulative deficit index was included as a continuous variable. Differences ≥ 0.025 were considered clinically relevant improvements in discrimination.44
Results
Demographics
Mean age was 79.7 (± 4.0 standard deviation [SD]) years, and participants were followed for a mean of 13.8 (± 9.4 SD) months. Mean gait speed was 0.73 m/s (± 0.26 SD), and mean grip strength was 24.6 kg (± 9.2 SD). Approximately one quarter of patients (24.6%) died during follow-up. Among the subset of patients followed for unplanned hospitalizations and ED visits (n = 314), 19.1% (60) had an unplanned hospitalization, and 16.8% (53) had an ED visit. A total of 60.7% (272) of patients had a physician-evaluated ECOG PS at initial consult. Baseline characteristics were not significantly different between the subset with hospital follow-up and the rest of the cohort or between the subset with ECOG PS and the rest of the cohort (data not shown). Mean gait speed was lower in those with probable impairment in short-term memory (0.78 m/s vs 0.59 m/s, P < .001) or executive function (0.76 m/s vs 0.60 m/s, P < .001). Complete demographic characteristics are shown in Table 1.
Baseline cohort characteristics (N = 448)
| % (n) | |
|---|---|
| Age (n = 448), y | |
| 75-79 | 55.8 (250) |
| 80-84 | 31.0 (139) |
| 84+ years | 13.2 (59) |
| Sex (n = 448) | |
| Female | 34.8 (156) |
| Male | 65.2 (292) |
| Treatment type (n = 415) | |
| Nonintensive* | 45.3 (188) |
| Intensive | 54.7 (227) |
| Cancer aggressiveness (n = 448) | |
| Aggressive† | 62.5 (280) |
| Indolent‡ | 37.5 (168) |
| Cancer type (n = 448) | |
| Myeloid neoplasms§ | 17.6 (79) |
| Plasma cell neoplasms¶ | 30.6 (137) |
| NHLs|| | 28.6 (128) |
| Other | 23.2 (104) |
| CCI#(n = 448) | |
| <3 | 36.2 (162) |
| 3-4 | 40.0 (179) |
| 5+ | 23.9 (107) |
| 5-word delayed recall (n = 448) | |
| Probable impairment (≥2 errors) | 18.3 (82) |
| Normal (0 or 1 error) | 81.7 (366) |
| Executive function (n = 448) | |
| Probable impairment (CIB score < 5) | 22.5 (101) |
| Normal (CIB score = 5-8) | 77.5 (347) |
| ECOG PS (n = 272) | |
| 0 | 44.1 (120) |
| 1 | 38.6 (105) |
| 2 | 12.9 (35) |
| 3 | 4.4 (12) |
| Gait speed, m/s (n = 448) | |
| <0.40 | 7.8 (35) |
| 0.40-0.60 | 13.2 (59) |
| 0.60-0.80 | 35.0 (157) |
| ≥0.80 | 44.0 (197) |
| Grip strength, kg (n = 448) | |
| <20 | 38.6 (173) |
| 20-30 | 33.3 (149) |
| >30 | 28.1 (126) |
| Phenotype frailty index (n = 448) | |
| Robust (0) | 31.0 (139) |
| Prefrail (1-2) | 57.2 (256) |
| Frail (3+) | 11.8 (53) |
| Cumulative deficit index (n = 448) | |
| Robust (0-0.2) | 49.1 (220) |
| Prefrail (0.2-0.35) | 35.3 (158) |
| Frail (0.35-1) | 15.6 (70) |
Nonintensive treatment included no treatment or only erythropoiesis-stimulating agents, blood transfusions, or significantly dose-reduced chemotherapy.
Aggressive malignancies included AML, multiple myeloma (MM), acute lymphoblastic leukemia, mantle cell lymphoma, and diffuse large B-cell lymphoma (DLBCL).
Indolent malignancies included MDS, chronic lymphocytic leukemia (CLL), myeloproliferative neoplasms (MPNs), marginal zone lymphoma (MZL), follicular lymphoma, hairy cell leukemia, monoclonal gammopathy of unknown significance, smoldering myeloma, and Waldenstrom hypergammaglobulinemia.
Myeloid neoplasms included MPN, MDS, and AML.
Plasma cell neoplasms included MM and Waldenstrom hypergammaglobulinemia.
NHLs included CLL, NHL, DLBCL, and MZL.
Comorbidities were assigned point values based on severity and then summed using Charlson criteria.
Gait speed
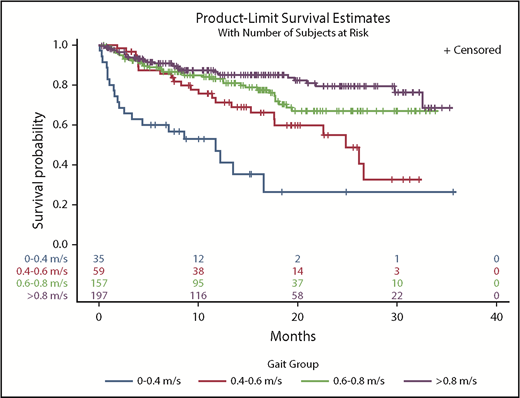
In a univariate model, every 0.1-m/s decrease in gait speed was associated with increased hazard ratios (HRs) for death (HR, 1.22; 95% confidence interval [CI], 1.15-1.30). Adjustment for covariates did not change the results (HR, 1.20; 95% CI, 1.12-1.29) (Table 2). There was a significant interaction between gait speed and cancer type on survival outcomes (interaction, P = .008). Adjusted gait speed had the strongest association in the subgroup of patients with NHL (HR, 1.53; 95% CI, 1.25-1.89) compared with those with AML (HR, 1.21; 95% CI, 1.04-1.41), plasma cell neoplasms (HR, 1.24; 95% CI, 1.03-1.49), or other malignancies (HR, 1.38; 95% CI, 1.08-1.75). There was no significant interaction between gait speed and cancer aggressiveness (interaction, P = .43). In Kaplan-Meier analysis, gait speed in ordinal categories was an incremental predictor of median, 1-year, and 2-year survival (Table 3). Distinct survival curves could be generated across gait categories (log-rank test, P < .001) (Figure 1), even in the subset of patients with very good PS (ECOG PS 0-1) (log-rank test, P = .001) (Figure 2). Every 0.1-m/s decrease in gait speed was associated with a 33% increase in the odds of unplanned hospitalization (odds ratio [OR], 1.33; 95% CI, 1.16-1.51) and a 34% increase in the odds of ED visits (OR, 1.34; 95% CI, 1.17-1.53) in the fully adjusted model.
Multivariable model: association of gait speed and rate of death
| Variable | Overall HR (95% CI) | P |
|---|---|---|
| Gait (per 0.10-m/s decrease) | 1.20 (1.12-1.29) | <.0001 |
| Age (per year) | 1.06 (1.00-1.11) | .03 |
| CCI (per point) | 1.02 (0.92-1.14) | .69 |
| Male (vs female) | 1.47 (0.92-2.34) | .11 |
| Intensive treatment (vs nonintensive) | 1.13 (0.72-1.78) | .60 |
| Aggressive malignancy (vs nonaggressive) | 1.54 (0.99-2.40) | .055 |
| 5-word recall (probable impairment vs normal) | 1.98 (1.26-3.13) | .003 |
| Executive function (probable impairment vs normal) | 0.68 (0.39-1.19) | .17 |
Survival estimates by gait speed categories
| Gait, m/s | Deaths (per 100 person-years) | Median OS (mo) | 1-y OS (%)* | 2-y OS (%)* | Log-rank test |
|---|---|---|---|---|---|
| ≥0.80 | 12.85 | NA (>35) | 85.7 ± 5.6 | 79.3 ± 7.4 | <.0001 |
| 0.60-0.80 | 19.77 | NA (>35) | 83.0 ± 6.3 | 66.9 ± 9.8 | |
| 0.40-0.60 | 33.20 | 24.9 | 71.2 ± 12.3 | 54.8 ± 16.4 | |
| <0.40 | 84.86 | 11.8 | 47.0 ± 18.7 | 26.4 ± 21.1 |
NA, not applicable (median OS has not been reached).
Data are mean ± standard deviation.
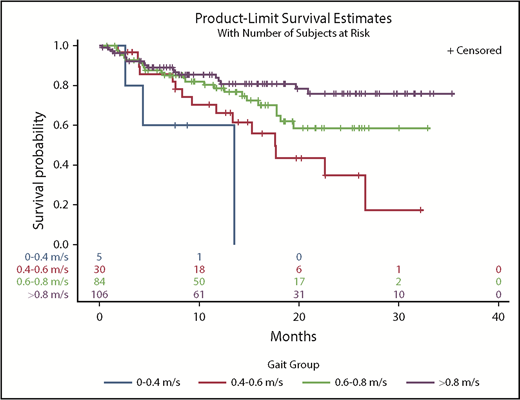
Kaplan-Meier survival curves by gait speed categories in the subset of patients with very good PS (ECOG = 0 or 1).
Kaplan-Meier survival curves by gait speed categories in the subset of patients with very good PS (ECOG = 0 or 1).
Gait speed (per 0.1-m/s decrease) remained an independent predictor of mortality after including ECOG PS in the fully adjusted model (HR, 1.12; 95% CI, 1.01-1.24; P =.03). In the subset of patients with very good PS, gait speed had an even greater predictive value, with each 0.1-m/s decrease corresponding to an HR of 1.27 (95% CI, 1.10-1.48) in the fully adjusted model (Table 4). After adjustment for PS and all of the other covariates, decreased gait speed (per 0.1 m/s) was associated with an increased odds of ED visits (OR, 1.33; 95% CI, 1.10-1.61), but the association with unplanned hospitalizations did not remain statistically significant (OR, 1.19; 95% CI, 0.99-1.43). In the subset with ECOG PS 0-1, gait speed (per 0.1-m/s decrease) was associated with unplanned hospitalizations (OR, 1.39; 95% CI, 1.07-1.77) and ED visits (OR, 1.39; 95% CI, 1.08-1.78). A frequency table of gait speed by ECOG status shows that low gait speeds, particularly in the 0.4 to 0.6–m/s range, are prevalent among those with good ECOG PS (Table 5).
Multivariable model: association of gait speed and rate of death (subset ECOG 0-1)
| Variable | Overall HR (95% CI) | P |
|---|---|---|
| Gait (per 0.10-m/s decrease) | 1.27 (1.10-1.48) | .0016 |
| Age (per year) | 1.07 (1.01-1.13) | .027 |
| CCI (per point) | 1.03 (0.87-1.21) | .76 |
| Male (vs female) | 2.08 (1.06-4.09) | .033 |
| Intensive treatment (vs nonintensive) | 1.37 (0.75-2.52) | .30 |
| Aggressive malignancy (vs nonaggressive) | 1.40 (0.76-2.56) | .28 |
| 5-word recall (probable impairment vs normal) | 1.32 (0.71-2.45) | .39 |
| Executive function (probable impairment vs normal) | 0.75 (0.37-1.55) | .44 |
Frequency of gait speed by ECOG PS
| ECOG PS | ΓCOG PSncd (m/s) | |||
|---|---|---|---|---|
| <0.40 | 0.40-0.60 | 0.60-0.80 | ≥0.80 | |
| 0 | 1 | 12 | 40 | 67 |
| 1 | 4 | 18 | 44 | 39 |
| 2 | 11 | 7 | 11 | 6 |
| 3 | 8 | 2 | 2 | 0 |
| ECOG PS | ΓCOG PSncd (m/s) | |||
|---|---|---|---|---|
| <0.40 | 0.40-0.60 | 0.60-0.80 | ≥0.80 | |
| 0 | 1 | 12 | 40 | 67 |
| 1 | 4 | 18 | 44 | 39 |
| 2 | 11 | 7 | 11 | 6 |
| 3 | 8 | 2 | 2 | 0 |
A model containing gait speed and all covariates in the study had predictive power comparable to the validated frailty indexes (the cumulative deficit and phenotype models) (Table 6).44
Model discrimination (c-statistic)
| 1-year survival | 2-year survival | Unplanned hospitalizations | ED visits | |
|---|---|---|---|---|
| Covariates* (reference) | 0.734 | 0.721 | 0.640 | 0.688 |
| Gait, covariates | 0.742 | 0.758† | 0.726† | 0.748† |
| Grip, covariates | 0.729 | 0.749† | 0.639 | 0.686 |
| Gait, grip, covariates | 0.750 | 0.788† | 0.727† | 0.750† |
| Phenotype index, covariates | 0.749 | 0.767† | 0.693† | 0.733† |
| Cumulative deficit index, covariates | 0.760† | 0.745 | 0.730† | 0.737† |
Covariates included age, sex, CCI, cognitive function, treatment intensity, and cancer aggressiveness.
A difference of 0.025 from reference was considered clinically relevant better discrimination.44
Grip strength
A decrease in grip strength of 5 kg was associated with a 24% increased rate of death in the fully adjusted model (HR, 1.24; 95% CI, 1.07-1.43) and remained a significant predictor of mortality after controlling for ECOG PS (HR, 1.26; 95% CI, 1.04-1.52). These associations remained significant with gait speed in the model (fully adjusted HR, 1.25; 95% CI, 1.03-1.51). Among those with ECOG 0 to 1, each 5-kg decrease in grip strength corresponded to a fully adjusted HR for death of 1.24 (95% CI, 1.02-1.51) but not with gait speed in the model (HR, 1.17; 95% CI, 0.95-1.44). Grip strength was not associated with the odds of ED visits or unplanned hospitalizations. Grip strength improved the discrimination of models for 2-year survival, but none of the other outcomes (Table 6). Similarly, if both grip and gait were available, compared with only gait speed, discrimination was markedly improved for 2-year survival but not the other outcomes.
Discussion
In our cohort of older adults with hematologic malignancies, gait speed predicted survival, unplanned hospitalizations, and ED visits, independent of cognitive status, demographic, and cancer-related risk factors. Grip strength was predictive of survival but not acute care utilization. Gait speed remained an independent predictor of outcomes, regardless of cancer aggressiveness, across all categories of cancer type and even in the subset of patients with good ECOG PS. A model with gait speed and all covariates had a predictive power that was comparable to comprehensive and validated frailty indexes, highlighting the clinical value of this brief and objective measure of function and frailty.
A strong association between walking speed and survival has been documented across populations worldwide.19-22,24,45,46 Studenski and colleagues pooled data from 9 large cohorts to show that gait speed was a linear predictor of mortality, even in very small increments.22 Although 12.5% of this population had a history of cancer, no information on cancer type or severity was given. Another study found a similar linear association among patients with solid tumors.41 In comparison, the relationship between gait speed (per 0.1-m/s decrease40 ) and survival in our study was about twice as strong, likely because our cohort was older and more frail, with an average gait speed of 0.73 m/s compared with 0.93 m/s22 and 1.17 m/s.41 The discrimination of our gait speed models was similar to that seen in other populations.22,47 Our analyses are consistent with prior work showing that gait speed predicts unplanned acute care utilization, an important signal of treatment-related toxicity.19,20,23,48 Hospitalization itself has been linked to future disability and mortality in older adults, especially in those who are frail.29 In a recent study, a majority of older hospitalized adults experienced a clinically significant decrease in mobility in the first month after hospitalization, and many did not recover.49
In a study involving older adults with AML, Klepin and colleagues50 found that the Short Physical Performance Battery (SPPB), a 5-minute assessment including gait speed, predicted survival and added explanatory power beyond traditional prognostic variables, including age, ECOG PS, and cytogenic risk group.50 Various physical performance measures have been shown to be effective in predicting clinical outcomes in cancer patients.51 We chose 4-m gait speed because it is known to be comparable to the SPPB and other commonly used measures33 in head-to head comparisons but is substantially more clinically feasible; it takes <1 minute and can be obtained with other vital signs as the patient walks through the clinic.
Longer tests, such as the SPBB and the 6-minute walk, may be too strenuous for frail adults, whereas gait speed is valid even in patients who use walking aids.52 As a continuous measure, gait speed is sensitive, reliable, and highly responsive to change over time.53 Although brief, the “Timed Up and Go” test54 uses categorized gait speed, thus losing important predictive information. It may also be less safe in a frail population, because it requires turning, rising, and sitting. Some clinics may even be able to measure gait by modifying clinician- and patient-wearable global positioning systems used for rooming and patient tracking. Training videos readily available through the National Institute on Aging Web site help to standardize assessment.55 In addition to watching the videos, our staff training involved the evaluation of 5 measurements and assessment of competency by a physician.
We show that gait speed has a predictive power that is comparable to models that include multidomain frailty measures. Gait is a higher-order function that represents the integration of multiple physiological systems, including the central and peripheral nervous systems, perceptual system, musculoskeletal system, and energy production and/or delivery.56 Mobility decline has been linked to many age-related conditions, including sarcopenia, abnormal inflammation and energetics, neuropathy, depression, and cognitive impairment.57-59 Therefore, gait speed provides a global measure of functional status that may be less susceptible to the subjective biases of PS.11 However, our findings support current ASCO guidelines that both measures are valuable and have their place in global assessment.9
Grip strength is not as well established as gait speed as a predictor of clinical outcomes.24-26 Grip strength cutoffs are gender based, making interpretation and implementation more challenging. Results from studies of grip strength and survival among patients with solid tumors have been conflicting.41,60,61 In our population, grip strength independently predicted survival but not acute care utilization. Moreover, gait speed models were superior to those with grip strength for all studied outcomes. This is not surprising, because gait speed integrates information on multiple physiologic factors,56 whereas grip strength is primarily a measure used in defining sarcopenia. Nevertheless, grip strength may be useful in those patients for whom a gait speed cannot be acquired.
Strengths of our study include a high participation rate, the large size of our cohort, our assessment of functional measures, and our ability to follow prospectively for outcomes. In addition, we were able to directly compare the discriminatory power of gait speed with well-validated comprehensive frailty metrics. Limitations include the fact that our data were derived from a single institution and that our results from a large academic tertiary center may not be completely generalizable to community oncology practice. Moreover, our assessment for acute care utilization introduced competing risks due to early deaths; however, we argue that, clinically, assessing these additional outcomes would be most valuable among the cohort of patients who did not experience early death. Considering gait speed’s predictive value, future studies should assess the utility of interventions to improve gait speed, such as avoiding sedating medications or taking advantage of physical therapy and walking aids.
In summary, we demonstrate that gait speed is an important predictor of survival and hospital utilization, among older patients with blood cancers, that can stratify risk, even in patients considered low risk by PS. It is a representative geriatric index of frailty and function that performed well, even compared with more comprehensive frailty assessments. Grip strength may be useful as a marker of survival in patients for whom a gait speed is not possible or practical. The integration of such direct measures of physical function into routine clinical care could substantially improve patient assessment, prognostication, and individualization of care. In other fields, gait speed is already being adopted as a “functional” vital sign.62 Our work supports the integration of gait speed into routine clinical assessment and clinical trials of blood cancer patients, where it could serve as an important predictor, as well as an outcome, tracking changes in function and frailty over time while patients are on novel or existing therapies.
Presented in part at the 2018 Annual Scientific Meeting of the American Geriatrics Society, Orlando, FL, 3 May 2018.
Jane A. Driver is the principal investigator and has full access to all of the data used in the study, jane.driver@va.gov.
The publication costs of this article were defrayed in part by page charge payment. Therefore, and solely to indicate this fact, this article is hereby marked “advertisement” in accordance with 18 USC section 1734.
The online version of this article contains a data supplement.
Acknowledgments
The authors thank their beloved colleague Arti Hurria for the inspiration provided to this project and to their careers.
This work was supported in part by National Institutes of Health, National Heart, Lung, and Blood Institute T35 Training Grant HL007479 (M.A.L.), National Institutes of Health National Institute on Aging T32 Training Grant AG000158 (T.T.H.), the Murphy Family Fund from the Dana-Farber Cancer Institute (G.A.A.), and a Clinical Research Scholar Award from the American Cancer Society (G.A.A.). J.A.D. is funded by a Veterans’ Administration Merit Review Award.
The sponsors had no role in the design and conduct of the study; collection, analysis, and interpretation of the data; preparation, review, or approval of the manuscript; or the decision to submit the manuscript for publication.
Authorship
Contribution: M.A.L., J.A.D., and G.A.A. conceived and designed the study; M.A.L., C.D., and A.M. performed the statistical analyses; G.A.A. and J.A.D. supervised the study; M.A.L., C.D., and J.A.D. wrote the manuscript; and all authors acquired, analyzed, or interpreted data and critically revised the manuscript.
Conflict-of-interest disclosure: The authors declare no competing financial interests.
Correspondence: Jane A. Driver, Geriatric Research Education and Clinical Center, VA Boston Healthcare System, 150 S. Huntington Ave, Boston, MA 02130; e-mail: jane.driver@va.gov.
