

Key Points
Comprehensive genomic analyses of PMBL reveal new genetic drivers such as ZNF217.
High mutational burden, MSI, and APOBEC signatures may be additional mechanisms of sensitivity to PD-1 blockade in PMBL.

Abstract
Primary mediastinal large B-cell lymphomas (PMBLs) are aggressive tumors that typically present as large mediastinal masses in young women. PMBLs share clinical, transcriptional, and molecular features with classical Hodgkin lymphoma (cHL), including constitutive activation of nuclear factor κB (NF-κB), JAK/STAT signaling, and programmed cell death protein 1 (PD-1)–mediated immune evasion. The demonstrated efficacy of PD-1 blockade in relapsed/refractory PMBLs led to recent approval by the US Food and Drug Administration and underscored the importance of characterizing targetable genetic vulnerabilities in this disease. Here, we report a comprehensive analysis of recurrent genetic alterations —somatic mutations, somatic copy number alterations, and structural variants—in a cohort of 37 newly diagnosed PMBLs. We identified a median of 9 genetic drivers per PMBL, including known and newly identified components of the JAK/STAT and NF-κB signaling pathways and frequent B2M alterations that limit major histocompatibility complex class I expression, as in cHL. PMBL also exhibited frequent, newly identified driver mutations in ZNF217 and an additional epigenetic modifier, EZH2. The majority of these alterations were clonal, which supports their role as early drivers. In PMBL, we identified several previously uncharacterized molecular features that may increase sensitivity to PD-1 blockade, including high tumor mutational burden, microsatellite instability, and an apolipoprotein B mRNA editing catalytic polypeptide-like (APOBEC) mutational signature. The shared genetic features between PMBL and cHL provide a framework for analyzing the mechanism of action of PD-1 blockade in these related lymphoid malignancies.
Introduction
Primary mediastinal large B-cell lymphoma (PMBL) is a rare aggressive B-cell non-Hodgkin lymphoma (NHL) that is thought to arise from thymic medullary B cells.1 Typically, PMBL occurs in young women who present with large, localized mediastinal masses.1 After its identification in 1986,2-4 PMBL was initially categorized as a subtype of diffuse large B-cell lymphoma (DLBCL). Transcriptional profiling of PMBL revealed reduced expression of B-cell receptor signaling intermediates, including surface immunoglobulin, and constitutive activation of JAK/STAT and nuclear factor κB (NF-κB) signaling cascades, molecular features reminiscent of classical Hodgkin lymphoma (cHL).5-7 In contrast to cHL, PMBL has not been associated with previous Epstein-Barr virus infection.8 The shared clinical, patho-morphologic, and molecular features of PMBL and cHL and the differences between PMBL and DLBCL led to the recognition of PMBL as a distinct lymphoma entity.1
Previous genetic analyses of PMBL defined mechanisms of NF-κB activation, including 2p16.1/REL copy gain5,6,9 and inactivating mutations of TNFAIP3, which encodes the ubiquitin-editing enzyme A20.10 Recently, another negative regulator of the NF-κB pathway, NFKBIE, was found to be inactivated by a 4-bp deletion in PMBLs.11
Additional genetic alterations that increase JAK/STAT signaling in PMBL have been described including loss-of-function mutations of the phosphatase and negative regulator PTPN112 and gain-of-function mutations in STAT613 and IL4R.14 We and others identified a recurrently amplified region on 9p/9p24.1 that includes JAK2 and increases JAK/STAT signaling in PMBL.15-18 Functional data also suggested a disease-essential role of the 9p24.1/JMJD2C-encoded histone demethylase in heterochromatin formation.16
Interestingly, the 9p24.1-amplified region also includes CD274 (PD-L1)/PDCD1LG2 (PD-L2) which increases the expression of these programmed cell death protein 1 (PD-1) ligands and provides a genetic mechanism of immune escape in PMBL.7,15,18 The coamplification of programmed death-ligand 1 and 2 (PD-L1/PD-L2) and JAK2 increases the expression of PD-L1 and PD-L2 both directly by increasing their copy numbers and indirectly by increasing the expression of the ligands via JAK/STAT signaling.15,19 Structural variants (SVs) deregulating PD-L1 and PD-L2 by translocation, inversion, or deletion of the 3′ untranslated region (3′UTR) of PD-L1 have also been reported in PMBL.20
PMBLs exhibit additional genetic alterations leading to immune escape, including SVs of the major histocompatibility complex (MHC) class II transactivator (CIITA) that are reported to decrease MHC class II expression.21,22 Copy loss of the MHC class I and MHC class II regions (hereafter MHCI and MHCII) were also previously described as hallmark features in PMBL.3,18,23,24
In newly diagnosed patients with PMBL, induction therapy includes an anthracycline-based polychemotherapy regimen and an anti-CD20 antibody (rituximab) often followed by consolidation radiotherapy of residual mediastinal masses.25,26 Although this approach results in durable remissions in the majority of these young patients, comorbidities include the long-term complications of directed radiotherapy.25 In addition, patients with relapsed/refractory PMBL have more limited treatment options. The recently demonstrated efficacy of PD-1 blockade with pembrolizumab in relapsed/refractory PMBL27 led to rapid approval by the US Food and Drug Administration and underscored the importance of characterizing targetable genetic vulnerabilities in this disease.
For these reasons, we performed a comprehensive genomic analysis of a representative cohort of newly diagnosed patients with PMBL and compared their genetic signatures to those of the related lymphoid disease, cHL.28 These companion studies provide new insights into shared and unique pathogenetic mechanisms, including bases of response and resistance to PD-1 blockade, in both of these diseases.
Material and methods
Patient characteristics and cell lines
We collected diagnostic biopsy specimens from 37 patients with PMBL, including 2 previously described cases.29 All samples were centrally reviewed by an expert hematopathologist (S.J.R.). The patients characteristics are summarized in supplemental Figure 1 and supplemental Table 1 (available on the Blood Web site). In this cohort, 65% of the biopsy specimens were from frozen tissue and the remainder were from formalin-fixed paraffin-embedded samples; the majority of patients (95%) had no patient-matched normal specimens (supplemental Figure 1; supplemental Table 1). This study was approved by the Institutional Review Board of the Dana-Farber Cancer Institute. Three PMBL cell lines, Farage, Karpas 1106P, and U2940, were obtained from the German Cell Line Collection and were confirmed by short tandem repeat profiling before analysis.
DNA extraction, library preparation, and whole-exome sequencing
DNA extraction, library preparation, and whole-exome sequencing (WES) and SV detection for the frozen tumor samples were performed as recently reported.30 For the cell lines and formalin-fixed paraffin-embedded samples, DNA was extracted and libraries were prepared as previously described18 (see supplemental Methods). All samples with successful library preparation (yielding ≥250 ng of DNA libraries) were taken forward to hybrid capture. Samples were pooled in 3-plex and captured using Agilent SureSelect Human All Exon Exome v5, the custom DLBCL_Rearrangm_v1 bait set, and the Agilent SureSelect hybrid capture kit as previously described.18,30
Quality control, filtering, variant calling, significance analyses, mutational signature analyses, purity/ploidy detection, and immunohistochemistry
Quality controls included matching of the 2 tumor/normal pairs by mass spectrometric fingerprint genotyping, estimation of contamination in samples using ContEst31 and alignment and coverage matrices as previously reported (supplemental Table 1).30 Somatic mutations, somatic copy number alterations (SCNAs) and SVs were detected by using previously described analytical pipelines, including our algorithm for evaluating tumors without paired normal samples.30 SVs were characterized by using a pipeline that combines 4 detection algorithms,30 including BreaKmer,32 Lumpy v0.2.13,33 dRanger,34 SVaBA,35 and validation by BreakPointer.36 Purity and ploidy were inferred using ABSOLUTE.37 Genes more frequently mutated than by chance, candidate cancer genes (CCGs), were identified with MutSig2CV38 and recurrent SCNAs were identified by GISTIC 2.0.39 Details of the mutational signature analysis are described in supplemental Methods. Generation of the gene-by-sample matrix and the mutation density (by tumor type) plot are described in detail in Wienand et al.28 Presence or absence of the apolipoprotein B mRNA editing catalytic polypeptide-like (APOBEC) signature-associated single nucleotide polymorphism (SNP) rs12628403 was detected by MutTect40 in force-calling mode (–force_alleles –force_output) at hg19 site chr22:39358037. All other analyses were performed as previously described.30 Immunohistochemistry and scoring are described in detail in supplemental Methods.
Results
Significantly mutated driver genes
Diagnostic biopsy specimens from 37 patients with PMBL (median age, 34 years; 70%, female) and 3 additional PMBL cell lines (supplemental Figure 1; supplemental Table 1) were subjected to WES with an expanded bait set that captured selected SVs. Because the majority of PMBLs had no patient-matched normal samples (supplemental Figure 1; supplemental Table 1), we applied our recently reported analytical framework and algorithms to analyze WES data in the absence of paired normal specimens.30 After calling single nucleotide variants and indels in individual patients, we applied our MutSig2CV algorithm38 and identified 15 CCGs (q < 0.1; Figure 1A; supplemental Table 2A). As an orthogonal means of prioritizing mutations, we applied CLUMPS, an algorithm that overlays all identified missense mutations onto known 3D structures and detects spatial mutation clustering.41 CLUMPS detected 10 genes with significant 3D clustering (q < 0.25) including 6 CCGs that were also identified by MutSig2CV (supplemental Table 2B). Notably, overlaying the predicted protein changes onto available 3D protein structures provided additional insights into the likely functions of specific alterations, such as mutational clustering in DNA-binding domains of STAT6 and zinc finger protein 217 (ZNF217) and additional protein interaction domains of ZNF21742 (Figure 1B-C).
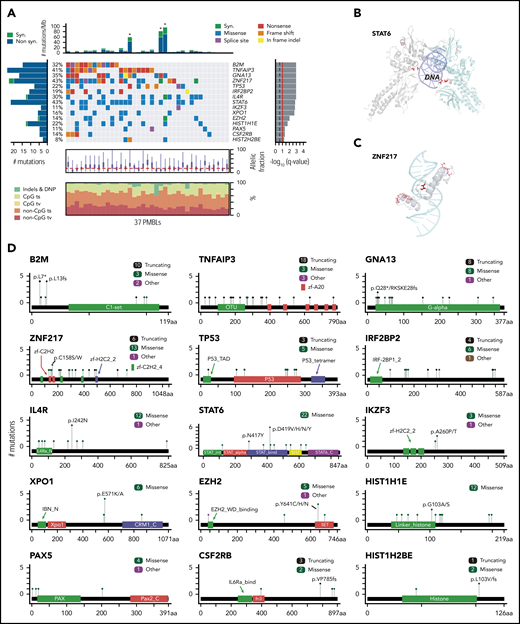
Recurrently mutated genes in PMBL. (A) Comutation plot of recurrently mutated CCGs; gene-by-sample matrix color-coded by mutation type (middle); ranked by significance (MutSig2CV38 q < 0.1, right); number and frequency of recurrent mutations (left); total number of mutations (top); allelic fraction and base substitution distribution of mutations in individual samples (below); Asterisks indicate 3 hypermutator cases; ts, transitions; tv, transversions; DNP, dinucleotide polymorphism. (B-C) Spatial clustering of mutations was discovered with CLUMPS41 ; examples include STAT6 (panel B: PDB: 4y5u; STAT6 dimer is shown with individual molecules in gray and cyan, respectively; DNA in purple) and ZNF217 (panel C: PDB: 2kmk; DNA in cyan). Mutated residues are shown in red and color-intensity and thickness of line scales with number of mutations. (D) Mutation diagrams (lollipop figures) for all significantly mutated genes; aa, amino acid. For each significantly mutated gene (MutSig2CVq < 0.1), all nonsynonymous mutations are visualized within the functional domains of the respective protein using MutationMapper v2.1.0.85,86 Genes are ranked by significance as in (A).
Recurrently mutated genes in PMBL. (A) Comutation plot of recurrently mutated CCGs; gene-by-sample matrix color-coded by mutation type (middle); ranked by significance (MutSig2CV38 q < 0.1, right); number and frequency of recurrent mutations (left); total number of mutations (top); allelic fraction and base substitution distribution of mutations in individual samples (below); Asterisks indicate 3 hypermutator cases; ts, transitions; tv, transversions; DNP, dinucleotide polymorphism. (B-C) Spatial clustering of mutations was discovered with CLUMPS41 ; examples include STAT6 (panel B: PDB: 4y5u; STAT6 dimer is shown with individual molecules in gray and cyan, respectively; DNA in purple) and ZNF217 (panel C: PDB: 2kmk; DNA in cyan). Mutated residues are shown in red and color-intensity and thickness of line scales with number of mutations. (D) Mutation diagrams (lollipop figures) for all significantly mutated genes; aa, amino acid. For each significantly mutated gene (MutSig2CVq < 0.1), all nonsynonymous mutations are visualized within the functional domains of the respective protein using MutationMapper v2.1.0.85,86 Genes are ranked by significance as in (A).
The list of CCGs included genes with known roles in PMBL, such as IL4R14 and TNFAIP310 and mutational drivers in additional B-cell lymphomas (B2M, GNA13, EZH2, STAT6, IKZF3, XPO1, TP53, PAX5) and other cancers (TP53 and XPO1)18,30,43-49 (Figure 1A; supplemental Table 2). Pathway enrichment analysis of the PMBL CCGs with the C2 gene sets of the Molecular Signature Database (MSigDB)50 highlighted the role of these alterations in the interferon-γ (IFN-γ), interleukin-4 (IL-4)/JAK/STAT, and NF-κB signaling pathways (supplemental Figure 2A). All of these pathways were previously reported to be perturbed in PMBL.51
Specifically, we found mutations in STAT6 (43% of patients), IL4R (30%), and CSF2RB (14%) to be CCGs within the JAK/STAT pathway (Figure 1A-C). The mutations in the DNA-binding domain of STAT6 included the p.D419 hotspot that was previously characterized as a gain-of-function alteration in follicular lymphoma (Figure 1A-B,D).46 Moreover, we confirmed the recently described gain-of-function mutations in IL4R, including the hotspot at I242N, in PMBL.14 The mutations in CSF2RB, which encodes the common β-subunit of the granulocyte-macrophage colony-stimulating factor, IL-3, and IL-5, are of note because these receptors all signal via the JAK/STAT pathway (Figure 1A-C).52 We also identified previously unreported recurrent mutations in IRF2BP2 (19%), which encodes a transcriptional cofactor that interacts with IRF2 and modulates IFN-γ–induced PD-L1 expression in certain tumor models (Figure 1A-C).53,54
In addition to confirming the frequent mutations of the negative NF-κB regulator TNFAIP3 (41%),10 we identified recurrent mutations of PAX5 (11%) and IKZF3 (11%), which encode the B-cell transcription factors PAX5 and Aiolos, respectively (Figure 1A,C). Recurrent mutations in TP53 were detected at a frequency (22%) similar to that in DLBCL30 (Figure 1A,C). Interestingly, we also identified hotspot E571K mutations in XPO1 (16%), which encodes an importin-β family member that transports certain proteins and RNAs to the cytosol, including p53 and STAT6 (Figure 1A,C).55,56 These XPO1 hotspot mutations cluster in the cargo recognition groove and increase XPO1 activity, as previously described in PMBL.55-57
PMBLs exhibited several mutations that were previously reported in transcriptionally defined germinal center B-cell DLBCLs.30,47,58 These included GNA13 mutations in 35% of PMBLs and hotspot Y641 mutations in EZH2, the catalytic subunit of the polycomb repressive complex 2 (PRC2) in 14% of these tumors (Figure 1A,D). We also identified mutations in HIST1H1E and HIST1H2BE, histone genes that were also perturbed in a subset of germinal center B-cell DLBCLs.30
We identified frequent mutations in ZNF217 in 43% of PMBLs (6 truncating, 13 missense, 1 other) (Figure 1A-C; supplemental Figure 2B). ZNF217 binds to DNA and recruits several multiprotein complexes that epigenetically regulate gene expression.42,59 Previous studies reported recurrent amplifications of 20q13, which includes ZNF217, in several solid tumors, including breast, colon, and hepatocellular carcinoma.42,59 In certain solid tumor model systems, enforced expression of ZNF217 limited apoptosis, stimulated epithelial-to-mesenchymal transition, and increased proliferation.42 However, the mutational pattern of ZNF217 in PMBL (Figure 1D; supplemental Figure 2B) suggests an inactivating role. ZNF217 transcript levels were similar in the subset of PMBLs with wild-type or mutated ZNF217 and available gene expression profiles (supplemental Figure 2C).
The most significantly mutated gene in our PMBL cohort was B2M, which encodes beta-2-microglobulin (β2M), the invariant chain of the MHC class I. β2M is responsible for the correct intracellular transport of MHC class I molecules to the plasma membrane and is essential for the presentation of endogenously degraded self- and non–self-antigens.60 B2M is also frequently mutated in cHL28,61 and was reported to be infrequently mutated in a targeted analysis of PMBL.62
Notably, we identified additional mutations in previously reported modifiers of JAK/STAT signaling, including SOCS1 (35% [13 of 37] at 32 sites), PTPN1 (14% [5 of 37] at 6 sites), and NF-κB activation, including NFKBIE (19% [7 of 37] at 11 sites), that did not reach statistical significance in our analysis.
Mutational signature analysis
To further define the mutational processes operating in PMBL, we used our SignatureAnalyzer tool63 (Figure 2; supplemental Figure 3; supplemental Table 3) as we recently reported for analyzing DLBCL.30 Interestingly, we discovered that 3 (8%) of 37 patients had a microsatellite instability (MSI) signature associated with defective DNA mismatch repair and MSI (Figure 2A; supplemental Methods). As expected, these 3 samples were associated with a hypermutation phenotype (Figures 1A,2A-B) with a significantly increased number of short indels (P = .0024; 1-tailed Mann-Whitney U test). The molecular bases for the mismatch repair deficiency included frameshift mutations in MLH1 in 2 tumors and biallelic likely inactivating mutations in PMS2 in 2 tumors (1 tumor with cooccurring MLH1 and PMS2 mutations). The observed incidence of MSI-associated hypermutations is similar in PMBL and cHL28 but is significantly higher than the prevalence of MSI in DLBCL (0.3%).30 These findings are noteworthy because MSI has been associated with increased sensitivity to PD-1 blockade in certain solid tumors.64-68
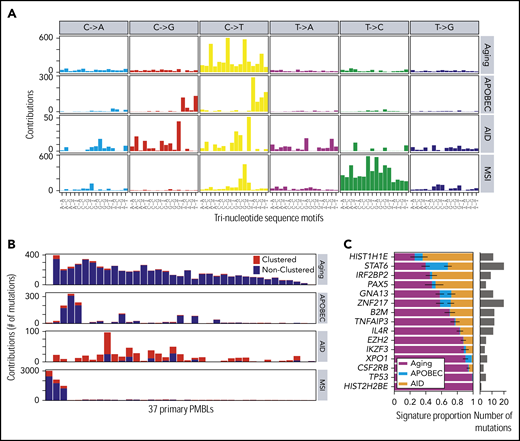
Mutational signatures operating in PMBLs. (A) De novo discovery identified 4 mutational signatures in 37 PMBLs using SignatureAnalyzer63 : spontaneous deamination at CpGs (C>T CpG, aging, COSMIC1), APOBEC (COSMIC2 and COSMIC13), AID, and MSI (COSMIC26). (B) Signature activity as total count of contributing mutations in 37 PMBCLs. Nearest mutation distance <10 kb. (C) Proportion of each signature for mutations in significantly mutated genes (MutSig2CVq < 0.1). This is based on the mean likelihood of association (supplemental Methods) of each mutation to each signature (left). Error bars reflect the standard error. Total number of mutations depicted as histogram (right).
Mutational signatures operating in PMBLs. (A) De novo discovery identified 4 mutational signatures in 37 PMBLs using SignatureAnalyzer63 : spontaneous deamination at CpGs (C>T CpG, aging, COSMIC1), APOBEC (COSMIC2 and COSMIC13), AID, and MSI (COSMIC26). (B) Signature activity as total count of contributing mutations in 37 PMBCLs. Nearest mutation distance <10 kb. (C) Proportion of each signature for mutations in significantly mutated genes (MutSig2CVq < 0.1). This is based on the mean likelihood of association (supplemental Methods) of each mutation to each signature (left). Error bars reflect the standard error. Total number of mutations depicted as histogram (right).
Despite the young age of our PMBL patient cohort, the majority of remaining mutations were caused by spontaneous deamination of cytosines at cytosine-phosphate-guanines (CpGs), a genetic signature usually associated with older age at diagnosis (Figure 2A-B). The high frequency of mutations attributed to the aging signature (4.5 mutations/Mb) in young adults is an additional shared feature of PMBL and cHL.28
In PMBL, as in cHL, the next most prevalent mutational signatures were APOBEC and AID (Figure 2A-B).28 The APOBEC signature was found in 7 (19%) of 37 PMBLs, which is of note because APOBEC signatures have been associated with an increased response to PD-1 blockade in non–small-cell lung cancers.69 To identify putative molecular mechanisms of increased APOBEC mutagenesis, we genotyped our PMBL patients with a high APOBEC signature for SNP rs12628403. This SNP is a proxy for a short (30-kb) deletion that fuses the coding region of APOBEC3A to the 3′UTR of APOBEC3B and generates a more stable chimeric transcript, APOBEC3AB, that has been linked to increased APOBEC mutagenesis.70,71 We detected the rs12628403 SNP in 8 of the 37 PMBL samples, including in 2 of the 3 patients who had the highest APOBEC signatures (c_M_07 and c_M_1404). In fact, the APOBEC signature activity was significantly higher in patients who exhibited the rs12628403 SNP (hg19 chr22:39358037A>C; Wilcoxon rank-sum test P = .032; supplemental Figure 3F).
Next, we assessed the relative contribution of the aging, APOBEC, and AID signatures to the PMBL drivers (Figure 2C). TP53 and HIST2H2BE mutations were exclusively caused by spontaneous deamination of CpGs (aging), and XPO1 and CSFR2B mutations were predominantly caused by the aging mutational pattern (Figure 2C), as in cHL.28 In contrast, STAT6 was perturbed by each of the 3 mutational mechanisms (aging, APOBEC, and AID (Figure 2C; supplemental Figure 3G-H). In a combined analysis of 37 PMBLs and 3 PMBL cell lines, we identified the above-mentioned mutational signatures and detected 2 additional signatures, COSMIC11 and COSMIC15, only in the PMBL cell lines. Whereas COSMIC15 is another MSI-associated mutational signature, COSMIC11 is associated with DNA damage caused by alkylating agents (supplemental Figure 3D-E), likely reflecting the derivation of the PMBL cell lines from heavily pretreated patients.
SCNAs and SVs
To detect SCNAs, we first applied our copy number pipeline to the WES data and identified 17 recurrent SCNAs by using the GISTIC 2.0 algorithm,39 including 10 copy gains (2 focal and 8 arm level) and 7 copy losses (6 focal and 1 arm level) (Figure 3A; supplemental Table 4). Copy gains of 9p/9p24.1/PD-L1/PD-L2 and 2p/2p16.1/REL were detected in 70% (26 of 37) and 36% (11 of 37) of PMBLs, respectively (Figure 3A; supplemental Figure 4). These findings are in line with our previous reports and are the bases for increased expression of PD-1 ligands and REL in PMBL.15,18,24,72 Frequent focal copy losses included 6p21.33/MHCI/MHCII, 6q23.3/TNFAIP3, and 15q15.1/B2M in 32%, 16%, and 21% of the patients, respectively (Figure 3A; supplemental Figure 4).
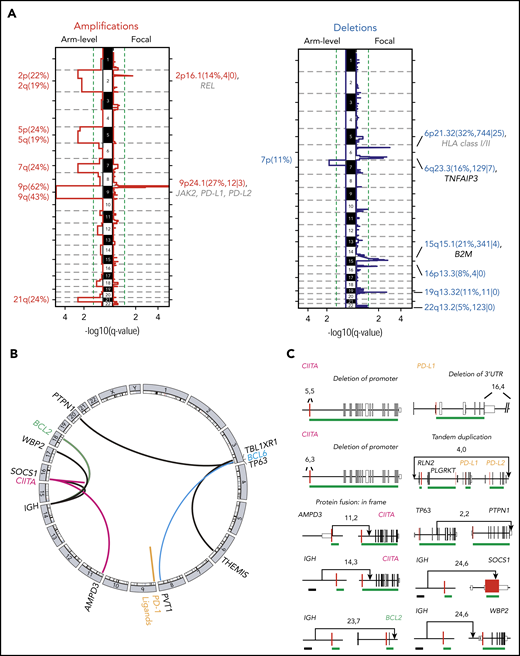
SCNAs and SVs in PMBL. (A) GISTIC2.0-defined recurrent somatic copy number gain (red, left panel) and loss (blue, right panel) are visualized as mirror plots with arm-level alterations to the left and focal alterations to the right. Chromosomes are depicted on the vertical axis. Green line denotes the significance threshold (q < 0.1). Significant peaks are labeled with their associated cytoband/arm followed in brackets by frequency of the alteration, the number of total genes, and Cancer Gene Census genes in the significant regions, respectively. Genes that are also significantly mutated are shown in black, and other relevant drivers are shown in gray. Note that the significant focal deletion in 16p13.3 does not include CREBBP.87 (B) Detected chromosomal rearrangements are visualized as a circos plot.88 (C) Select SVs and their breakpoints are plotted in their genomic context. Exons are visualized as boxes: start codon-containing exons in red, untranslated regions are in smaller boxes, coding exons are underlined in green, and previously identified superenhancers74 in black. Numbers indicate the supporting reads for the plotted SV in the format: split-reads, read-pairs. SV type is listed if it is not a translocation.
SCNAs and SVs in PMBL. (A) GISTIC2.0-defined recurrent somatic copy number gain (red, left panel) and loss (blue, right panel) are visualized as mirror plots with arm-level alterations to the left and focal alterations to the right. Chromosomes are depicted on the vertical axis. Green line denotes the significance threshold (q < 0.1). Significant peaks are labeled with their associated cytoband/arm followed in brackets by frequency of the alteration, the number of total genes, and Cancer Gene Census genes in the significant regions, respectively. Genes that are also significantly mutated are shown in black, and other relevant drivers are shown in gray. Note that the significant focal deletion in 16p13.3 does not include CREBBP.87 (B) Detected chromosomal rearrangements are visualized as a circos plot.88 (C) Select SVs and their breakpoints are plotted in their genomic context. Exons are visualized as boxes: start codon-containing exons in red, untranslated regions are in smaller boxes, coding exons are underlined in green, and previously identified superenhancers74 in black. Numbers indicate the supporting reads for the plotted SV in the format: split-reads, read-pairs. SV type is listed if it is not a translocation.
We detected SVs and defined them at the base-pair level by combining multiple algorithms (see “Methods”; supplemental Table 5). These included CIITA SVs in 4 (11%) of 37 of the patients, consistent with previous reports,21,22 and infrequent (2 of 37) SVs of PD-1 ligands, including a tandem duplication of both PD-1 ligands and a deletion of the 3′UTR of PD-L1 (Figure 3B-C). The latter has been reported as an additional mechanism of PD-L1 deregulation in T-cell NHL (T-NHL) and DLBCL.73 In addition, we identified 2 gain-of-function translocations in which the immunoglobulin superenhancer74 is juxtaposed to either BCL2 or WBP2 (Figure 3C). WBP2 is a recently described oncogene that functions as a transcriptional coactivator implicated in the Hippo- and Wnt-signaling pathways in breast cancer.75
Cooccurrence of genetic alterations and perturbed pathways
After identifying the recurrent genetic drivers in PMBL, we explored the patterns of genetic alterations in individual tumors and the full series. For this reason, we generated a gene-sample matrix of the recurrent CCGs, SCNAs, and SVs and performed 2-way hierarchical clustering (Figure 4A; supplemental Table 6).

Cooccurring alterations and clonality of genetic drivers in PMBL. (A) Genetic driver alterations as color-coded matrix. PMBLs alterations were 2-way hierarchically clustered using a 1-Pearson-correlation, revealing major left and right branches. Alterations in PMBL cell lines to the right. Bar graphs to the right and bottom summarize the number of events across alterations and patients, respectively. Alt, alterations; non-syn, nonsynonymous. (B) The cancer cell fractions (CCF) of all genetic drivers are visualized on top and ranked by their median CCF (red line) from high to low (left to right; error bar, interquartile range). The staggered bar graph plots the fraction of clonal and subclonal events, with a CCF ≥0.9 being clonal.
Cooccurring alterations and clonality of genetic drivers in PMBL. (A) Genetic driver alterations as color-coded matrix. PMBLs alterations were 2-way hierarchically clustered using a 1-Pearson-correlation, revealing major left and right branches. Alterations in PMBL cell lines to the right. Bar graphs to the right and bottom summarize the number of events across alterations and patients, respectively. Alt, alterations; non-syn, nonsynonymous. (B) The cancer cell fractions (CCF) of all genetic drivers are visualized on top and ranked by their median CCF (red line) from high to low (left to right; error bar, interquartile range). The staggered bar graph plots the fraction of clonal and subclonal events, with a CCF ≥0.9 being clonal.
Multiple mechanisms of perturbing driver genes.
Combined analyses of recurrent CCGs, SCNAs, and SVs revealed that certain candidate driver genes were perturbed by multiple mechanisms (Figures 4A and 5). Examples include TNFAIP3 alterations (59% overall, 41% mutations, 24% focal copy loss, 6% biallelic) that increase NF-κB signaling and B2M alterations (51% overall, 30% mutations, 27% focal copy loss, 6% biallelic) (Figures 4A and 5) that limit MHC class I antigen presentation.

Genetically perturbed pathways in PMBL. Recurrent genetic drivers, including CCGs, SCNAs, and SVs, are visualized in their functional pathways. Note that certain drivers are perturbed by several genetic mechanisms and that several alterations converge on the level of a deregulated pathway (bold). Alterations that are known to inactivate the involved proteins are noted (┴). An asterisk (*) denotes all genes related to MHC class I and or MHC class II. A purple circle/box with a darker gray background highlights genes that are more frequently altered in PMBL compared with cHL. p, phosphorylation.
Genetically perturbed pathways in PMBL. Recurrent genetic drivers, including CCGs, SCNAs, and SVs, are visualized in their functional pathways. Note that certain drivers are perturbed by several genetic mechanisms and that several alterations converge on the level of a deregulated pathway (bold). Alterations that are known to inactivate the involved proteins are noted (┴). An asterisk (*) denotes all genes related to MHC class I and or MHC class II. A purple circle/box with a darker gray background highlights genes that are more frequently altered in PMBL compared with cHL. p, phosphorylation.
Multiple mechanisms of perturbing signaling pathways and immune recognition.
The combined analyses of the 3 types of genetic alterations also revealed multiple mechanisms of perturbing specific signaling pathways (Figures 4A and 5). In particular, 81% (30 of 37) of the tumors exhibited 1 or more events affecting components of the JAK/STAT pathway (Figures 4A and 5), including IL4R mutations (32%), 9p/9p24.1/JAK2 copy gain (70%), STAT6 mutations (43%), CSFR2B mutations (14%), SOCS1 SVs (3%), and IRF2BP2 mutations (19%). Chromatin-perturbing CCGs, including ZNF217, EZH2, HIST1H1E, and HIST2H2BE mutations (Figure 1), were found in 57% (21 of 37) of PMBLs (Figures 4A and 5).
A potential genetic basis of PD-1–mediated immune escape was detected in 81% (30 of 37) of PMBLs. However, 73% (22 of 30) of these PMBLs also had genetic alterations of antigen presentation pathway components, including B2M copy loss or mutations, copy loss of 6q21.33 (which includes MHCI/MHCII), mutations in EZH2, and SVs of CIITA (Figures 4A and 5).
Overall, we observed a convergence of genetic events in NF-κB and JAK/STAT signaling pathways and perturbations in immune recognition and epigenetic modulation (Figures 4A and 5). The majority of these events were also detected in the 3 PMBL cell lines, underscoring their utility as model systems of the disease (Figure 4A, right panel). However, as described above, the cell lines included additional mutational signatures reflecting, in part, their previous treatment with alkylating agents (supplemental Figure 3E).
Additional genetic substructure.
Although the majority of PMBLs exhibited 9p copy gain and frequent 6p21.33 copy loss, hierarchical clustering revealed additional genetic substructure (Figure 4A, left and right branches). PMBLs in the left branch of the dendrogram included the 3 identified hypermutators and additional tumors with a significantly higher frequency of CCGs (P = .0056, Mann-Whitney U test), including ZNF217 (P = .003, Fisher’s exact test) and TNFAIP3 (P = .0136, Fisher’s exact test) (Figure 4A; supplemental Figure 5A-B). Patients with tumors in the left branch were significantly more likely to be female (81% female [left] vs 45% female [right]; P = .05, Fisher’s exact test) and to be younger at diagnosis (33.5 years [left] vs 38 years [right]) (supplemental Figure 5C-D), highlighting the potential clinical relevance of the genetic substructure (Figure 4A).
Clonal and subclonal genetic events.
Next, we assessed purity and ploidy of the PMBL series using ABSOLUTE37 (supplemental Table 1). Thereafter, we estimated the cancer cell fraction for each genetic alteration30 (ie, the fraction of tumor cells harboring each genetic event). Of interest, the majority of recurrent genetic alterations in PMBL were clonal (Figure 4B). Because PMBL occurs predominantly in females, we specifically searched for alterations that were enriched on the X chromosome and performed an X chromosome–specific copy number evaluation (data not shown). However, these analyses did not reveal X chromosome–associated explanations for the predominance of females in PMBL.
Assessment of antigen presentation pathways in PMBL
As noted, the antigen presentation pathways in PMBL were perturbed by multiple recurrent alterations, including B2M mutations, focal copy number losses of B2M and the MHCI/MHCII loci, and SVs of CIITA and EZH2 mutations (Figures 4A and 5). EZH2 mutations were recently described as a mechanism of reducing expression of MHC class I and MHC class II in lymphomas.76 These findings prompted us to compare the composite genetic signature to β2M, MHC class I, and class II protein expression in our PMBL series (Figure 6A-D).
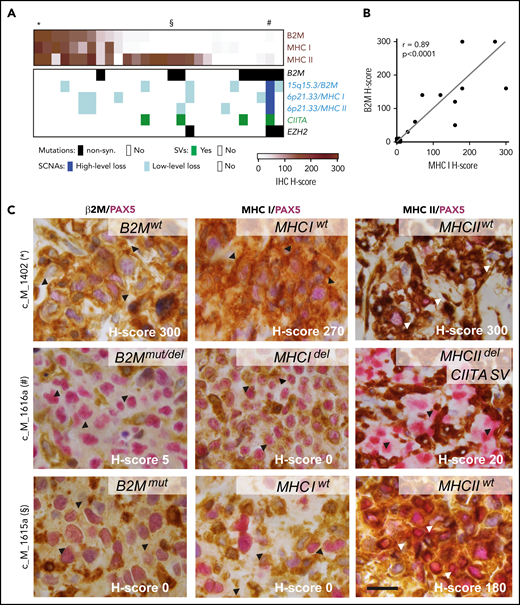
Expression of β2M, MHC class I, and MHC class II proteins affected by different genetic alterations. (A) Tumor-specific protein expression for β2M, MHC class I, and MHC class II is visualized as color-coded H-score (intensity × percent positive) for all 28 PMBLs with available immunohistochemistry (IHC) data (brown, top panel). Genetic alterations in B2M, MHCI/MHCII, CIITA, and EZH2 color coded by alteration type (key below). Cases depicted in (C) indicated on top with an asterisk, section symbol, and pound sign. (B) Correlation of H-scores of MHC class I and β2M. P values were obtained by using a Spearman correlation test. (C) Representative examples of cases with positive expression of β2M, HLA class I, and HLA class II (top); absence of β2M, HLA class I expression, and decreased HLA class II expression (middle); and absent β2M, HLA class I expression, and positive HLA class II expression (bottom). H-score, lower right corner; genotype, upper right corner. Arrow heads indicate region of interest. Scale bar = 20 μm. del, deletion; mut, mutated; wt, wild-type.
Expression of β2M, MHC class I, and MHC class II proteins affected by different genetic alterations. (A) Tumor-specific protein expression for β2M, MHC class I, and MHC class II is visualized as color-coded H-score (intensity × percent positive) for all 28 PMBLs with available immunohistochemistry (IHC) data (brown, top panel). Genetic alterations in B2M, MHCI/MHCII, CIITA, and EZH2 color coded by alteration type (key below). Cases depicted in (C) indicated on top with an asterisk, section symbol, and pound sign. (B) Correlation of H-scores of MHC class I and β2M. P values were obtained by using a Spearman correlation test. (C) Representative examples of cases with positive expression of β2M, HLA class I, and HLA class II (top); absence of β2M, HLA class I expression, and decreased HLA class II expression (middle); and absent β2M, HLA class I expression, and positive HLA class II expression (bottom). H-score, lower right corner; genotype, upper right corner. Arrow heads indicate region of interest. Scale bar = 20 μm. del, deletion; mut, mutated; wt, wild-type.
To this end, the 28 PMBLs with available tissue blocks were stained for β2M, MHC class I, and MHC class II and scored by an expert hematopathologist (S.J.R.) blinded to the genetic features (Figure 6A). This analysis revealed that 46% (13 of 28), 43% (12 of 28), and 75% (21 of 28) of tumor cells had detectable (positive [H-score >100] or decreased [H-score 10-99]) membranous expression of β2M, MHC class I, and MHC class II, respectively (Figure 6A-B). As in cHL,77,78 we observed a significant correlation between the expression of β2M and MHC class I in individual PMBLs (P < .0001 Spearman correlation; Figure 6B); however, expression of MHC class I and MHC class II were independent parameters (Figure 6A; supplemental Figure 7A). Genetic perturbations in the MHC class I pathway components were more common in tumors without MHC class I expression (Figure 6A). The 3 PMBLs with EZH2 mutations lacked MHC class I expression; 2 of these patients also lacked expression of MHC class II (Figure 6A).
The analyzed PMBLs largely had cell surface expression of both MHC class I and MHC class II (Figure 6A,D, top row), cell surface expression of only MHC class II (Figure 6A,D, bottom row), or absent/decreased expression of both MHC class I and MHC class II (Figure 6A,D, middle row). Of interest, we reported similar patterns in cHL, in which expression of MHC class II, but not MHC class I, was predictive for response to PD-1 blockade.78
After characterizing MHC class I and MHC class II expression in this PMBL cohort, we assessed additional components of the tumor immune infiltrate with a multiparametric spectral imaging panel (PAX5, CD3, CD4, CD8, CD68, and 4′,6-diamidino-2-phenylindole [DAPI]) and established methods.79 PMBLs with higher levels of MHC class II expression had increased numbers of tumor-infiltrating CD3+/CD4+ T cells (P = .08, Cuzick’s trend test; supplemental Figure 7B-C). In addition, the number of tumor-infiltrating CD68+ macrophages was significantly higher in PMBLs that lacked MHC class I expression (P = .044, Cuzick’s trend test; supplemental Figure 7D-E). Given the recently described role of MHC class I in protecting tumor cells from macrophage-mediated phagocytosis,80,81 the inverse relationship between CD68+ macrophage infiltration and MHC class I expression in PMBL (supplemental Figure 7D-E) may have functional relevance.
Comparison of genetic alterations in PMBL and other lymphoid and solid malignancies
After identifying the recurrent genetic alterations (CCGs, SCNAs, SVs) in this PMBL series, we compared their frequencies to those in a recently described PMBL cohort82 and our own comprehensively characterized series of cHL28 and DLBCL30 (Figure 7A; supplemental Figure 7A). Because a gene could be perturbed in an entity but not reach the level of significance for a driver, we compared the raw frequencies of each alteration (Figure 7A). Ten of the 15 CCGs and 4 SCNAs in our PMBL series were also identified in the additional PMBL data set82 (supplemental Figure 7A). Our cohort of PMBLs shared several genetic features with cHL, including frequent copy gains of 9p/9p24.1/PD-1 ligands and multiple alterations that activate NF-κB and JAK/STAT signaling and perturb antigen presentation (Figure 7A).28 Differences included recurrent mutations of ZNF217, TP53, IRF2BP2, EZH2, and certain histone genes (HIST2H2BE) in PMBL that were less frequent in cHL (Figure 7A).28 In contrast, certain alterations such as BCL2 and BCL6 translocations were more frequent in DLBCL and less common in PMBL and cHL (Figure 7A).28 TP53 mutations were detected at similar frequencies in DLBCL (21%30 ) and PMBL (22%) (Figure 7A; compare left and right columns). However, in contrast to DLBCL, in which a subset of tumors exhibited biallelic alterations of TP53,30 PMBLs harbored only monoallelic TP53 mutations (Figure 4). The recurrent genetic alterations in PMBL were not coordinately enriched in any of our recently defined DLBCL genetic clusters (C1-C5)30 (supplemental Figure 7B), highlighting the distinctive features of large-cell lymphomas arising in the mediastinum.
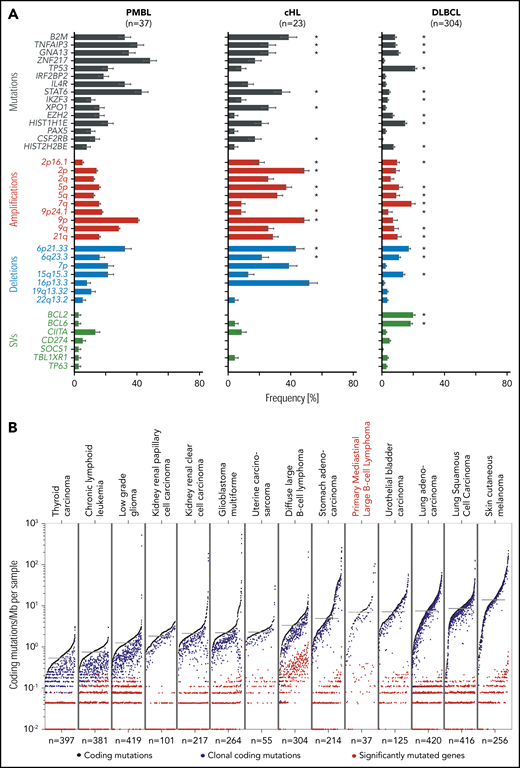
Comparative analysis of lymphoma drivers and mutational burden. (A) Significant genetic alternations found in PMBL (left panel) are compared with our own reported cohorts of cHL (middle panel),28 and DLBCL (right panel).30 Alterations are color-coded: mutations, black; copy gains (amplifications), red; copy losses (deletions), blue; SVs, green. Error bars indicate standard errors. Because this analysis is PMBL-centric, there are additional DLBCL-specific alterations30 that are not found in PMBL. Note that significantly recurrent somatic alterations in PMBL are not necessarily significantly recurrent in other tumor cohorts despite being observed frequently. Significant genetic drivers in cHL28 and DLBCL30 are indicated with an asterisk. (B) Mutational density across different tumor types, ordered from low to high mutational burden (left to right). Tumor types are ordered by median mutation burden. Coding mutations in black, clonal coding mutations in blue, and significantly mutated genes in red.
Comparative analysis of lymphoma drivers and mutational burden. (A) Significant genetic alternations found in PMBL (left panel) are compared with our own reported cohorts of cHL (middle panel),28 and DLBCL (right panel).30 Alterations are color-coded: mutations, black; copy gains (amplifications), red; copy losses (deletions), blue; SVs, green. Error bars indicate standard errors. Because this analysis is PMBL-centric, there are additional DLBCL-specific alterations30 that are not found in PMBL. Note that significantly recurrent somatic alterations in PMBL are not necessarily significantly recurrent in other tumor cohorts despite being observed frequently. Significant genetic drivers in cHL28 and DLBCL30 are indicated with an asterisk. (B) Mutational density across different tumor types, ordered from low to high mutational burden (left to right). Tumor types are ordered by median mutation burden. Coding mutations in black, clonal coding mutations in blue, and significantly mutated genes in red.
We also compared the mutational density of all, clonal, and driver mutations in PMBL with those in the reported cancers from The Cancer Genome Atlas project (Figure 7B). The median mutational density (7.0 mutations/MB) in PMBLs was significantly higher than that in DLBCLs (P = 8 × 10⁻⁶, 1-sided Wilcoxon test) and most solid cancers and comparable to that in bladder cancer and lung adenocarcinomas (Figure 7B). In PMBL, the relatively high mutational density may be an additional cause for increased neoantigen production and responsiveness to PD-1 blockade.
Discussion
In this comprehensive genomic analysis of PMBL, we defined recurrent mutations, SCNAs, and targeted SVs; assessed their clonality; overlaid mutations on 3D protein structures; analyzed the predominant mutation signatures in the coding genome; and compared the molecular signature and mutational burden of PMBL to that of related lymphoid malignancies and additional solid tumors.
In this report and in Wienand et al,28 we identified recurrent genetic alterations of the NF-κB, JAK/STAT signaling and MHC antigen presentation pathways that were shared by PMBLs and cHLs (Figures 5 and 7A). Notably, it was necessary to capture all 3 types of recurrent genetic events—CCGs, SCNAs, and SVs—to fully gauge the scope of these pervasive pathway alterations. We also identified genetic alterations of specific epigenetic modifiers (ZNF217 and EZH2), transcription factors (PAX5 and IRF2BP2), and TP53 that were more common in PMBL than in cHL (Figures 5 and 7A). Therefore, PMBLs have genetic features and pathway perturbations that are common to cHL in addition to more selective, potentially disease-defining alterations (Figure 5).
Similarities between PMBL and cHL include a relatively high mutational burden compared with that in other lymphoid and solid cancers.28 Although PMBL and cHL are predominantly tumors of young adults, these lymphomas have a high rate of spontaneous deamination of CpGs, a clock-like mutational signature that is typically associated with aging, potentially reflecting a much higher division rate of the precursor B cells.28,83 In addition, both PMBLs and cHLs exhibit MSI and APOBEC mutational signatures that have been associated with a more favorable response to PD-1 blockade.28,69,84
Our analyses also revealed that PMBLs, like cHLs, exhibit multiple genetic bases of perturbed MHC class I expression and less frequent decreased MHC class II expression (Figure 6A).28 The relative levels of MHC class I and II expression by PMBLs also impact the cellular composition of the tumor microenvironment (supplemental Figure 6B-D). Taken together, these data build upon earlier observations regarding a targetable basis of immune evasion in PMBL and cHL and provide a framework to comprehensively assess molecular mechanisms of response and resistance to PD-1 blockade and develop rational combination therapies.
The new WES data has been deposited in the dbGAP database (www.ncbi.nlm.nig.gov/gap) with the accession number phs000450.
The publication costs of this article were defrayed in part by page charge payment. Therefore, and solely to indicate this fact, this article is hereby marked “advertisement” in accordance with 18 USC section 1734.
Acknowledgment
The authors thank all patients for donating their samples.
This work was supported by the Claudia Adams Barr Program in Basic Cancer Research (B.C.), a Medical Oncology Translational Grant Program (B.C.), an LLS Translational Research Award (M.A.S.), a grant from the National Institutes of Health, National Cancer Institute (RO1 CA161026) (M.A.S.), and by the Miller Family Fund (M.A.S.). G.G. was partially supported by the Paul C. Zamecnick, MD, Chair in Oncology at the Massachusetts General Hospital Cancer Center.
Authorship
Contribution: B.C., C.S., G.G., and M.A.S. conceived the project and provided leadership; B.C., C.S., A.J.D., J.K., K.W., A.K., G.K.G., P.-H.C., A.L., R.A.R., C.M.C., M.D.D., A.R.T., S.J.R., G.G., and M.A.S analyzed the data and contributed to scientific discussions; B.C., G.K.G., and S.J.R. collected the samples; P.-H.C. and S.J.R. generated and interpreted the immunohistochemistry data; B.C., C.S., A.J.D., G.G., and M.A.S wrote the paper; and all authors read the paper and agreed to the content.
Conflict-of-interest disclosure: M.A.S. has received research funding from Bristol-Myers Squibb, Bayer, and Merck, served on advisory boards for Bayer and Bristol-Myers Squibb, and received honoraria from Bristol-Myers Squibb and Bayer. G.G. received research funds from IBM and Pharmacyclics and is an inventor on patent applications related to MuTect, ABSOLUTE, MutSig2CV, and POLYSOLVER. S.J.R. received research funding from Bristol-Myers Squibb, Merck, KITE/Gilead, and Affimed. G.K.G. is a consultant for Moderna Therapeutics. The remaining authors declare no competing financial interests.
Correspondence: Margaret Shipp, Dana-Farber Cancer Institute, 450 Brookline Ave, Mayer 513, Boston, MA 02215; e-mail: margaret_shipp@dfci.harvard.edu; and Gad Getz, Broad Institute of Harvard and Massachusetts Institute of Technology, Harvard Medical School, Cambridge, MA 02142; e-mail: gadgetz@broadinstitute.org.

This feature is available to Subscribers Only
Sign In or Create an Account Close Modal