

Key Points
Noninvasive testing of serum CP post–allogeneic transplant could predict relapse in AML and MDS.
Predictive utility of testing ctDNA, including DTA, was comparable to that of mutation persistence in matched BM.

Abstract
This study was performed to assess the utility of tumor-derived fragmentary DNA, or circulating tumor DNA (ctDNA), for identifying high-risk patients for relapse of acute myeloid leukemia and myelodysplastic syndrome (AML/MDS) after undergoing myeloablative allogeneic hematopoietic stem cell transplantation (alloSCT). We retrospectively collected tumor and available matched serum samples at diagnosis and 1 and 3 months post-alloSCT from 53 patients with AML/MDS. After identifying driver mutations in 51 patients using next-generation sequencing, we designed at least 1 personalized digital polymerase chain reaction assay per case. Diagnostic ctDNA and matched tumor DNA exhibited excellent correlations with variant allele frequencies. Sixteen patients relapsed after a median of 7 months post-alloSCT. Both mutation persistence (MP) in bone marrow (BM) at 1 and 3 months post-alloSCT and corresponding ctDNA persistence (CP) in the matched serum (MP1 and MP3; CP1 and CP3, respectively) were comparably associated with higher 3-year cumulative incidence of relapse (CIR) rates (MP1 vs non-MP1, 72.9% vs 13.8% [P = .0012]; CP1 vs non-CP1, 65.6% vs 9.0% [P = .0002]; MP3 vs non-MP3, 80% vs 11.6% [P = .0002]; CP3 vs non-CP3, 71.4% vs 8.4% [P < .0001]). We subsequently evaluated whether subset analysis of patients with 3 genes associated with clonal hematopoiesis, DNMT3A, TET2, and ASXL1 (DTA), could also be helpful in relapse prediction. As a result, CP based on DTA gene mutations also had the prognostic effect on CIR. These results, for the first time, support the utility of ctDNA as a noninvasive prognostic biomarker in patients with AML/MDS undergoing alloSCT.
Introduction
Allogeneic hematopoietic stem cell transplantation (alloSCT) is the only curative option for patients with high-risk or refractory acute myeloid leukemia (AML) and myelodysplastic syndrome (MDS).1,2 Relapse is the main event in therapeutic failure for these patients.1 For relapsed patients, therapeutic options include withdrawal of immunosuppressant, chemotherapy, and/or donor lymphocyte infusion, the success of which depends heavily on tumor burden.1,3-7 Hence, a reliable biomarker for assessing minimal residual disease (MRD) post-alloSCT is required for earlier therapeutic interventions in patients with impending relapse. Four methods are currently widely applied for MRD testing post-alloSCT in patients with AML and MDS: cytogenetics, flow cytometry (FC), real-time quantitative polymerase chain reaction (qPCR), and mixed chimerism (MC) analysis.2,8-10 Despite their demonstrated utility, these conventional methodologies have serious limitations in either sensitivity or applicability. For example, although qPCR is more sensitive than FC and cytogenetics, and is currently considered the gold standard for MRD assessment with AML and MDS, no common genetic markers for qPCR are available for AML and MDS.11
Recent advances in understanding the genetic landscapes of AML and MDS through next-generation sequencing (NGS) should ultimately lead to more tailored approaches for MRD monitoring according to each patient’s genetic biology. In light of this and the recent advent of sensitive molecular quantification techniques such as droplet digital PCR (ddPCR), tumor-derived fragmentary DNA in serum, known as circulating tumor DNA (ctDNA), represents 1 of the most sensitive and noninvasive biomarkers in solid cancers.12 However, for hematological malignancies, there have been only a few proof-of-principle studies to support the utility of ctDNA as a clinical biomarker.13,14 Furthermore, it remains to be elucidated whether residual ctDNA status post-alloSCT can be used to identify patients at high risk for relapse in AML and MDS. To address this issue, we retrospectively analyzed the impact of residual ctDNA status, at 1 month and 3 months post-alloSCT, on the outcome in 51 patients with AML and MDS who underwent myeloablative alloSCT.
Materials and methods
Patients and samples
Our study protocol was approved by our institutional research ethics committee and was in accordance with the Declaration of Helsinki. Fifty-three patients underwent myeloablative alloSCT in our research hospital; they had primary tumor samples and serum samples post-alloSCT that were available for analyses and were recruited for our study. All 53 patients provided written informed consent. The patients used for ctDNA analysis and their transplant characteristics are summarized in Table 1 and supplemental Table 1 (available on the Blood Web site). Our cohort consisted of 15 patients with de novo AML, 22 patients with secondary AML, and 14 patients with MDS. The following samples were collected: (1) samples at diagnosis (tumor: bone marrow [BM; n = 40]; peripheral blood [PB; n = 13]; matched serum [n = 53]; controls: buccal swab [n = 24]; magnetically sorted CD3+ T-cell fractions [n = 29]), (2) tumor and/or matched serum samples collected at a median of 1 month post-alloSCT (median, 32 days post-alloSCT [range, 20-40 days]; tumor: BM [n = 38]; matched serum [n = 47]), (3) tumor and/or matched serum samples collected at a median of 3 months (median, 95 days post-alloSCT [range, 60-120 days]; tumor: BM [n = 26]; matched serum [S3, n = 44]), and (4) samples collected at extra time points (serum [n = 106]).
Baseline characteristics of the 51 patients used for ctDNA analysis
| Baseline characteristics | N (%) or median (range) |
|---|---|
| Total, N (%) | 51 (100) |
| Age, median (range), y | 53 (17-68) |
| Male, N (%) | 29 (56.9) |
| Diagnosis, N (%) | |
| AML | 37 (72.5) |
| De novo AML | 15 (29.4) |
| Secondary AML | 22 (43.1) |
| MDS | 14 (27.5) |
| Stem cell source, N (%) | |
| BM | 4 (7.8) |
| Cord blood | 47 (92.2) |
| Disease status at alloSCT, N (%) | |
| CR | 8 (15.7) |
| Relapse or refractory | 25 (49.0) |
| No previous treatment | 18 (35.3) |
| Cytogenetics, N (%) | |
| Normal karyotype | 19 (37.3) |
| Aberrant karyotype | 32 (62.7) |
| −7/del7q | 8 (15.7) |
| +8 | 7 (13.7) |
| Complex karyotype | 15 (29.4) |
| Relapsed patients after alloSCT, N (%) | 16 (31.4) |
| Median follow-up (range), mo | 32 (4-102) |
CR, complete remission.
Extraction of DNA
All DNA and cell-free DNA were extracted using the Gentra Puregene Blood kit and the QIAamp Circulating Nucleic Acid kit, respectively (Qiagen, Hilden, Germany). DNA was quantified using the Qubit dsDNA HS Assay kit (Life Technologies, Carlsbad, CA).
Next-generation sequencing
To identify driver mutation, we performed targeted-deep sequencing (TDS; n = 35) with a TruSight myeloid panel (Illumina, San Diego, CA) or a QIAseq targeted DNA panel (Qiagen) (target regions are listed in supplemental Table 2a-b) or whole-exome sequencing (WES; n = 25) (SureSelect XT Human All Exon V6; Agilent Technologies, Santa Clara, CA) on a Miseq or NextSeq sequencer (Illumina), respectively. We used human genome build 19 as the reference sequence in our analysis. Processing of sequencing data was performed using our in-house software. We classified identified variants into 4 tiers, and we regarded tier 1 to 3 mutations as putative driver mutations. Details are described in supplemental Methods and supplemental Figure 1.
Droplet digital PCR
We designed a total of 57 ddPCR assays for a prioritized somatic mutation in each case (n = 51), using the QX200 platform (Bio-Rad, Hercules, CA) according to the manufacturer’s instructions. Briefly, gene-specific primers and hydrolysis probes for wild-type (6-carboxy-2,4,4,5,7,7-hexachlorofluorescein succinimidyl ester labeled) and mutant-specific (6-carboxyfluorescein labeled) sequences with a nonfluorescent quencher (black-hole quencher 1) were designed using Primer Express version 5.0 (Applied Biosystems, Inc, Foster City, CA). The median detection limit, as determined in the 57 independent limiting dilution assays, was 0.04% (supplemental Table 3a). Details of the procedures are described in supplemental Methods, and representative results are shown in supplemental Figure 2a-b.
Statistical analysis
The Pearson correlation was used to analyze the correlation of 2 noncategorical variables. The Fisher exact test was used to test the association between 2 categorical variables. Concordance of 2 noncategorical variables was assessed by κ coefficient (where κ < 0.40, poor concordance; κ = 0.41-0.75, moderate concordance; κ > 0.75, good concordance). For the survival analysis, all event times were measured from the date of alloSCT. Primary end point was the cumulative incidence of relapse (CIR) rate, and secondary end point was the overall survival (OS) rate, as estimated by the Kaplan-Meier method; they were compared with the log-rank test. A Cox proportional hazards univariate regression model was used to test the association of variables and CIR and OS. The area under the curve (AUC) of receiver operating characteristics (ROC) curves was used to measure and compare the performance of each variable for predicting relapse. All statistical tests were performed using R, version 3.4.1 (R Foundation for Statistical Computing, Vienna, Austria). P values <.05 were considered significant.
Results
Patient characteristics
We retrospectively investigated 53 patients with AML and MDS who underwent alloSCT, and had tumor and serum samples at diagnosis and post-alloSCT, either at 1 month or 3 months, available for analyses. Driver mutations were identified in 51 patients using NGS, and the median age of the patients in our cohort was 53 years. Approximately one-third of patients had a normal karyotype, and the conventional cytogenetic risk category was adverse or high risk in 39.2% of patients (Table 1; supplemental Table 1). Twenty-five patients (49.0%) were in relapse or refractory disease status at alloSCT, and all patients received myeloablative conditioning; in most cases, the stem cell source was cord blood, a profile in line with our previous reports on AML and MDS cases undergoing alloSCT.
Identification of driver mutations in the subjects
We performed NGS, using TDS (with either a 54- or 141-gene panel of AML- or MDS-related genes), WES, or combinations of TDS and WES, of the diagnostic tumor and control samples. We detected a total of 65 606 somatic mutations and prioritized these somatic variants using a 4-tier grading system (supplemental Methods; supplemental Figure 1). We found that 96.2% (n = 51 of 53) of the cases contained at least 1 putative driver mutation in 37 genes (median of 2 mutations per patient [range, 1-5]). The most frequent mutations found involved epigenetic regulators (TET2/ASXL1/DNMT3A, mutated in 32.1% of the samples), followed by signal transduction proteins (NRAS/FLT3, 31.4%) and spliceosome factors (U2AF1/SF3B1/SRSF2, 21.6%) (supplemental Figure 3). The spectrum of these mutations mirrored the disease characteristics of our patients and were in agreement with the previously reported genomic landscape of high-risk AML or MDS.15,16
Construction of personalized ddPCR assays
We further prioritized these patient-specific putative driver mutations based on variant allele frequency (VAF), tier grading of driver mutations (supplemental Figure 1), and suitability for ddPCR assays (eg, designability of probe, see supplemental Methods). As a result, we were able to design 1 representative ddPCR assay for all 51 patients (Table 2; supplemental Table 3a-b). Considering the possibility of tumor clonal heterogeneity, we designed extra assays in some cases (n = 15). We first checked the concordance of NGS and ddPCR assays with regard to VAF; the results were strongly concordant with regard to identifying the VAF of identical diagnostic tumor-rich samples (T0), as assessed using 45 available samples with 58 matched measurements (R2 = 0.78, P < .0001, Student t test) (supplemental Figure 4). We next determined whether these mutations could be detected in available matched diagnostic serum samples (serum sample at diagnosis [S0]) as ctDNA at diagnosis. As expected, all ctDNAs, for which we could design ddPCR assays, were identified in all available S0 samples (n = 51) (supplemental Figure 5). There was a clear correlation between S0 and T0 regarding VAF (63 matched measurements from 47 cases; R2 = 0.67, P < .0001, Student t test) (Figure 1). Overall, these findings hold the technical accuracy of our personalized ddPCR assays for the detection of mutations based on tumor and matched serum ctDNA.
Summary of targeted driver mutations for ctDNA detection
| UPN | Gene | Amino acid change | Chromosome | Position | Reference allele | Variant allele | COSMIC ID | PolyPhen-2 (score) | SIFT (score) |
|---|---|---|---|---|---|---|---|---|---|
| 1 | DNMT3A | R882H | 2 | 25457242 | C | T | COSM52944 | Possibly damaging (0.651) | Deleterious (0.03) |
| 2 | STAG2 | S633fs | X | 123197775 | CTAAAACTTAC | — | — | — | — |
| 3 | SRSF2 | P95H | 17 | 74732959 | G | T | COSM211504 | Probably damaging (1) | Deleterious (0.02) |
| 4 | SF3B1 | K700E | 2 | 198266834 | T | C | COSM84677 | Probably damaging (1) | Deleterious (0) |
| 5 | WT1 | R380fs | 11 | 32417912 | — | GTACAAGAGT | — | — | — |
| 6 | SH2B3 | E288fs | 12 | 111884773 | — | C | — | — | — |
| 7 | NRAS | G12D | 1 | 115258747 | C | T | COSM564 | Benign (0.372) | Deleterious (0) |
| 7 | GATA2 | A364T | 3 | 128200715 | C | T | — | Possibly damaging (0.751) | Deleterious (0.04) |
| 8 | NPM1 | L287fs | 5 | 170837543 | C | CTCTG | COSM158604 | — | — |
| 8 | DNMT3A | W795X | 2 | 25462022 | C | T | — | — | Tolerated (1) |
| 9 | CEBPA | P23fs | 19 | 33793252 | C | CG | COSM18922 | — | — |
| 10 | SF3B1 | K700E | 2 | 198266834 | T | C | COSM84677 | Probably damaging (1) | Deleterious (0) |
| 11 | IDH1 | R132C | 2 | 209113113 | G | A | COSM28747 | Benign (0.259) | Deleterious (0) |
| 12 | TP53 | R175H | 17 | 7578406 | C | T | COSM3355994 | Probably damaging (1) | Deleterious (0) |
| 13 | U2AF1 | S34F | 21 | 44524456 | G | A | COSM166866 | Probably damaging (1) | Deleterious (0) |
| 14 | U2AF1 | S34F | 21 | 44524456 | G | A | COSM166866 | Probably damaging (1) | Deleterious (0) |
| 14 | BCORL1 | R1299X | X | 129159171 | C | T | — | — | Tolerated (0.73) |
| 14 | GATA2 | L321H | 3 | 128202758 | A | T | COSM255200 | Probably damaging (1) | Deleterious (0) |
| 15 | IDH2 | R140Q | 15 | 90631934 | C | T | COSM41590 | Probably damaging (1) | Deleterious (0) |
| 15 | DNMT3A | R882C | 2 | 25457243 | G | A | COSM53042 | Probably damaging (1) | Deleterious (0) |
| 15 | NPM1 | L287fs | 5 | 170837543 | C | CTCTG | COSM158604 | — | — |
| 16 | GATA2 | E387-M391del | 3 | 128200133 | TCCTTCTTCATGG | T | — | — | — |
| 17 | FLT3 | D600delinsDFYVDFREYEYD | 13 | 28608256 | — | TCATATTCATATTCTCTGAAATCAACGTAGAAG | — | — | — |
| 17 | DNMT3A | R882C | 2 | 25457243 | G | A | COSM53042 | Probably damaging (1) | Deleterious (0) |
| 18 | NPM1 | L287fs | 5 | 170837543 | C | CTCTG | COSM158604 | — | — |
| 18 | MYC | P75T | 8 | 128750686 | C | A | COSM3316884 | Probably damaging (1) | Deleterious (0) |
| 19 | NPM1 | L287fs | 5 | 170837543 | C | CTCTG | COSM158604 | — | — |
| 20 | NRAS | G12D | 1 | 115258747 | C | T | COSM564 | Benign (0.372) | Deleterious (0) |
| 21 | TP53 | R337C | 17 | 7574018 | G | A | COSM117591 | Possibly damaging (0.696) | Deleterious (0) |
| 22 | TP53 | R158G | 17 | 7578458 | G | C | COSM318151 | Probably damaging (1) | Deleterious (0) |
| 22 | TP53 | E11Q | 17 | 7579882 | C | G | COSM327260 | Probably damaging (0.999) | Deleterious (0.03) |
| 23 | SF3B1 | K700E | 2 | 198266834 | T | C | COSM84677 | Probably damaging (1) | Deleterious (0) |
| 24 | U2AF1 | Q84P | 21 | 44514777 | T | G | COSM1318797 | Possibly damaging (0.701) | Deleterious (0) |
| 25 | ATRX | N228fs | X | 76940064 | GT | G | — | — | — |
| 25 | SETBP1 | L227fs | 18 | 42456669 | T | TTCTT | — | — | — |
| 26 | CEBPA | P197delinsHPP | 19 | 33792731 | G | GGCGGGT | — | — | — |
| 27 | DDX41 | C264Y | 5 | 176939370 | C | T | — | Probably damaging (0.999) | Deleterious (0) |
| 28 | ASXL1 | G642fs | 20 | 31033441 | A | AG | COSM1411076 | — | — |
| 29 | DNMT3A | R882H | 2 | 25457242 | C | T | COSM52944 | Possibly damaging (0.651) | Deleterious (0.03) |
| 29 | RUNX1 | S436fs | 21 | 36164567 | G | GT | — | — | — |
| 30 | NRAS | G12D | 1 | 115258747 | C | T | COSM564 | Benign (0.372) | Deleterious (0) |
| 30 | U2AF1 | S34F | 21 | 44524456 | G | A | COSM166866 | Probably damaging (1) | Deleterious (0) |
| 31 | CEBPA | V314delinsKV | 19 | 33792381 | C | CCTT | COSM18099 | — | — |
| 32 | NRAS | G13D | 1 | 115258744 | C | A | COSM573 | Benign (0.434) | Deleterious (0.03) |
| 33 | SH2B3 | W364X | 12 | 111885203 | G | A | — | — | Tolerated (1) |
| 34 | ASXL1 | L1009fs | 20 | 31023541 | — | ACGG | — | — | — |
| 35 | TET2 | M1749fs | 4 | 106196913 | TG | T | — | — | — |
| 35 | SF3B1 | R625C | 2 | 198267484 | G | A | COSM110696 | Probably damaging (1) | Deleterious (0) |
| 36 | ASXL1 | K1034X | 20 | 31023615 | A | T | — | — | Tolerated (1) |
| 37 | KIT | D816H | 4 | 55599320 | G | C | COSM1311 | Possibly damaging (0.842) | Deleterious (0.01) |
| 38 | PTPN11 | G60V | 12 | 112888163 | G | T | COSM13028 | Probably damaging (1) | Deleterious (0) |
| 39 | ETV6 | R418G | 12 | 12038959 | A | G | COSM1318051 | Probably damaging (1) | Deleterious (0) |
| 39 | RAD21 | H261fs | 8 | 117868917 | T | TA | — | — | — |
| 40 | CSF3R | K812X | 1 | 36932116 | T | A | COSM6022453 | — | Tolerated (0.3) |
| 40 | CSF3R | T618I | 1 | 36933434 | G | A | COSM1737962 | Probably damaging (1) | Tolerated (0.06) |
| 40 | DNMT3A | R882H | 2 | 25457242 | C | T | COSM52944 | Possibly damaging (0.651) | Deleterious (0.03) |
| 41 | CTCF | G111E | 16 | 67645067 | G | A | — | Probably damaging (1) | Tolerated (0.1) |
| 42 | TP53 | R174X | 17 | 7578212 | G | A | COSM99618 | — | Tolerated (1) |
| 43 | ETNK1 | T139P | 12 | 22778512 | A | C | — | Probably damaging (0.962) | Tolerated (0.16) |
| 44 | SRSF2 | P95L | 17 | 74732959 | G | A | COSM146288 | Possibly damaging (0.753) | Tolerated (0.1) |
| 45 | KMT2D | S2592fs | 12 | 49433779 | T | — | — | — | — |
| 46 | DNMT3A | R882S | 2 | 25457243 | G | T | COSM87001 | Probably damaging (0.993) | Deleterious (0) |
| 47 | BCOR | Q1396fs | X | 39921532 | G | — | — | — | — |
| 48 | TP53 | A150V | 17 | 7578283 | G | A | COSM44349 | Probably damaging (0.998) | Deleterious (0.03) |
| 48 | WT1 | R130Q | 11 | 32417913 | C | T | COSM28974 | Probably damaging (0.995) | Tolerated (0.12) |
| 49 | XPO7 | M751T | 8 | 21853017 | T | C | — | Benign (0) | Tolerated (0.56) |
| 49 | KMT2D | Q4221_L4222del | 12 | 49425824 | GCT | — | — | — | — |
| 50 | FLT3 | D835Y | 13 | 28592642 | C | A | COSM783 | Probably damaging (0.999) | Deleterious (0) |
| 51 | ASXL1 | V841fs | 20 | 31023038 | A | — | — | — | — |
—, not applicable; COSMIC ID, Catalogue Of Somatic Mutations In Cancer identifier; PolyPhen-2, Polymorphism Phenotyping v2; SIFT, Sorting Intolerant From Tolerant; UPN, unique patient number.
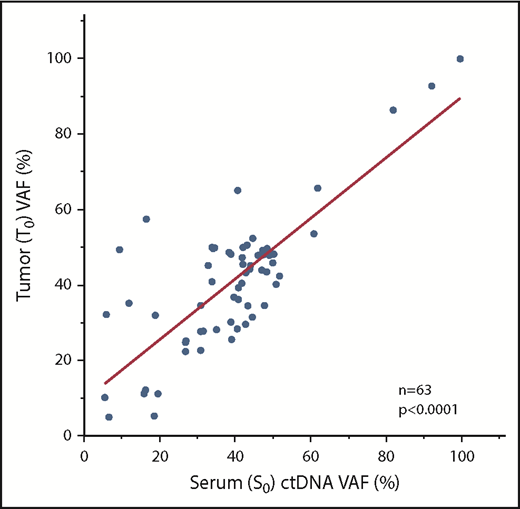
Comparison of VAFs between serum and matched tumor samples. Diagnostic tumor and matched serum ctDNA had excellent correlations with regard to VAFs. S0, serum sample at diagnosis; T0, tumor-rich samples at diagnosis.
Comparison of VAFs between serum and matched tumor samples. Diagnostic tumor and matched serum ctDNA had excellent correlations with regard to VAFs. S0, serum sample at diagnosis; T0, tumor-rich samples at diagnosis.
ctDNA reflected clonal dynamics
Next, we determined whether ctDNA could reflect the genetic architecture of the tumor (BM) in patients for whom we had extra assays (see supplemental Results for a full discussion). Specifically, in unique patient number (UPN) 22, with AML with myelodysplasia-related changes (AML-MRCs), we found TP53 p.E11Q as the founder mutation, whereas TP53 p.R158G was a secondary mutation, which accumulated later by clonal evolution and was associated with progression to leukemia (supplemental Figure 6). On the contrary, in UPN7 with AML-MRCs, we found GATA2 p.A364T as the founder mutation, whereas NRAS p.G12D was a secondary mutation. At clinical relapse, only GATA2 increased again, and NRAS was swept at recurrence (supplemental Figure 7). Notably, in UPN23 with AML-MRCs, where there was isolated breast relapse after alloSCT, SF3B1-mutated ctDNA increased prior to breast tumor biopsy, suggesting the presence of an extramedullary tumor (supplemental Figure 8).
Persistent molecular MRD status post-alloSCT predicted relapse and survival
We next screened molecular MRD status on the basis of either ctDNA-positive (CP) or mutation-positive (MP) at either 1 month or 3 months post-alloSCT (termed “CP1” or “CP3”; “MP1” or “MP3,” respectively) (Figure 2; supplemental Figure 5) to assess the possible association between CP and MP. There was clear concordance between CP and MP as indicated by a high Cohen κ score (where CP1 and MP1 = 0.66, moderate concordance; CP3 and MP3 = 1.0, good concordance) (supplemental Table 4).
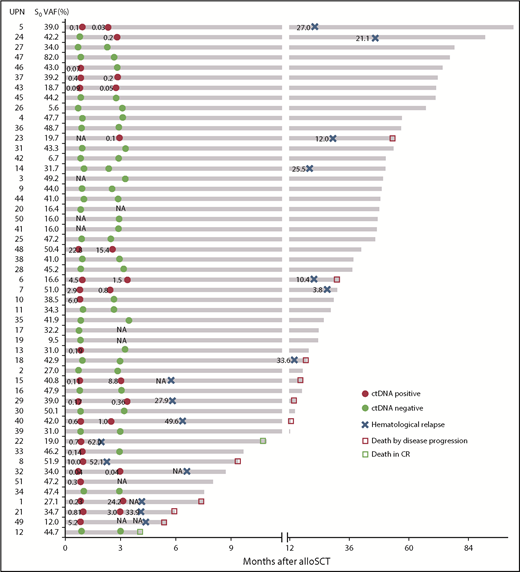
Representative results of ctDNA status at 1 and 3 months post-alloSCT and clinical events over time. Unique patient number (UPN) with increasing ctDNA status between 1 and 3 months (UPNs 1, 15, 21, 24, 29, and 40) are highlighted in bold. CR, complete remission; NA, not available.
Representative results of ctDNA status at 1 and 3 months post-alloSCT and clinical events over time. Unique patient number (UPN) with increasing ctDNA status between 1 and 3 months (UPNs 1, 15, 21, 24, 29, and 40) are highlighted in bold. CR, complete remission; NA, not available.
At a median follow-up of 32 months post-alloSCT, 16 of 51 patients relapsed at a median of 7 months (range, 1.9-53.6 months). We checked for an association between the molecular MRD status and outcome. As expected, patients with MP1 and MP3, and correspondingly CP1 and CP3, were associated with an increased risk of relapse and death compared with those with a molecular MRD− status (3-year CIR [3-year OS]: MP1 vs non-MP1, 72.9 [50.0%] vs 13.8 [88.0%], P = .0012 [.0304]; CP1 vs non-CP1, 65.6 [45.8%] vs 9.0 [91.7%], P = .0002 [.0014]; MP3 vs non-MP3, 80.0 [30.0%] vs 11.6 [94.1%], P = .0002 [.0007]; CP3 vs non-CP3, 71.4 [53.4%] vs 8.4 [92.5%], P < .0001 [.0021]) (Figure 3; hazard ratio [HR] for relapse and death are shown in Table 3). Overall, these results supported the relevance of serum ctDNA in molecular MRD testing as an alternative to BM mutation status.
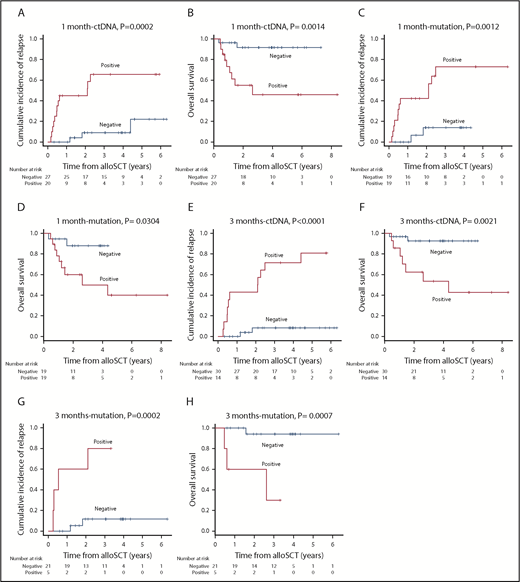
CIR and OS based on the residual status either of serum ctDNA or mutation in BM. CIR and OS according to residual status either of serum ctDNA (A-B) or mutation in BM (C-D) at 1 month post-alloSCT. CIR and OS according to residual status either of serum ctDNA (E-F) or mutation in BM (G-H) at 3 months post-alloSCT.
CIR and OS based on the residual status either of serum ctDNA or mutation in BM. CIR and OS according to residual status either of serum ctDNA (A-B) or mutation in BM (C-D) at 1 month post-alloSCT. CIR and OS according to residual status either of serum ctDNA (E-F) or mutation in BM (G-H) at 3 months post-alloSCT.
Risk of disease relapse and survival associated with biomarker status and patient characteristics
| Variables | Positive, N (%) | Relapse | Death | ||||||
|---|---|---|---|---|---|---|---|---|---|
| Sample source | Method | HR | 95% CI | P | HR | 95% CI | P | ||
| MRD persistence at 1 mo | |||||||||
| ctDNA | Serum | ddPCR | 20/47 (42.6) | 7.89 | 2.22-28.10 | .0014** | 8.24 | 1.77-38.37 | .0072** |
| Mutation | BM | ddPCR | 19/38 (50.0) | 8.03 | 1.79-35.96 | .0065** | 4.75 | 1.00-22.45 | .0494* |
| MC | BM | PCR/FISH | 11/45 (24.4) | 3.25 | 1.20-8.80 | .0202* | 1.22 | 0.33-4.53 | .7631 |
| FC | BM | Flow cytometry | 11/44 (25.0) | 0.33 | 0.07-1.48 | .1475 | 0.23 | 0.03-1.83 | .1650 |
| MRD persistence at 3 mo | |||||||||
| ctDNA | Serum | ddPCR | 14/44 (31.8) | 15.04 | 3.33-67.96 | .0004** | 8.04 | 1.66-38.88 | .0095** |
| Mutation | BM | ddPCR | 5/26 (19.2) | 13.03 | 2.36-72.04 | .0032** | 17.66 | 1.81-172.20 | .0135* |
| MC | BM | PCR/FISH | 5/38 (13.2) | 6.22 | 1.47-26.26 | .0129* | 5.78 | 0.95-35.06 | .0577 |
| FC | BM | Flow cytometry | 20/38 (52.6) | 0.91 | 0.25-3.45 | .9005 | 1.16 | 0.19-7.03 | .8751 |
| ctDNA kinetics | |||||||||
| Increasing | Serum | ddPCR | 6/40 (15.0) | 28.47 | 5.59-145.00 | .0001** | 17.35 | 3.21-93.68 | .0009** |
| Decreasing/stable | Serum | ddPCR | 11/40 (27.5) | 4.15 | 0.76-22.65 | .0868 | 1.04 | 0.09-11.44 | .977 |
| Both negative | Serum | ddPCR | 23/40 (57.5) | 1.00 | 1.00 | ||||
| Adverse prognostic variables | |||||||||
| Complex karyotype | BM | G-BAND | 15/51 (29.4) | 2.41 | 0.90-6.46 | .0794 | 1.73 | 0.53-5.52 | .3575 |
| −7/del7q karyotype | BM | FISH/G-BAND | 8/51 (15.7) | 0.67 | 0.15-2.97 | .6010 | 1.05 | 0.23-4.82 | .9494 |
| FLT3-ITD | BM/PB | PCR/NGS | 12/51 (23.5) | 2.47 | 0.89-6.85 | .0813 | 2.69 | 0.84-8.58 | .0953 |
| TP53 mutation | BM/PB | NGS | 6/51 (11.8) | 2.28 | 0.65-8.05 | .1999 | 3.27 | 0.88-12.12 | .0761 |
| RAS pathway mutation | BM/PB | NGS | 19/51 (37.3) | 2.59 | 0.96-6.99 | .0605 | 1.84 | 0.59-5.74 | .2911 |
| Age > 65 y | 8/51 (15.7) | 1.21 | 0.27-5.39 | .8040 | 2.81 | 0.74-10.75 | .1308 | ||
| Male | 29/51 (56.9) | 0.69 | 0.26-1.85 | .4601 | 0.68 | 0.22-2.11 | .5037 | ||
| Relapsed or refractory disease at alloSCT | 25/51 (49.0) | 1.91 | 0.71-5.63 | .2049 | 3.23 | 0.96-14.55 | .0584 | ||
CI, confidence interval; FISH, fluorescence in situ hybridization; FLT3-ITD, fms-like tyrosine kinase 3–internal tandem duplication.
P < .05; **P < .01.
Increasing ctDNA levels between 1 month and 3 months post-alloSCT could be the precise predictor of relapse
To determine whether we could stratify the risk of relapse based on ctDNA kinetics, we divided 40 patients, with available information of ctDNA at 1 month and 3 months, into 3 risk groups, based on their ctDNA kinetics: the “increasing” group (n = 6), including patients with negative-to-positive conversion or increasing level of ctDNA (≥1.5-fold increase in ctDNA at 3 months compared with baseline ctDNA at 1 month); the “both negative” group (n = 23), including patients both non-CP1 and non-CP3; and the “decreasing/stable” group (n = 11), including patients with positive-to-negative conversion or stable level of CP, meeting neither the criteria of “increasing” nor “both negative”. Results showed that patients in the increasing group were associated with a highest risk of relapse compared with those in decreasing/stable and both-negative groups (P = .0027 and P < .0001, respectively). Although not statistically significant, patients in the decreasing/stable group exhibited a clear trend of relapse compared with those in negative ctDNA (P = .087) (supplemental Figure 9; HR shown in Table 3). Based on these results, it is recommended that clinicians monitor ctDNA kinetics as well when predicting relapse.
Conventional mixed-chimerism status post-alloSCT also predicted relapse
We screened conventional MRD status at 1 month or 3 months post-alloSCT on the basis of being MC-positive (MCP; defined by total recipient chimerism ≥5%) or FC-positive (FCP) (termed “MCP1” or “MCP3”; “FCP1” or “FCP3”, respectively) (supplemental Table 4). Thereafter, we tested the prognostic impact of these conventional MRD approaches. Although we found significant association of both of MCP1 and MCP3 with relapse, only MCP3 had significant impact on survival (3-year CIR [3-year OS]: MCP1 vs non-MCP1, 72.0 [70.1%] vs 26.5 [72.3%], P = .00141 [.7630]; MCP3 vs non-MCP3, 70.0 [60.0%] vs 9.3 [89.1%], P = .0096 [.0321]) (supplemental Figures 10 and 11; HR for relapse and death are shown in Table 3). In contrast, neither FCP1 nor FCP3 had a prognostic impact on relapse and survival (supplemental Figures 10 and 11). We also investigated the association between previously reported adverse prognostic factors and relapse and survival. However, we did not find a significant association between them (Table 3).
Significant association of ctDNA persistence based on DNMT3A, TET2, or ASXL1 gene mutations and relapse
Because AML pathogenesis is generally assumed to proceed in a stepwise fashion from clonal hematopoiesis to full-blown leukemia, mutation persistence of the so-called founding mutation such as DNMT3A, TET2, or ASXL1 (termed “DTA”) may not be helpful in outcome prediction.17,18 Indeed, it is previously shown that DTA gene mutations are present in preleukemic clones, as well as in the transformed leukemic clone.17 To test this hypothesis, we performed a survival analysis, using a subset of patients, with DTA-based personalized ddPCR assays (n = 12). As a result, CP based on DTA genes also had the prognostic impact on relapse and survival (supplemental Figure 12).
To draw such conclusion in patients with DTA genes, it would be helpful to exclude the possibility of secondary relapse, unrelated to original AML or MDS clone, in these patients. Toward this, we performed WES of both diagnostic and relapsed samples to know the whole spectrum of driver mutations in these cases. As expected, we found the same spectrum of driver mutations in both diagnostic and relapsed samples, indicating that these patients exhibited real relapse (supplemental Table 5). We further classified these patients into 2 groups according to whether the highest VAF could be DTA mutations (termed “DTA-founder mutations”) or not (termed “other gene-founder mutations”). We then checked whether there could be significant difference in relapse incidence between the 2 groups (DTA-founder mutations vs other gene-founder mutations). However, there was no statistical significance of relapse incidence between the 2 groups, as per the log-rank test (P = .2345), suggesting that DTA mutation, irrespective of founder or nonfounder status, did not influence the relapse incidence. Based on these results, CP based on DTA genes was concluded to have prognostic impact on relapse.
Comparable prognostic ability of ctDNA to those of other MRD modalities
We compared the discriminatory ability of CP with those of MP and MCP. As mentioned earlier, there were high associations between CP and either MP or MCP (supplemental Table 4). Because multivariable regression analysis such as Cox analysis is not appropriate for adjusting or comparing variables with such highly significant associations, we used the DeLong test to compare the diagnostic performance between these MRD assays based on the AUC from ROC. The DeLong test revealed that there was no significant difference between either CP and MP or CP and MCP. Additionally, when CP1 was compared with CP3, CP3 was found to be a better indicator of relapse and survival (Figure 4; supplemental Figures 13 and 14). Overall, these results indicated that noninvasive ctDNA testing had comparable discriminatory ability to that of molecular and conventional MRD testing of BM with regard to identifying patients at high risk for relapse in MDS and AML after undergoing myeloablative alloSCT.
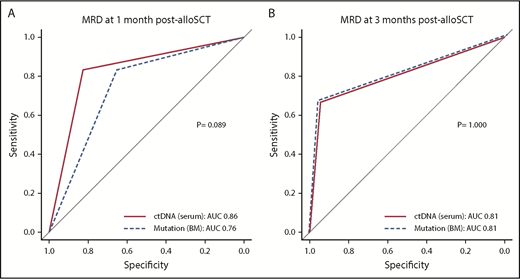
ROC curves for relapse prediction. (A) The sensitivity (y-axis) and specificity (x-axis) of either serum ctDNA persistence (solid line) or mutation persistence in BM (dashed line) at 1 month post-alloSCT from 35 evaluable patients. (B) The same plot for 3 months post-alloSCT from 24 evaluable patients.
ROC curves for relapse prediction. (A) The sensitivity (y-axis) and specificity (x-axis) of either serum ctDNA persistence (solid line) or mutation persistence in BM (dashed line) at 1 month post-alloSCT from 35 evaluable patients. (B) The same plot for 3 months post-alloSCT from 24 evaluable patients.
Serum ctDNA had benefit over bulk PB in relapse prediction
Although our study indicated that ctDNA persistence in PB was comparable to the mutation persistence in BM, whether serum ctDNA analysis has any benefit over bulk PB analysis still remains an open question. Eleven matched frozen PB mononuclear cell (PBMNC) samples were available from 9 patients (supplemental Table 6). When compared with CP and mutation persistence in the PBMNC fraction (termed “MP-PB”), we found a concordant result in 8 of 11 samples. However, in UPN29 and UPN32 with PB cytopenia, the result was discordant because only CP could predict relapse. Additionally, when diagnostic performance was compared by the DeLong test, CP was found to be a better indicator of relapse (P = .0253; supplemental Figure 15). This result supported the diagnostic relevance of ctDNA over bulk PB analysis, especially in certain settings, such as PB cytopenia.
Discussion
In this study, we assessed the value of MRD based on positive ctDNA status post-alloSCT in relapse prediction of patients with AML and MDS. For this aim, we performed initial high-throughput screening using NGS, followed by construction of personalized ddPCR assays. Our assays were applicable for nearly all patients. Patients with persistent ctDNA+ status either at 1 month or 3 months post-alloSCT had a significantly higher risk of relapse and death than those with negative status. Additionally, increasing ctDNA levels between 1 month and 3 months post-alloSCT was the precise predictor of relapse. Notably, surveillance of residual driver mutation persistence by BM and matched serum ctDNA persistence generally produced concordant results. Our study, for the first time, provides proof of concept that driver mutation persistence based on serum ctDNA can serve as a comparable prognostic biomarker for patients with AML and MDS undergoing alloSCT.
Numerous studies have investigated the value of MRD in AML or MDS and have consistently shown that MRD negativity, as defined by specified cutoff values, is highly prognostic for outcome.11,18-23 The recent introduction of NGS-based molecular approaches has further refined such MRD measurements with regard to broader applicability, specifically for patients for whom no conventional genetic marker for MRD testing was available18 or conventional MRD approaches such as FC or cytogenetics were negative.19,24,25 Indeed, some recent reports have indicated that NGS-based molecular MRD from BM post–induction chemotherapy also had a prognostic association with relapse and survival.18,19,26 This result is generally consistent with our result that MRD status (persistence of a driver mutation in BM post-alloSCT either at 1 month or 3 months) was a sensitive predictor of relapse. In these previous reports, the cutoff values were 0.5% to 5%,18,19,26 slightly higher than our cutoff value of 0.04%. This difference may be attributable to the different methods used for MRD testing, as we used ddPCR for MRD detection instead of NGS. Notably, another study that used ddPCR demonstrated the prognostic significance of a cutoff value for BM-MRD negativity of 0.0067% post–intensive chemotherapy in AML.27 However, an important issue in these previous studies is that sensitive MRD testing typically relies on invasive BM sampling, which could also hamper its use for repetitive testing for the close monitoring of MRD.
To date, data on the utility of MRD from PB post-alloSCT are relatively sparse, and the results regarding the prognostic impact are inconsistent.28 This is generally attributable to the fact that MRD from PB is generally less sensitive than that from BM, the magnitude of which is reported to be 1-log10 order.29,30 This is true even in the setting of relatively highly sensitive conventional qPCR-based methods targeting leukemia-associated gene alterations such as in fusion genes. In this regard, it is noteworthy that we report here comparable and highly concordant results of MRD testing for relapse prediction using BM- or PB-derived serum using the same modality, ddPCR. In addition to being noninvasive, it is also notable that our assays have high potential regarding applicability, predictivity, and sensitivity as well as an acceptable running cost. Compared with NGS, ddPCR-based methods were more sensitive for detecting mutation of a single gene (supplemental Table 7). In addition, ddPCR has an advantage of faster turnaround time for serial monitoring of MRD.31 Moreover, ddPCR could monitor MRD at a more affordable cost than NGS (ddPCR assay, $9 per sample, $193 to construct 1 assay; NGS (TDS) assay, $350 per sample). In contrast, there are 2 important disadvantages of ddPCR in MRD monitoring; first, 1 assay needs to be prepared for each nucleotide change in each driver mutation identified, which is clearly labor-intensive, and second, 1 ddPCR assay cannot usually screen multiple mutations simultaneously, as each assay is allele-specific (supplemental Table 7).
In line with our analysis, several recent studies have reported that ctDNA-based quantification of MRD with PB can be used as a complementary technique to BM testing for MRD analysis for some hematological malignancies.14 Of note, 2 studies have already evaluated the prognostic impact on relapse in the setting of postchemotherapy in smaller cohorts of patients with AML or MDS.14,32 However, no study to date has addressed the prognostic value of residual ctDNA post-alloSCT in patients with AML or MDS. Our study, for the first time, provides proof of concept that ctDNA can serve as a prognostic biomarker for patients with AML and MDS undergoing alloSCT. Our results also indicated that ctDNA testing may replace conventional MRD testing with BM as a noninvasive biomarker for prediction of impending relapse in these patients.
It has been also reported that ctDNA monitoring can provide insights into clonal tumor hierarchy and capture real-time subclonal dynamics in both solid tumors and hematological malignancies, including MDS. In the present study, the results for UPN7 and UPN22, 2 patients with AML-MRCs corroborated this finding. Of these, the results for UPN7 also highlighted the possibility that monitoring a single mutation in ctDNA samples may underestimate ctDNA-based MRD, especially if the mutation originated in a subclone that was eliminated by the selective pressures of alloSCT. Therefore, ctDNA quantitation should optimally monitor a combination of driver mutations or, alternatively, a single driver mutation in a founding clone (as defined by “tier 1” in our grading system of driver mutations) to avoid underestimating tumor burden. Additionally, the results for UPN23 supported the hypothesis that ctDNA can serve as a noninvasive alternative to conventional tissue biopsy, even in cases without BM disease, as previously reported in other hematological malignancies.14
In our study, serum ctDNA had noticeable advantages over bulk PB in relapse prediction, as evaluated by the DeLong test. It is presumable that sampling of ctDNA, but not bulk PB, might be suitable for monitoring mutation in patients with PB cytopenia, as illustrated in the discordant results observed in 2 patients (UPN29 and UPN32; supplemental Table 6). Because cytopenia is a common setting after alloSCT, ctDNA monitoring might be more appropriate for this purpose. In support of this notion, a previous study had reported that VAF of serum ctDNA, but not of bulk PBMNC, faithfully reproduced those of BM, irrespective of cytopenia in patients with MDS.32
There were some differences between our results and those of previous reports on MRD in patients with AML and MDS. First, previous reports uniformly supported the prognostic impact of tumor burden pre-alloSCT, including either refractory/nonremission disease status or therapy-refractory adverse cytogenetics and/or genetics, on relapse in patients with AML and MDS.33-35 In our cohort, we did not find this impact of these adverse factors on relapse. This difference could be due to the smaller subset of patients with such adverse factors in our cohort. Alternatively, our uniform highly myeloablative conditioning regimen played a substantial role in the clearance of BM tumors and matched tumor-derived ctDNA regardless of the presence of such adverse factors, including refractory disease status, as we previously reported.36 In support of the latter reason, it was previously reported that the risk of relapse was reduced by the use of a myeloablative regimen in patients with AML and MDS with therapy-refractory genetic risk factors such as RAS pathway mutation in AML and MDS. Second, we did not find a significant predictive value of FC for MRD. This might be attributable to the limited sensitivity of our commercially available FC assay, for which a maximum of a 3-color analysis for leukemia-associated immunophenotype assessment and maximum input of 10 000 cells per assays were available because of commercial reasons, making its sensitivity at most 0.5% to 1%. Third, accumulating recent reports have indicated that preleukemic mutations, including DTA, are not suitable for molecular MRD testing,17,18 although some reports disagreed with this result.37 According to these previous reports, removal of information regarding MRD positivity of DTA mutations in remission BM significantly improved the prediction of subsequent outcomes. This result is in marked contrast to our findings, in which a significant association between DTA-based persistent ctDNA status and relapse and survival was observed. This difference may be attributable to differences in the therapy setting, that is, chemotherapy vs alloSCT; it is well accepted that an adequate graft-versus-leukemia effect relies on the eradication of recipient hematopoiesis, both the nonleukemic or leukemic portions, to prevent relapse. In contrast, chemotherapy or autologous transplantation in the previous reports allowed hematopoietic recovery with preleukemic clones typically harboring such DTA mutations, which does not necessarily indicate an impending relapse.
Several limitations of this study should be acknowledged. First, although our findings indicated that single ctDNA testing at 3 months post-alloSCT was a strong predictor of relapse, identification of the most useful checkpoint for outcome prediction is an open issue in such ctDNA testing. Second, our approach does require a personalized ddPCR assay, and needs dedicated effort for its construction. Third, the limited sample size and retrospective nature of our study make it difficult to draw a definitive conclusion, especially for a subset of patients. Fourth, most patients studied here were relatively young and received a myeloablative conditioning regimen. Therefore, the prognostic significance of ctDNA testing might not be applicable to elderly patients with AML and MDS undergoing alloSCT with reduced-intensity conditioning. Our ongoing prospective study and future studies will address these issues.
In summary, we, for the first time, demonstrated that noninvasive ctDNA testing had comparable utility to molecular and conventional MRD testing of BM with regard to identifying patients at high risk for relapse in MDS and AML after undergoing myeloablative alloSCT. Increasing ctDNA levels between 1 month and 3 months was also a sensitive predictor of relapse. Although conventional modalities remain valuable for MRD testing and prospective large-scale analyses are needed to confirm our findings, this noninvasive ctDNA test and serial monitoring of kinetics might allow rapid clinical decision-making and, ultimately, subsequent risk-adapted therapeutic interventions post-alloSCT in AML and MDS.
Sequence data are available upon request to the corresponding author K.Y. (k-yoko@ims.u-tokyo.ac.jp), but the request must include a description of the research proposal.
The online version of this article contains a data supplement.
The publication costs of this article were defrayed in part by page charge payment. Therefore, and solely to indicate this fact, this article is hereby marked “advertisement” in accordance with 18 USC section 1734.
Acknowledgments
The authors are very grateful to the patients for their cooperation and to the following members of the molecular tumor board for helpful discussions: Masayuki Kobayashi, Koichiro Yuji, and Mako Yamamoto. The authors are also very grateful to the following medical staff at their institute for helpful assistance in sample preparation: Mai Mizusawa, Susumu Tanoue, Hiroto Ishii, Eri Watanabe, Etsuko Nagai, Motoko Mizukami, Yukihisa Tanaka, Maki Oiwa-Monna, and Kazuo Ogami.
This work was partially supported by the Center of Innovation Program from the Japan Science and Technology Agency (JST), and the Ministry of Education, Culture, Sports, Science and Technology (MEXT) Innovative Area (15H05912).
Authorship
Contribution: S.N., K.Y., and A.T. wrote and revised the manuscript; S.N., N.Y., K.K., M.O., T.T., A.K., and M. Ito performed the experiments; S.N. and K.Y. analyzed the data with E.S., R.K., R.Y., S.I., and S.M. providing assistance in the informatics analysis; M. Isobe, T.K., S.K., and S.T. participated in the treatment of the patients and acquired the clinical data; Y.W. and T.N.-I. provided vital samples; and K.Y. and A.T. designed and supervised the study.
Conflict-of-interest disclosure: A.T. received research funding from Chugai Pharma and Pfizer Pharma. The remaining authors declare no competing financial interests.
Correspondence: Arinobu Tojo, Division of Molecular Therapy, Advanced Clinical Research Center, The Institute of Medical Science, The University of Tokyo, 4-6-1 Shirokanedai, Minato-ku, Tokyo 108-8639, Japan; e-mail: a-tojo@ims.u-tokyo.ac.jp; and Kazuaki Yokoyama, Department of Hematology/Oncology, Research Hospital, The Institute of Medical Science, The University of Tokyo, 4-6-1 Shirokanedai, Minato-ku, Tokyo 108-8639, Japan; e-mail: k-yoko@ims.u-tokyo.ac.jp.

This feature is available to Subscribers Only
Sign In or Create an Account Close Modal