

Key Points
HAP1 loss in ALL prevents l-ASNase-evoked ER Ca2+ release and inhibits external Ca2+ entry, reducing [Ca2+]i rise and apoptotic cell death.
HAP1 is a novel ALL biomarker for l-ASNase resistance and may be used to define high-risk patients and design L-ASNase-resistant therapy.

Abstract
l-Asparaginase (l-ASNase) is a strategic component of treatment protocols for acute lymphoblastic leukemia (ALL). It causes asparagine deficit, resulting in protein synthesis inhibition and subsequent leukemic cell death and ALL remission. However, patients often relapse because of the development of resistance, but the underlying mechanism of ALL cell resistance to l-asparaginase remains unknown. Through unbiased genome-wide RNA interference screening, we identified huntingtin associated protein 1 (HAP1) as an ALL biomarker for l-asparaginase resistance. Knocking down HAP1 induces l-asparaginase resistance. HAP1 interacts with huntingtin and the intracellular Ca2+ channel, inositol 1,4,5-triphosphate receptor to form a ternary complex that mediates endoplasmic reticulum (ER) Ca2+ release upon stimulation with inositol 1,4,5-triphosphate3. Loss of HAP1 prevents the formation of the ternary complex and thus l-asparaginase-mediated ER Ca2+ release. HAP1 loss also inhibits external Ca2+ entry, blocking an excessive rise in [Ca2+]i, and reduces activation of the Ca2+-dependent calpain-1, Bid, and caspase-3 and caspase-12, leading to reduced number of apoptotic cells. These findings indicate that HAP1 loss prevents l-asparaginase–induced apoptosis through downregulation of the Ca2+-mediated calpain-1-Bid-caspase-3/12 apoptotic pathway. Treatment with BAPTA-AM [1,2-bis(2-aminophenoxy)ethane-N,N,N′,N′-tetraacetic acid tetrakis(acetoxymethyl ester)] reverses the l-asparaginase apoptotic effect in control cells, supporting a link between l-asparaginase-induced [Ca2+]i increase and apoptotic cell death. Consistent with these findings, ALL patient leukemic cells with lower HAP1 levels showed resistance to l-asparaginase, indicating the clinical relevance of HAP1 loss in the development of l-asparaginase resistance, and pointing to HAP1 as a functional l-asparaginase resistance biomarker that may be used for the design of effective treatment of l-asparaginase-resistant ALL.
Medscape Continuing Medical Education online
![]()
In support of improving patient care, this activity has been planned and implemented by Medscape, LLC and the American Society of Hematology. Medscape, LLC is jointly accredited by the Accreditation Council for Continuing Medical Education (ACCME), the Accreditation Council for Pharmacy Education (ACPE), and the American Nurses Credentialing Center (ANCC), to provide continuing education for the healthcare team.
Medscape, LLC designates this Journal-based CME activity for a maximum of 1.0 AMA PRA Category 1 Credit(s)™. Physicians should claim only the credit commensurate with the extent of their participation in the activity.
Successful completion of this CME activity, which includes participation in the evaluation component, enables the participant to earn up to 1.0 MOC points in the American Board of Internal Medicine's (ABIM) Maintenance of Certification (MOC) program. Participants will earn MOC points equivalent to the amount of CME credits claimed for the activity. It is the CME activity provider's responsibility to submit participant completion information to ACCME for the purpose of granting ABIM MOC credit.
All other clinicians completing this activity will be issued a certificate of participation. To participate in this journal CME activity: (1) review the learning objectives and author disclosures; (2) study the education content; (3) take the post-test with a 75% minimum passing score and complete the evaluation at http://www.medscape.org/journal/blood; and (4) view/print certificate. For CME questions, see page 2244.
Disclosures
Associate Editor Jorge Cortes served as an advisor or consultant for Amgen Inc., Pfizer Inc., and Takeda Pharmaceuticals North America, Inc. and received grants for clinical research from Pfizer Inc. and Takeda Pharmaceuticals North America, Inc. CME questions author Laurie Barclay, freelance writer and reviewer, Medscape, LLC and the authors declare no relevant financial relationships.
Learning objectives
Upon completion of this activity, participants will be able to:
Describe findings from genome-wide RNA interference screening that identifies HAP1 as a candidate gene for conferring l-asparaginase resistance and from specific knockdown of HAP1, according to an in vitro study
Determine the molecular and cellular mechanisms of HAP1 loss on l-asparaginase resistance, according to an in vitro study
Explain the association of HAP1 levels and l-asparaginase resistance in leukemic cells from patients with acute lymphoblastic leukemia and the clinical implications of these findings
Release date: May 16, 2019; Expiration date: May 16, 2020
Introduction
Acute lymphoblastic leukemia (ALL) is a malignancy that mostly occurs in children, decreasing in frequency with age, before increasing again at ∼50 years of age.1 High-intensity chemotherapy has improved the 5-year survival in pediatric (>2 years) ALL to >85%,2 and pediatric-based chemotherapy regimens have increased the survival of ALL patients up to 45 years of age.3 Infants (<12 months) and elderly ALL patients, however, have lower overall survival from factors such as mixed lineage leukemia/11q23 rearrangement, particularly in infants4 ; the presence of the Philadelphia chromosome and persistence of minimal residual disease, especially in adults5 ; and low tolerance for chemotherapy. As ALL treatment has intensified, the long-term survival particularly in children has remarkably improved but at the expense of increased toxicity that could lead to mortality. Even with more intensive therapy, a subset of patients still develops resistance, and refractory/relapsed children and adults have a 5-year survival estimate of ∼20%6 and <10%,7 respectively. To address these issues, interest has been directed at providing more selective and precise treatments. One approach is to stratify patients into risk groups based on clinical and laboratory profiles, but, thus far, these profiles have not been consistent in predicting the risk of relapse among groups.8 A promising approach is to identify molecular biomarkers of resistance to specific drugs, which would allow prediction of a patient’s response to these drugs. Thus, an appropriate ALL treatment regimen could be offered such that drugs that are expected to work in a subset of patients can be given at intensified levels but eliminated from the regimen of patients that are unlikely to respond to these drugs.
l-Asparaginase has been effectively used in ALL chemotherapy. Treatment regimens that include l-asparaginase result in higher remission induction in both pediatric and adult ALL compared with l-asparaginase–free regimens. l-Asparaginase works by catalyzing asparagine hydrolysis into aspartate and ammonia.9 Normally, asparagine is synthesized from other amino acids such as aspartic acid by asparagine synthetase.10 However, ALL cells have critically low levels of asparagine synthetase11,12 and, therefore, are not able to synthesize de novo asparagine13 and rely heavily on plasma asparagine for protein synthesis and survival. l-Asparaginase treatment rapidly depletes plasma asparagine, causing asparagine deficit, which inhibits protein synthesis, leading to leukemic cell death.
Different l-asparaginase preparations have been tried in ALL patients,14,15 including the Escherichia coli–derived native l-asparaginase (eg, Kidrolase) and pegylated (PEG) native l-asparaginase, and Erwinia chrysanthemi–derived l-asparaginase (Erwinase). The E colil-asparaginase and PEG-l-asparaginase are first-line treatments for ALL, but hypersensitivity and antibody-induced inactivation in up to 60% of cases have been reported.16,17 In patients with E colil-asparaginase hypersensitivity, PEG-l-asparaginase or Erwinial-asparaginase is a prescribed second -line treatment, with Erwinial-asparaginase becoming a third-line drug when PEG-l-asparaginase is offered as a second line treatment.
Although the use of l-asparaginase clearly benefits a considerable subset of ALL patients, some relapse because of the development of resistance, leading to a refractory disease. Potential mechanisms of resistance to l-asparaginase have been suggested. As indicated, antibodies could inactivate the enzyme.17 Development of a mechanism to upregulate asparaginase synthetase activity has also been proposed because a population of resistant cells were found to have increased levels of asparagine synthetase.18,19 Although this is consistent with the observed positive correlation between asparagine synthetase level and l-asparaginase resistance,20 lack of correlation between these factors has also been described,21,22 indicating the existence of other mechanisms that promote l-asparaginase resistance.23 Indeed, a previous study has shown opioid receptor μ1-mediated mechanism for Erwinase resistance in ALL.23 Here, we demonstrate a distinct mechanism whereby loss of huntingtin associated protein 1 (HAP1) confers l-asparaginase resistance in ALL cells. Our findings indicate that HAP1 loss prevents l-asparaginase–induced apoptosis by preventing the formation of the HAP1-huntingtin (Htt)-inositol 1,4,5-triphosphate receptor (InsP3R) ternary complex, resulting in reduced [Ca2+]i and downregulation of the Ca2+-mediated calpain-1-Bid-caspase-3/12 apoptotic pathway.
Materials and methods
Patient leukemic cell isolation
Peripheral blood samples were obtained from pediatric ALL patients at the Second Affiliated Hospital (Harbin, China), following the protocol approved by the Ethics Committee at Harbin Medical University (HMUIRB20150023). Patient peripheral blood samples diluted to double its original volume with phosphate-buffered saline (PBS) were layered on Ficoll-Paque (2:1 ratio) and then centrifuged at 1800 rpm (Beckman Allegra X-15R, SX4750) for 20 minutes at room temperature. Buffy coats were diluted with PBS, centrifuged at 1200 rpm (Beckman Allegra X-15R, SX4750), and white blood cell pellets were washed with PBS. Cells were resuspended in RPMI and viability was assessed by trypan blue exclusion assay.
Materials
ALL cells were cultured in RPMI supplemented with 10% fetal bovine serum (both Gibco, ON, Canada) and 100 units/mL each of penicillin and streptomycin. Kidrolase, a first-line l-asparaginase formulation, was from the Oncology Clinic at the Foothills Hospital in Calgary and Aru Narendran at the University of Calgary. Fluorescent dyes were from Thermo Fisher Scientific (Burlington, ON, Canada). Saponin and 2,5-di-tert-butylhydroquinone (TBHQ) were from Sigma (Oakville, ON, Canada), 1,2-Bis(2-aminophenoxy)ethane-N,N,N′,N′-tetraacetic acid tetrakis(acetoxymethyl ester) (BAPTA-AM) was from Abcam (Toronto, ON, Canada), and InsP3 was from Millipore (Etobicoke, ON, Canada). Antibodies to HAP1 (A-11), InsP3R (E-8), Htt (3E10), calnexin (AF18), calpain-1 (6C-12), Bid (B-3), caspase-3 (E-8), caspase-12 (1611), PARP1 (F-2), glyceraldehyde-3-phosphate dehydrogenase (GAPDH; 0411), and actin (I-19 or C-2) were from Santa Cruz Biotech (Dallas, TX). Antibody to cleaved caspase-3 (D1-75) was from Cell Signaling (Whitby, ON, Canada). Trypan blue was from Invitrogen (Life Technologies Co., ON, Canada).
shRNA library screening
The SEM leukemia cell line originating from the peripheral blood of a relapsed 5-year-old female ALL patient24 are (1) pediatric B-cell ALL cells, (2) grows well in vitro, and (3) have high retrovirus infection efficiency; thus, we used these cells as a model system for our study. SEM cells were infected with retrovirus carrying pRS-short hairpin RNA (shRNA) library23 or pRS vector alone. Infected cells were selected using puromycin (2 μg/mL) for 3 weeks (first screening); selected cells were cultured in the presence or absence of l-asparaginase (10 mIU/mL) for 2 weeks in the second round of screening. Single colonies were then isolated by colony formation assay in soft agar. Cells were mixed with 0.8% low melting point agarose in RPMI, containing 20% fetal bovine serum, 2 μg/mL puromycin, and 10 mIU/mL l-asparaginase and then plated on top of 0.8% normal melting point agarose for an additional week. Single colonies were isolated and amplified individually and as a pool.
Identification of genes that confer l-asparaginase resistance
Presence of shRNA inserts in cells infected with retrovirus carrying the shRNA library were determined by polymerase chain reaction (PCR) using genomic DNA (gDNA) as a template and pRS forward (1333-1355; CCCTTGAACCTCCTCGTTCGACC) and reverse (1953-1975; GAGACGTGCTACTTCCATTTGTC) primers. Reactions were carried out at 94°C for 5 minutes, 35 cycles of 94°C for 30 seconds, 60°C for 30 seconds, 72°C for 1 minute, and 72°C for 10 minutes. PCR products were resolved in 1% agarose gel and the 642-bp bands were cut, extracted, and sequenced using pRS-sequence primer (1697-1716; GCTGACGTCATCAACCCGCT) at the University of Calgary (AB, Canada) Core DNA services. Candidate genes were identified by comparing the barcodes with sequencing results. As proof of concept to validate our shRNA library screening results, we used 2 types of HAP1-depleted SEM cells for our mechanistic experiments: (1) cells infected with retrovirus carrying shHAP1 target sequence 1 (GAAGTATGTCCTCCAGCAA) and (2) a clone of cells (from the screening analysis) infected with retrovirus carrying shHAP1 target sequence 2 (GCTGATTTGCAGGAGGCA).
Determination of surviving fractions
Cells were treated with different concentrations of l-asparaginase with or without BAPTA-AM (0.5 μM) for the indicated times. Surviving cell fractions were quantified using Alamar blue assay (Invitrogen). Fifty percent inhibitory (IC50) values were calculated after plotting l-asparaginase dose-dependent survival of leukemic cells.
IP and immunoblotting
Immunoprecipitation (IP) of clarified cell lysates in RIPA buffer was performed using the indicated antibodies. IP samples or cell lysates were resolved by sodium dodecyl sulfate polyacrylamide gel electrophoresis (SDS-PAGE) and immunoblotted by also using the indicated antibodies. Western blot images were obtained using the ChemiDoc Imager (Bio-Rad) and using the optimal exposure setup. No enhancements were performed. Ratios of protein bands of interest vs actin were determined after densitometry using National Institutes of Health Image J 1.61.
See supplemental Materials and methods, available on the Blood Web site, for preparation of ER fractions, measurement of InsP3-induced endoplasmic reticulum (ER) Ca2+ release, single-cell Ca2+ imaging, measurement of resting [Ca2+]i, analyses for apoptosis and necrosis, and statistical analysis.
Results
Genome-wide RNAi screening identifies HAP1 as a candidate gene that confers l-asparaginase resistance
To identify resistance biomarkers for l-asparaginase, unbiased genome-wide RNAi screening25 for 24 000 distinct shRNAs was performed on the SEM cell line. SEM cells infected with retrovirus carrying the pRS-shRNA library were initially treated with puromycin for 3 weeks to select for infected cells, and subsequently with l-asparaginase for 2 weeks. As shown in Figure1A, SEM parental cells (*) infected with retroviral vector alone (*+pRS) were sensitive to l-asparaginase (IC50 = 177 ± 10.96 mIU/mL, n = 3) with only ∼20% of cells surviving after addition of 400 mIU/mL l-asparaginase. Conversely, cells infected with the shRNA library-containing vector (*+pRS-shRNA Lib) showed resistance to l-asparaginase (IC50 = 372 ± 15.99 mIU/mL, n = 3) with ∼50% of cells surviving in 400 mIU/mL l-asparaginase, and an IC50 that is significantly greater (twofold; P < .01) than that of control *+pRS cells. By PCR analysis of gDNA from pooled l-asparaginase–resistant cells (ie, infected with pRS-shRNA library), and using primers flanking the shRNA inserts, we detected a 642-bp PCR product following the first (puromycin) and second (l-asparaginase) screenings of these cells (Figure 1B). This observation indicates that the pRS-shRNA library-infected cells carry the retroviral shRNA insert, which accounts for cell survival after puromycin and l-asparaginase treatment. Two successive screening rounds and subsequent barcode sequencing of the shRNA insert PCR products from l-asparaginase–resistant clones led to the identification of HAP126 (Figure 1C) as a candidate resistance biomarker for l-asparaginase. As shown in Figure 1D, HAP1 is expressed in SEM cells (*) as well as in C1,27 MOLT3,28 TIB202,29 and POETIC223 ALL cell model systems.

RNAi screening identifies loss of HAP1 in l-asparaginase–resistant ALL cells. (A) Parental SEM leukemic cells (*) infected with shRNA library (Lib; open circles) showed resistance to l-asparaginase compared with cells infected with an empty pRS vector (red circles). Cells were treated with different concentrations of l-asparaginase for 4 days; surviving fractions were quantified by Alamar blue assay. Values are means ± standard error of the mean from 3 independent experiments. (B) Presence of a 642-bp shRNA insert in cells infected with retrovirus carrying the shRNA Lib following the first (puromycin) and second (l-asparaginase) screening. PCR was performed using gDNA as a template and pRS forward (CCCTTGAACCTCCTCGTTCGACC) and reverse (GAGACGTGCTACTTCCATTTGTC) primers. (C) Identification of HAP1 loss in l-asparaginase–resistant cells. l-asparaginase–resistant clones isolated by soft agar colony formation assay were subjected to gDNA isolation and PCR using the primers indicated previously. PCR products (642 bp) containing an shRNA insert resolved in 1% agarose gel were cut, extracted, and sequenced using the pRS-sequence primer GCTGACGTCATCAACCCGCT. The HAP1 target sequence was identified from 3 independent l-asparaginase–resistant clones. (D) HAP1 is expressed in SEM cells as well as C1, MOLT3, TIB202, and POETIC223 ALL cells. Cell lysates (80 μg) were resolved by SDS-PAGE and immunoblotted using HAP1 or actin antibody.
RNAi screening identifies loss of HAP1 in l-asparaginase–resistant ALL cells. (A) Parental SEM leukemic cells (*) infected with shRNA library (Lib; open circles) showed resistance to l-asparaginase compared with cells infected with an empty pRS vector (red circles). Cells were treated with different concentrations of l-asparaginase for 4 days; surviving fractions were quantified by Alamar blue assay. Values are means ± standard error of the mean from 3 independent experiments. (B) Presence of a 642-bp shRNA insert in cells infected with retrovirus carrying the shRNA Lib following the first (puromycin) and second (l-asparaginase) screening. PCR was performed using gDNA as a template and pRS forward (CCCTTGAACCTCCTCGTTCGACC) and reverse (GAGACGTGCTACTTCCATTTGTC) primers. (C) Identification of HAP1 loss in l-asparaginase–resistant cells. l-asparaginase–resistant clones isolated by soft agar colony formation assay were subjected to gDNA isolation and PCR using the primers indicated previously. PCR products (642 bp) containing an shRNA insert resolved in 1% agarose gel were cut, extracted, and sequenced using the pRS-sequence primer GCTGACGTCATCAACCCGCT. The HAP1 target sequence was identified from 3 independent l-asparaginase–resistant clones. (D) HAP1 is expressed in SEM cells as well as C1, MOLT3, TIB202, and POETIC223 ALL cells. Cell lysates (80 μg) were resolved by SDS-PAGE and immunoblotted using HAP1 or actin antibody.
Specific knockdown of HAP1 causes l-asparaginase resistance
To determine whether HAP1 loss does indeed confer l-asparaginase resistance in SEM cells, these cells were infected with retrovirus carrying shHAP1 #1. As shown in Figure 2A, shHAP1 #1 effectively diminished the expression of HAP1 messenger RNA (mRNA; left) and protein (right), and HAP1-depleted cells exhibited resistance to l-asparaginase (Figure 2B). l-asparaginase IC50 in HAP1-depleted cells (IC50 = 611 ± 43.40 mIU/mL, n = 3) was significantly higher (P < .01) compared with that in control cells (IC50 = 187 ± 11.80 mIU/mL, n = 3). More than 60% of HAP1-depleted cells survived the maximum l-asparaginase treatment (400 mIU/mL), whereas <20% of control cells survived this treatment. To support these findings, we also used 1 of the 3 l-asparaginase–resistant SEM clones that carry HAP1 shRNA #2 (target sequence: GCTGATTTGCAGGAGGCA; Figure 1C), which were isolated from our shRNA library screening. As shown in supplemental Figure 1, HAP1 depletion by infection with retrovirus carrying shHAP1 #2 also caused l-asparaginase resistance in SEM cells, further validating our shRNA library screening results. To examine the possibility that decreased cell death in l-asparaginase–treated HAP1-depleted cells could be due to a general reduction in apoptotic response of HAP1-deficient cells, ALL cells were treated were doxorubicin, another pro-apoptotic ALL drug. As shown in supplemental Figure 2, control and HAP1-depleted cells show similar sensitivity to doxorubicin, suggesting that HAP1 loss may specifically confer resistance to l-asparaginase.
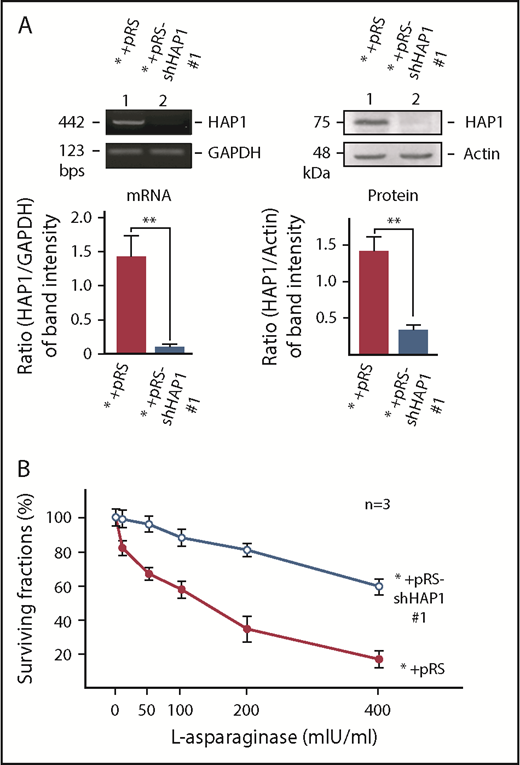
Specific knockdown of HAP1 confers l-asparaginase resistance. (A) Depletion of HAP1 mRNA (left) and protein (right) in cells infected with retrovirus carrying pRS-shHAP1 #1. Representative data (upper) from 1 of 3 independent experiments showing similar result patterns are shown. Bottom panels show the ratios of HAP1 levels vs GAPDH (for mRNA) or actin (for protein) levels from densitometric analysis of gel/blot images. Standard deviation for the 3 independent sets of experiments was calculated based on the ratios of the levels of HAP1 vs GAPDH (for mRNA) or vs actin (for protein) that were, in turn, based on densitometry of gels/blots using National Institutes of Health Image J 1.61 with the GAPDH and actin values, respectively, normalized to 1.0. (B) Infection of parental SEM leukemic cells (*) with retrovirus carrying pRS-shHAP1 #1 confers l-asparaginase resistance. Cells were treated with l-asparaginase for 4 days and surviving fractions were quantified using Alamar blue assay. Values are means ± standard error of the mean from 3 independent experiments.
Specific knockdown of HAP1 confers l-asparaginase resistance. (A) Depletion of HAP1 mRNA (left) and protein (right) in cells infected with retrovirus carrying pRS-shHAP1 #1. Representative data (upper) from 1 of 3 independent experiments showing similar result patterns are shown. Bottom panels show the ratios of HAP1 levels vs GAPDH (for mRNA) or actin (for protein) levels from densitometric analysis of gel/blot images. Standard deviation for the 3 independent sets of experiments was calculated based on the ratios of the levels of HAP1 vs GAPDH (for mRNA) or vs actin (for protein) that were, in turn, based on densitometry of gels/blots using National Institutes of Health Image J 1.61 with the GAPDH and actin values, respectively, normalized to 1.0. (B) Infection of parental SEM leukemic cells (*) with retrovirus carrying pRS-shHAP1 #1 confers l-asparaginase resistance. Cells were treated with l-asparaginase for 4 days and surviving fractions were quantified using Alamar blue assay. Values are means ± standard error of the mean from 3 independent experiments.
HAP1 loss prevents InsP3-InsP3R-mediated Ca2+ release from the ER
HAP1 interacts with Htt, which together with InsP3R, forms the HAP1-Htt-InsP3R complex that was implicated in mediating ER Ca2+ release.30 This suggests the importance of HAP1-Htt-InsP3R complex in the maintenance of intracellular Ca2+ homeostasis, which is critical for cell survival and perturbation of which can trigger apoptotic cell death.31 Because HAP1 loss induces l-asparaginase resistance, we sought to examine whether such loss and expected deficiency in the HAP1-Htt-InsP3R complex formation affect HAP1-Htt-InsP3R-mediated Ca2+ release from the ER. First, we noted that ER fractions from SEM cells infected with retrovirus carrying shHAP1 were depleted of HAP1 (Figure 3A). Levels of InsP3R and HTT were not much different in ER fractions from control and HAP1-depleted cells, and therefore, were unaffected by HAP1 depletion. Purity of ER fractions was determined by analysis for enrichment of the ER marker, calnexin, and lack of contamination by the cytoplasmic protein, GAPDH. The presence of Htt in both the S43 and ER fractions was expected because Htt is also a cytosolic protein.32 IP of HAP1, Htt, or InsP3R and subsequent immunoblotting showed the presence of all proteins in all immunoprecipitates from the ER fraction of control cells (Figure 3B, left), but markedly reduced amounts of HAP1 in immunoprecipitates from the ER of shHAP1-infected cells (Figure 3B, right), demonstrating that HAP1 loss leads to loss of HAP1/Htt/InsP3R complex formation in the ER. Given that the complex was implicated to mediate ER Ca2+ release,30 we examined whether HAP1 loss affects ER Ca2+ release. To do so, cells (5 × 10⁴) were loaded with an ER Ca2+ probe, Mag-Fluo-4-AM, and then treated with IP3 after permeabilization with saponin to facilitate IP3 access to IP3R. Ca2+ release was then measured every 2 seconds. We found that InsP3-induced InsP3R-mediated Ca2+ release from the ER was significantly (P < .05) reduced in HAP1-depleted cells compared with control cells, particularly at 100 nM InsP3 treatment (Figure 3C), indicating that HAP1 loss, leading to loss of HAP1/Htt/InsP3R complex formation, inhibits InsP3-activated InsP3R-regulated ER Ca2+ release.
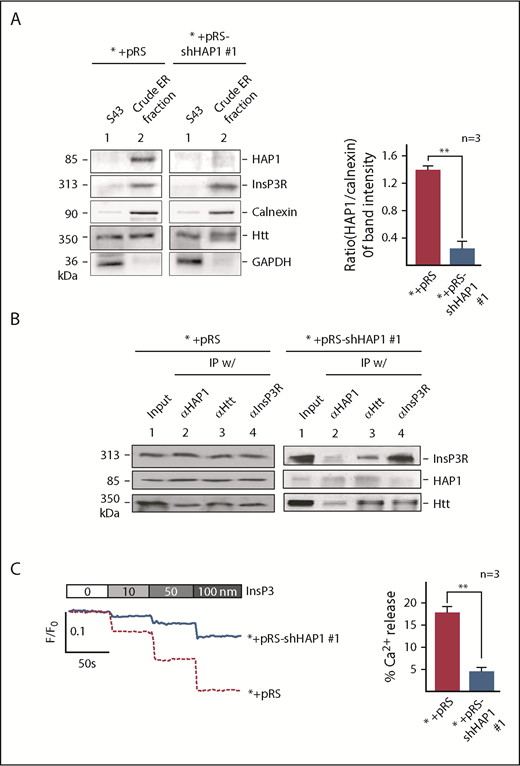
HAP1 depletion in leukemic cells inhibits InsP3-InsP3R–mediated Ca2+ release from the ER. (A) Crude ER fractions in SEM control cells or depleted of HAP1 were isolated,44 as described in “Materials and methods.” These were then examined for HAP1, Htt, and InsP3R levels, and ER enrichment and potential contamination with cytoplasmic proteins by immunoblotting for calnexin, an ER marker, and GAPDH, respectively. S43 denotes the supernatant from the crude ER preparation following centrifugation at 43 000 rpm (Beckman OptimaTM L-90K ultracentrifuge SW-41, as described in “Materials and methods”). Values are means ± standard error of the mean from 3 independent experiments. Calculation was based on the ratios of the levels of HAP1 vs calnexin that were, in turn, based on densitometry of blots with the calnexin value normalized to 1.0. (B) HAP1-depleted cells show reduced formation of the HAP1-Htt-InsP3R ternary complex. ER fractions from control (left) and HAP1-depleted (right) cells were lysed and subjected to IP using InsP3R, Htt, or HAP1 antibody. IP samples were resolved by SDS-PAGE and immunoblotted for HAP1, Htt, or InsP3R. (C) InsP3-InsP3R–mediated Ca2+ release from the ER is inhibited in HAP1-depleted cells. The chart on the right shows the difference in calcium release from internal stores of control and HAP1-depleted cells upon treatment with 100 nM InsP3. **P < .05. Measurement of Ca2+ release from the ER45 upon InsP3 treatment is described in “Materials and methods.” ER Ca2+ release was measured every 2 seconds using a Shimadzu RF 5301PC spectrofluorometer Ca2+ imaging at λex = 495 nm and λem = 530 nm. Representative data from 1 of 3 independent experiments showing similar result patterns, and indicating reproducibility, are shown in panels A-C.
HAP1 depletion in leukemic cells inhibits InsP3-InsP3R–mediated Ca2+ release from the ER. (A) Crude ER fractions in SEM control cells or depleted of HAP1 were isolated,44 as described in “Materials and methods.” These were then examined for HAP1, Htt, and InsP3R levels, and ER enrichment and potential contamination with cytoplasmic proteins by immunoblotting for calnexin, an ER marker, and GAPDH, respectively. S43 denotes the supernatant from the crude ER preparation following centrifugation at 43 000 rpm (Beckman OptimaTM L-90K ultracentrifuge SW-41, as described in “Materials and methods”). Values are means ± standard error of the mean from 3 independent experiments. Calculation was based on the ratios of the levels of HAP1 vs calnexin that were, in turn, based on densitometry of blots with the calnexin value normalized to 1.0. (B) HAP1-depleted cells show reduced formation of the HAP1-Htt-InsP3R ternary complex. ER fractions from control (left) and HAP1-depleted (right) cells were lysed and subjected to IP using InsP3R, Htt, or HAP1 antibody. IP samples were resolved by SDS-PAGE and immunoblotted for HAP1, Htt, or InsP3R. (C) InsP3-InsP3R–mediated Ca2+ release from the ER is inhibited in HAP1-depleted cells. The chart on the right shows the difference in calcium release from internal stores of control and HAP1-depleted cells upon treatment with 100 nM InsP3. **P < .05. Measurement of Ca2+ release from the ER45 upon InsP3 treatment is described in “Materials and methods.” ER Ca2+ release was measured every 2 seconds using a Shimadzu RF 5301PC spectrofluorometer Ca2+ imaging at λex = 495 nm and λem = 530 nm. Representative data from 1 of 3 independent experiments showing similar result patterns, and indicating reproducibility, are shown in panels A-C.
HAP1 loss inhibits l-asparaginase-evoked ER Ca2+ release and external Ca2+ entry, preventing a significant rise in [Ca2+]i
We then examined the effect of HAP1 loss on ER Ca2+ release upon l-asparaginase treatment by single-cell Ca2+ imaging of ratiometric Fura-2-loaded cells in Ca2+-free/EGTA-containing KRH buffer. We found that l-asparaginase treatment of control cells elicited a prompt increase in [Ca2+]i that declined gradually over 20 minutes (Figure 4A). Conversely, no significant increase in [Ca2+]i was observed following l-asparaginase treatment of HAP1-depleted cells, indicating that HAP1 loss inhibits l-asparaginase-induced ER Ca2+ release from the ER. Treatment with TBHQ, an ER Ca2+ pump inhibitor, caused a similar increase in [Ca2+]i in control and HAP1-depleted cells, indicating that these cells were viable during analysis. We then explored the possibility that HAP1 loss may also affect external Ca2+ entry and Ca2+ extrusion upon treatment with l-asparaginase. To do so, internal Ca2+ stores in Fura-2-AM–loaded cells were initially emptied by treatment with TBHQ in Ca2+-free/EGTA-containing buffer. Cells were then treated with l-asparaginase in the presence of TBHQ and subsequently with 2 mM Ca2+, which was added to the external buffer, to initiate Ca2+ entry (Figure 4B). Ca2+ extrusion was also measured in the presence of TBHQ following a switch to Ca2+-free/EGTA-containing buffer with TBHQ. Initial treatment with TBHQ, which causes the release of internal Ca2+ stores, allowing the measurement of internal Ca2+ store capacity, indicated that such capacity was significantly reduced in HAP1-depleted cells compared with control cells (Figure 4B-C). In the presence of l-asparaginase, Ca2+ entry following external Ca2+ addition was also significantly lower in HAP1-depleted cells compared with control cells (Figure 4B,D). The rate of Ca2+ influx was slower in HAP1-depleted cells, as indicated by increased half-life of influx (Figure 4B,E). In addition, the integrated Ca2+ signals, which correspond to the calculated area under the curve (ie, from the beginning to the end [back to baseline] of Ca2+ signal) was reduced in HAP1-deficient cells (Figure 4B,F). However, the rate of Ca2+ extrusion upon switching to Ca2+-free/EGTA-containing buffer with TBHQ, was similar in control and HAP1-depleted cells as shown by their similar slope of [Ca2+]i decline. Similar results were observed in the l-asparaginase–resistant SEM clone that carry HAP1 shRNA 2 (supplemental Figure 4). Resting [Ca2+]i levels was significantly lower in HAP1-depleted cells compared with control cells (Figure 4G). Together, our findings suggest that loss of HAP1 inhibits both l-asparaginase–induced ER Ca2+ release and external Ca2+ influx, avoiding a lethal rise in [Ca2+]I and causing ALL cell resistance to the drug.
![Figure 4. HAP1 depletion in leukemic cells inhibits l-asparaginase–induced increase in [Ca2+]i level. (A) l-Asparaginase–induced Ca2+ release from the ER is inhibited in HAP1-depleted cells. ER Ca2+ release in cells loaded with Fura-2-AM was measured by ratiometric single-cell Ca2+ imaging as described in “Methods and materials.” Graphs represent means of Ca2+ signal traces from 10 cells. Bar with 0 Ca2+ indicates the interval in which (Ca2+) in buffer is 0. (B) Analysis of the effects of HAP1 knockdown on ALL cell internal Ca2+ store capacity, and external Ca2+ entry and Ca2+ extrusion on treatment with l-asparaginase. [Ca2+]i in cells loaded with Fura-2 were also performed on treatment with TBHQ with or without l-asparaginase or Ca2+ using single-cell Ca2+ imaging as described in “Methods and materials.” Values represent means of Ca2+ signal traces from 9 cells. (C-F) Response of control and HAP1-depleted cells were analyzed and compared. (C) Internal Ca2+ store capacity in HAP1-depleted cells is significantly reduced compared with control cells. Release of internal Ca2+ stores on treatment with TBHQ allows measurement of internal Ca2+ store capacity. In the presence of l-asparaginase, (D) Ca2+ entry is reduced, and (E) the rate of [Ca2+]i influx is slower in HAP1-depleted cells compared with control cells. Comparison of the integrated Ca2+ signals (area under the curve from start of the Ca2+ signal until 22 minutes later) (F) showed decreased Ca2+ entry in cells depleted of HAP1, whereas the rate of extrusion of Ca2+ by the plasma membrane Ca2+ pumps, observed as the decline in [Ca2+]i following removal of external Ca2+, appears to be similar. (G) HAP1-depleted cells have reduced resting [Ca2+]i level compared with control cells. Resting [Ca2+]i levels were measured as described in “Methods and materials.” Values in C-G are means ± standard error of the mean from 3 independent experiments. **P < .05.](https://ash.silverchair-cdn.com/ash/content_public/journal/blood/133/20/10.1182_blood-2018-12-890236/3/m_blood890236f4.png?Expires=1769110405&Signature=ruBhTrMezdYP0zGTbOkgNcbT~71gv1z3~K3WaK7kICgyc4pmruS2PKXvePkxnaFXxWHF3AlCLJdJldpp2ylnNzp8zCuKN510zeC6dw45W2vCfb6IVknoUgnVz-nKMbfELjIdxZBj5trpB7DU6dEB-LyYDHQwlLZLOyIJn-FgHZNbR0ew9WYeFbcrn9z5HH~9yXpAdpQSdjpm2rdjT0gfjaABtuvhrCGJTvbY2t2LP0PNwj~MCpbZN00RQpTsMmkTP-R9QPN4C~U19bHmeoYdQH6mDQYss0pU9OZgASgpnDx1jCRgkG-XAgLDqZtuw7uCP6aCd~0JwcUXBgnebbo4Zg__&Key-Pair-Id=APKAIE5G5CRDK6RD3PGA)
HAP1 depletion in leukemic cells inhibits l-asparaginase–induced increase in [Ca2+]i level. (A) l-Asparaginase–induced Ca2+ release from the ER is inhibited in HAP1-depleted cells. ER Ca2+ release in cells loaded with Fura-2-AM was measured by ratiometric single-cell Ca2+ imaging as described in “Methods and materials.” Graphs represent means of Ca2+ signal traces from 10 cells. Bar with 0 Ca2+ indicates the interval in which (Ca2+) in buffer is 0. (B) Analysis of the effects of HAP1 knockdown on ALL cell internal Ca2+ store capacity, and external Ca2+ entry and Ca2+ extrusion on treatment with l-asparaginase. [Ca2+]i in cells loaded with Fura-2 were also performed on treatment with TBHQ with or without l-asparaginase or Ca2+ using single-cell Ca2+ imaging as described in “Methods and materials.” Values represent means of Ca2+ signal traces from 9 cells. (C-F) Response of control and HAP1-depleted cells were analyzed and compared. (C) Internal Ca2+ store capacity in HAP1-depleted cells is significantly reduced compared with control cells. Release of internal Ca2+ stores on treatment with TBHQ allows measurement of internal Ca2+ store capacity. In the presence of l-asparaginase, (D) Ca2+ entry is reduced, and (E) the rate of [Ca2+]i influx is slower in HAP1-depleted cells compared with control cells. Comparison of the integrated Ca2+ signals (area under the curve from start of the Ca2+ signal until 22 minutes later) (F) showed decreased Ca2+ entry in cells depleted of HAP1, whereas the rate of extrusion of Ca2+ by the plasma membrane Ca2+ pumps, observed as the decline in [Ca2+]i following removal of external Ca2+, appears to be similar. (G) HAP1-depleted cells have reduced resting [Ca2+]i level compared with control cells. Resting [Ca2+]i levels were measured as described in “Methods and materials.” Values in C-G are means ± standard error of the mean from 3 independent experiments. **P < .05.
HAP1 depletion in leukemic cells inhibits l-asparaginase–induced increase in [Ca2+]i level. (A) l-Asparaginase–induced Ca2+ release from the ER is inhibited in HAP1-depleted cells. ER Ca2+ release in cells loaded with Fura-2-AM was measured by ratiometric single-cell Ca2+ imaging as described in “Methods and materials.” Graphs represent means of Ca2+ signal traces from 10 cells. Bar with 0 Ca2+ indicates the interval in which (Ca2+) in buffer is 0. (B) Analysis of the effects of HAP1 knockdown on ALL cell internal Ca2+ store capacity, and external Ca2+ entry and Ca2+ extrusion on treatment with l-asparaginase. [Ca2+]i in cells loaded with Fura-2 were also performed on treatment with TBHQ with or without l-asparaginase or Ca2+ using single-cell Ca2+ imaging as described in “Methods and materials.” Values represent means of Ca2+ signal traces from 9 cells. (C-F) Response of control and HAP1-depleted cells were analyzed and compared. (C) Internal Ca2+ store capacity in HAP1-depleted cells is significantly reduced compared with control cells. Release of internal Ca2+ stores on treatment with TBHQ allows measurement of internal Ca2+ store capacity. In the presence of l-asparaginase, (D) Ca2+ entry is reduced, and (E) the rate of [Ca2+]i influx is slower in HAP1-depleted cells compared with control cells. Comparison of the integrated Ca2+ signals (area under the curve from start of the Ca2+ signal until 22 minutes later) (F) showed decreased Ca2+ entry in cells depleted of HAP1, whereas the rate of extrusion of Ca2+ by the plasma membrane Ca2+ pumps, observed as the decline in [Ca2+]i following removal of external Ca2+, appears to be similar. (G) HAP1-depleted cells have reduced resting [Ca2+]i level compared with control cells. Resting [Ca2+]i levels were measured as described in “Methods and materials.” Values in C-G are means ± standard error of the mean from 3 independent experiments. **P < .05.
HAP1 loss prevents l-asparaginase–induced apoptosis by downregulating the Ca2+-mediated calpain-1-Bid-caspase-3/12 apoptotic pathway
We then examined the expression of some of the components of the Ca2+-mediated apoptotic pathway in HAP1-depleted cells. As shown in Figure 5A (left and right), levels of activated calpain-1, t-Bid, and caspase-3 and caspase-12 were considerably reduced in HAP1-depleted cells compared with control cells. The caspase-3–mediated PARP1 cleavage product was also reduced in HAP1-depleted cells.

HAP1 loss promotes leukemic cell survival and prevents apoptosis through downregulation of the Ca2+-mediated calpain-1-Bid-caspase-3/12 apoptotic pathway. (A) SEM control cells or depleted of HAP1 were treated with l-asparaginase (10 mIU/mL) for 24 hours. Cell lysates were subjected to SDS-PAGE and immunoblotted (left) for HAP1, and intact and cleaved calpain-1, Bid, caspase-3, caspase-12 and PARP1, and actin. Representative blots from 3 independent experiments showing similar result patterns are shown. Charts on the right show the densitometry analysis (National Institutes of Health Image J 1.61) of blots from 3 independent experiments. Apoptotic and necrotic populations of cells double-stained with PI- and FITC-labeled Annexin V were assessed by flow cytometry. (B) SEM control cells are more vulnerable to apoptosis on l-asparaginase treatment compared with (C) HAP1-depleted cells. Apoptosis and necrosis were assessed after 12 hours of 10 mIU/mL of l-asparaginase treatment as described in “Methods and materials.” Values are means ± standard error of the mean from 3 independent experiments. **P < .05.
HAP1 loss promotes leukemic cell survival and prevents apoptosis through downregulation of the Ca2+-mediated calpain-1-Bid-caspase-3/12 apoptotic pathway. (A) SEM control cells or depleted of HAP1 were treated with l-asparaginase (10 mIU/mL) for 24 hours. Cell lysates were subjected to SDS-PAGE and immunoblotted (left) for HAP1, and intact and cleaved calpain-1, Bid, caspase-3, caspase-12 and PARP1, and actin. Representative blots from 3 independent experiments showing similar result patterns are shown. Charts on the right show the densitometry analysis (National Institutes of Health Image J 1.61) of blots from 3 independent experiments. Apoptotic and necrotic populations of cells double-stained with PI- and FITC-labeled Annexin V were assessed by flow cytometry. (B) SEM control cells are more vulnerable to apoptosis on l-asparaginase treatment compared with (C) HAP1-depleted cells. Apoptosis and necrosis were assessed after 12 hours of 10 mIU/mL of l-asparaginase treatment as described in “Methods and materials.” Values are means ± standard error of the mean from 3 independent experiments. **P < .05.
To further examine the link between l-asparaginase–induced apoptosis and [Ca2+]i increase, control cells were treated with l-asparaginase (10 mIU/mL) or the Ca2+ chelator BAPTA-AM, alone or both. l-asparaginase caused 18% apoptosis (Figure 5B; P < .05), which was inhibited by BAPTA-AM (P < .05) to a level equivalent to that of apoptosis induced by BAPTA-AM itself, indicating that l-asparaginase–induced apoptosis is primarily mediated by Ca2+. Although l-asparaginase also induced necrosis, this was not affected by BAPTA-AM treatment, suggesting that this is a Ca2+-independent process. HAP1-depleted cells showed a much reduced (P < .05) l-asparaginase–induced apoptosis (Figure 5C; 3%) compared with control cells (Figure 5B; 18%), and l-asparaginase–induced necrosis was also reduced (P < .05) in HAP1-depleted cells (2.5%) compared with control cells (6%), albeit the latter difference is relatively modest. Thus, HAP1 loss inhibits both l-asparaginase–induced apoptosis and necrosis.
ALL patient leukemic cells with reduced HAP1 levels exhibit resistance to l-asparaginase
To assess the clinical potential of HAP1 loss as a functional indicator of l-asparaginase resistance, we examined HAP1 levels and corresponding l-asparaginase IC50 values in leukemic cells isolated from 6 ALL patients. As shown in Figure 6A, HAP1 level is inversely proportional to l-asparaginase IC50: the lower the HAP1 level, the higher the l-asparaginase IC50. We also noted that nonrelapsed patients have relatively higher HAP1 levels and lower IC50 values compared with relapsed patients (Figure 6B). Together, these findings support a clinically functional link between loss of HAP1 and l-asparaginase resistance in ALL.
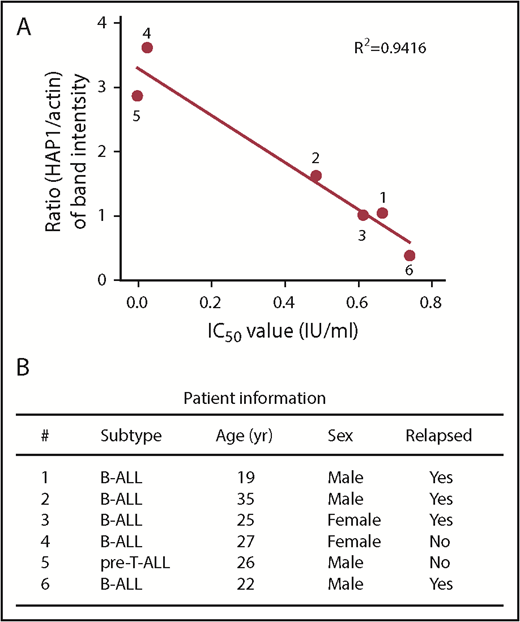
Reduced level of HAP1 in ALL patient leukemic cells correlates with increased resistance to l-asparaginase. (A) The panel of primary leukemia cell samples (n = 6) isolated from patient’s peripheral blood samples were treated with different concentrations of l-asparaginase, and IC50 values were calculated after plotting l-asparaginase dose-dependent survival of leukemic cells measured by Alamar blue assay. Ratios of the HAP1 vs actin levels in patient samples (n = 6) were determined following densitometry analysis of immunoblots using the National Institutes of Health Image J 1.61 software. Numbers by the symbols correspond to patient number in panel B, which shows patient information.
Reduced level of HAP1 in ALL patient leukemic cells correlates with increased resistance to l-asparaginase. (A) The panel of primary leukemia cell samples (n = 6) isolated from patient’s peripheral blood samples were treated with different concentrations of l-asparaginase, and IC50 values were calculated after plotting l-asparaginase dose-dependent survival of leukemic cells measured by Alamar blue assay. Ratios of the HAP1 vs actin levels in patient samples (n = 6) were determined following densitometry analysis of immunoblots using the National Institutes of Health Image J 1.61 software. Numbers by the symbols correspond to patient number in panel B, which shows patient information.
Discussion
In this study, we demonstrate that loss of HAP1 results in the development of ALL cell resistance to l-asparaginase. Consistent with our RNAi screening, which identified HAP1 as a biomarker for l-asparaginase resistance in ALL, we determined that knocking down HAP1, which we found to be expressed in all ALL cells tested, causes l-asparaginase resistance in our ALL model system. This proof of concept approach validates our data from the RNAi screening and showed that following treatment with l-asparaginase, HAP1-deficient cells have significantly greater survival than control cells.
Asparaginase activates the G-protein coupled protease-activated receptor 2, resulting in activation of phospholipase C, which cleaves phosphatidylinositol bisphosphate into diacylglycerol and InsP3.33 InsP3 binds to the InsP3R ligand-gated Ca2+ channel on the ER surface; such binding triggers the opening of the Ca2+ channel, releasing ER Ca2+ into the cytoplasm.34 Opening of the InsP3R Ca2+ channel by InsP3 requires HAP1-Htt interaction with the InsP3R carboxy terminus, implicating the HAP1-Htt-InsP3R complex as a functional mediator of InsP3-induced Ca2+ release from the ER.30
In ALL cells, l-asparaginase treatment resulted in a prompt increase in [Ca2+]i, which is consistent with the increased [Ca2+]i response of pancreatic acinar cells to asparaginase,33 although the latter showed repetitive Ca2+ spikes in the absence of external Ca2+. The discrepancy in response may be due to differences in cellular contexts. Nonetheless, we found that HAP1 loss, which causes loss of HAP1-Htt-InsP3R complex formation, inhibited not only the InsP3-induced Ca2+ release from the ER, but also prevented the l-asparaginase–induced ER Ca2+ release. Although the extent of inhibition of ER Ca2+ release from HAP1 loss appears to be greater in l-asparaginase–induced than InsP3-induced release, this may be due to the measurement of Ca2+ in the ER vs cytoplasm using 2 different Ca2+ probes, Mag-Fluo-4-AM (distribution coefficient = 22 μM) and Fura-2-AM (distribution coefficient = 224 nM), with different sensitivity or the measurement of Ca2+ using spectrofluorometer vs ratiometric single-cell microscopic imaging, or the involvement of additional factors in l-asparaginase–evoked InsP3R sensitization. Nevertheless, our findings suggest that HAP1 loss is sufficient to prevent l-asparaginase–mediated Ca2+ release from internal stores, which could promote ALL cell apoptosis.
Interestingly, loss of HAP1 reduces l-asparaginase–induced extracellular Ca2+ influx into ALL cells by 18%, but has no effect on the rate of Ca2+ extrusion, suggesting that HAP1 loss affects Ca2+ influx through Ca2+ channels in the plasma membrane.35 Thus, although l-asparaginase treatment in ALL cells causes both an immediate ER Ca2+ release and excessive extracellular Ca2+ influx, resulting in a toxic rise in [Ca2+]i that triggers apoptotic cell death, loss of HAP1 inhibits both l-asparaginase–mediated effects, preventing lethal elevation in [Ca2+]i, and causing ALL cell resistance to the drug.
Apoptotic cell death is mediated by a series of proteolytic events that involve cysteine proteases. Calpain-1 is activated by Ca2+, triggering activation of caspase-12.36 The pro-apoptotic Bid and the apoptosis executioner, pro-caspase-3, are then targeted and cleaved, generating their activated forms, t-Bid and caspase-3,37 respectively. PARP1 is a recognized caspase-3 substrate that is cleaved during apoptosis. Our studies showed that loss of HAP1 in ALL cells caused reduced levels of l-asparaginase–induced cleavage of calpain-1, Bid, procaspase-3 and procaspase-12, and PARP1, and significantly reduced l-asparaginase–induced apoptosis. This finding indicates that l-asparaginase treatment results in [Ca2+]i-mediated apoptosis. The ability of BAPTA-AM to almost completely reverse this process indicates that l-asparaginase–induced apoptosis is essentially mediated by Ca2+. Although l-asparaginase also causes cell death in pancreatic acinar cells by promoting [Ca2+]i increase,33 we further demonstrate a link between Ca2+ and l-asparaginase–induced apoptosis through our finding in ALL cells that HAP1 loss prevents l-asparaginase–induced apoptosis by downregulating the Ca2+-mediated calpain-1-Bid-caspase-3/12 apoptotic pathway. The lack of BAPTA-AM effect on l-asparaginase–induced necrosis indicates that this process is independent of Ca2+. Nonetheless, reduced l-asparaginase–induced apoptosis and necrosis in HAP1-deficient cells indicates that HAP1 loss inhibits both the apoptotic and necrotic pathways induced by l-asparaginase treatment. It appears that HAP1 loss specifically confers ALL cell resistance to l-asparaginase because cells depleted of HAP1 showed no resistance to doxorubicin.
Our finding that ALL patient leukemic cells with lower HAP1 levels are more resistant to l-asparaginase treatment than those with higher HAP1 levels supports the clinical significance of HAP1 loss as a novel biomarker for l-asparaginase resistance. However, considering the different genetic backgrounds and presence of asparaginase antibodies, further analyses in ALL patients is necessary. Interestingly, analysis of publicly available Oncomine multiple microarray datasets38 for HAP1 levels in ALL vs corresponding normal samples revealed that in 9 independent analyses, consisting of 1056 ALL patient samples, 49.9% (527/1056) had significantly (P < .05) downregulated levels of HAP1. However, there are no data on patient treatment history or genetic background and, therefore, what truly accounts for HAP1 downregulation is unknown. Nonetheless, the high percentage of ALL patients with reduced leukemic cell HAP1 levels may reflect the significance of HAP1 in ALL progression. Further analysis of a large-scale cancer genomics dataset in cBioPortal for Cancer Genomics39 revealed the occurrence of HAP1 deletions or mutations in hematopoietic and other cancers: HAP1 is deleted in 0.5% of acute myeloid leukemia, and mutated in 3.4% of diffuse large B-cell lymphoma, 2.1% of lymphoid neoplasm diffuse B-cell lymphoma, and 1.0% of multiple myeloma. It is also deleted in 2.9% of metastatic breast cancer, 4.5% of adrenocortical carcinoma, and 2.1% of prostate adenocarcinoma, and mutated in 8.1% of melanoma treated with pembrolizumab and nivolumab. These findings may imply HAP1 involvement in the development of other types of cancer and potentially, in their development of drug resistance. Our further effort to analyze the link between HAP1 level (or deletion or mutation) and treatment outcome in clinical samples using published gene expression databases,40-42 including the NCBI Gene Expression Omnibus database,43 was unsuccessful; the microarray data showed that HAP1 expression level in samples was too low to be considered as reliable or having insufficient data.
In conclusion, our investigations identify HAP1 as a useful biomarker for l-asparaginase resistance in ALL and suggest that HAP1 can be exploited to define high-risk ALL patients. In addition to using HAP1 expression for stratifying patients to predict l-asparaginase treatment outcome, Hap1 may serve as a target for new therapies. It will be interesting to know whether HAP1 loss-mediated dysregulation of [Ca2+]i is also used to develop resistance to other ALL drugs.
The online version of this article contains a data supplement.
The publication costs of this article were defrayed in part by page charge payment. Therefore, and solely to indicate this fact, this article is hereby marked “advertisement” in accordance with 18 USC section 1734.
Acknowledgments
The authors thank the Oncology Clinic at the Foothills Hospital in Calgary and Aru Narendran for providing l-asparaginase. The authors also thank Wayne Chen for the helpful discussions on our Ca2+ studies and allowing us to use his Ca2+ imaging equipment and Deepa Bhojwani at the University of Southern California for assisting us in analyzing HAP1 levels, treatment response, and patient outcome using the NCBI Gene Expression Omnibus database.
This work was supported by a grant from the Canadian Institutes of Health Research (MOP-123400) (K.-Y.L.).
Authorship
Contribution: S.K. and J.K.L. performed most of the experiments and drafted the manuscript; J.W. provided blood samples obtained from children diagnosed with leukemia; X.W. isolated leukemic cells from patient’s blood samples and performed the experiment described in Figure 6; X.G., Y.J., S.F., and H.-G.B. contributed significantly to the analysis and interpretation of data and/or provided constructive comments on experimental design and/or the preparation and writing of the manuscript; K.-Y.L. conceived the study; and J.L.R. and K.-Y.L. critically revised the manuscript for important intellectual content and wrote the final version of the manuscript.
Conflict-of-interest disclosure: The authors declare no competing financial interests.
Correspondence: Ki-Young Lee, Department of Cell Biology and Anatomy, University of Calgary, 3330 Hospital Dr NW, Room 359, HMRB, Calgary, AB T2N 4N1, Canada. e-mail: kylee@ucalgary.ca.
