

Key Points
A competitive in vivo gain-of-function screen identifies C3orf54/INKA1 as a gene regulating LSC repopulation kinetics.
INKA1 overexpression stalls LSC transiently in G0 without abolishing regenerative potential; silencing has the opposite effect.

Abstract
There is a growing body of evidence that the molecular properties of leukemia stem cells (LSCs) are associated with clinical outcomes in acute myeloid leukemia (AML), and LSCs have been linked to therapy failure and relapse. Thus, a better understanding of the molecular mechanisms that contribute to the persistence and regenerative potential of LSCs is expected to result in the development of more effective therapies. We therefore interrogated functionally validated data sets of LSC-specific genes together with their known protein interactors and selected 64 candidates for a competitive in vivo gain-of-function screen to identify genes that enhanced stemness in human cord blood hematopoietic stem and progenitor cells. A consistent effect observed for the top hits was the ability to restrain early repopulation kinetics while preserving regenerative potential. Overexpression (OE) of the most promising candidate, the orphan gene C3orf54/INKA1, in a patient-derived AML model (8227) promoted the retention of LSCs in a primitive state manifested by relative expansion of CD34+ cells, accumulation of cells in G0, and reduced output of differentiated progeny. Despite delayed early repopulation, at later times, INKA1-OE resulted in the expansion of self-renewing LSCs. In contrast, INKA1 silencing in primary AML reduced regenerative potential. Mechanistically, our multidimensional confocal analysis found that INKA1 regulates G0 exit by interfering with nuclear localization of its target PAK4, with concomitant reduction of global H4K16ac levels. These data identify INKA1 as a novel regulator of LSC latency and reveal a link between the regulation of stem cell kinetics and pool size during regeneration.
Introduction
Acute myeloid leukemia (AML) is an aggressive hematologic malignancy organized as a functional hierarchy driven by self-renewing leukemia stem cells (LSCs).1 Properties of LSCs assayed by xenotransplantation, as well as transcriptomic, proteomic, and epigenetic LSC signatures, have been shown to be highly prognostic in AML, and can predict therapy resistance.2-8 Relapse is frequent in AML, despite high rates of remission after conventional chemotherapy, and has been linked to persistence of LSC clones present at diagnosis.9 Although links to LSC quiescence have been established,10 the mechanisms whereby LSCs resist chemotherapy are uncertain.9,11,12 The development of more effective therapies to target LSCs and prevent relapse requires a better understanding of the mechanisms underlying LSC self-renewal, persistence, and regeneration.
Our mechanistic knowledge of LSC biology is still in its infancy because of the challenge of inter- and intrapatient disease heterogeneity, variability in LSC frequency, and lack of universal LSC markers for prospective isolation.1 The gold standard assay for LSCs is xenotransplantation to determine their ability to reestablish the disease in immunocompromised mice.13 However, repopulation kinetics among individual AML samples are highly variable, with some samples generating a leukemic graft only after a delay of 4 months postxenotransplantation (ie, exhibiting a long latency).14,15 Indeed, some LSC subclones can only be detected after activation through transplantation into secondary or tertiary recipients.16 These data are consistent with quiescent LSCs persisting at undetectable levels while retaining disease-initiating properties. Whereas quiescence is a stem cell state attributed to both LSCs10 and their normal counterparts17,18 that involves withdrawal from the cell cycle for a period of time, the variable engraftment kinetics of LSCs imply heterogeneity in their latency, which manifests functionally as generation of leukemic progeny after variable periods of persistence at low or undetectable levels. The molecular pathways that regulate processes contributing to latency in LSCs, including entry to and exit from quiescence, remain largely unknown.
Previous functional screens using RNAi libraries or single gene overexpression to investigate potential stem cell regulators in in vivo murine models of normal HSC and AML or in human cord blood (CB) ex vivo have yielded valuable insights into stem cell biology.19-24 To study the molecular mechanisms underlying regulation of LSC stemness properties in human AML, we developed a novel competitive in vivo gain-of-function screen, using xenograft assays. Previous transcriptome analysis of functionally defined LSC fractions from samples from patients with AML has revealed that LSCs and normal hematopoietic stem cells (HSCs) possess highly concordant gene expression signatures, implicating molecular mechanisms that are conserved in these 2 populations.2,3,9 We therefore performed the screen, using human CD34+ CB cells to identify universal stemness regulators from these signatures independent of mutational status and clonal diversity.
Methods
Lentiviral vector constructs, transduction, and cell culture
The cDNAs of candidate genes were obtained as Gateway (Thermo Fisher Scientific) donor plasmids, as specified in supplemental Table 3, available on the Blood Web site, and cloned into pRRL-based and Gateway-adapted, barcoded lentiviral vectors in which transgene expression is driven by the SFFV promoter and tagBFP expression by a chimeric EF1α/SV40 promoter (supplemental Figure 2A). Viral particle production and titration are described in supplemental Methods. After prestimulation (16-20 hours) in the respective medium, CB and 8227 AML transduction and culture were carried out at a cell density of 1 to 5 × 10⁵/mL in X-VIVO 10 (Lonza), supplemented with l-glutamine (GIBCO), Pen/Strep (GIBCO), and either low cytokine conditions17 and 1% bovine serum albumin (Roche) for CB or the previously described10 8227 AML cytokine mix and 20% BIT (serum supplement with bovine serum albumin, insulin, and transferrin, Stem Cell Technologies; cytokines from Miltenyi).
Flow cytometric analysis and sorting
CB and 8227 AML cells were resuspended at 106 cells/mL for surface antibody staining, as in supplemental Table 1. Cell preparation for intracellular staining was performed as described before,17 and antibodies were used as indicated (supplemental Table 1). Other flow cytometry-based assays were performed according to the manufacturer’s protocol: CellTrace Far Red (Invitrogen), AnnexinV-FITC Kit (BD), APC BrdU Flow Kit (BD Pharmingen). Cells were sorted on fluorescence-activated cell sorting (FACS) Aria III (Becton Dickinson), SH800 (Sony), or MoFlo (Beckman Coulter) sorters or analyzed on Fortessa, Canto II, or Celesta instruments (BD).
Xenotransplantation
Animal experiments were performed in accordance with institutional guidelines approved by the University Health Network animal care committee. Eight- to 16-week-old male and female NSG (NOD.Cg-Prkdcscid Il2rgtm1Wjl/SzJ),25 NSG-SGM3 (human SCF, GM-CSF, IL3 expressing),9 or nonobese diabetic/severe combined immunodeficiency-SGM326 mice were sublethally irradiated (225 cGy) 24 hours before intrafemoral injection. For analysis, mice were euthanized and femora and tibiae were flushed in Iscove modified Dulbecco medium, and 5% of cells were analyzed by flow cytometry. For purification of CB or 8227 AML-derived cells from xenotransplanted mice, bone marrow (BM) from individual mice or from pools of 2 to 5 mice were mouse cell-depleted and human progenitor-enriched (Mouse/Human Chimera Isolation Kit, StemSep Human Progenitor Cell Enrichment Kit, Stem Cell Technologies) or only mouse cell-depleted (Mouse Cell Depletion Kit, Miltenyi). Enriched cells were directly analyzed by flow cytometry, flow sorted, or subjected to DNA extraction.
Immunofluorescence microscopy
Sorted cells were spun onto Poly-L-Lysine (Sigma)-coated slides (Ibidi, 200g, 10 min), fixed with 4% paraformaldehyde (Sigma), and permeabilized with 0.5% Triton (Sigma) before blocking (phosphate-buffered saline, 10% fetal bovine serum, 5% bovine serum albumin). Slides were incubated with primary antibodies in blocking solution overnight at 4°C, as indicated in supplemental Table 1. Secondary anti-mouse AF568 (Invitrogen, 1:400) antibody was added (phosphate-buffered saline, 0.025% Tween, Sigma, 1.5 hours, room temperature). After washing, nuclei were stained with 1 μg/mL 4′,6-diamidino-2-phenylindole (Invitrogen), and slides were mounted (Fluoromount G, Invitrogen). Images were captured by a Zeiss LSM700 Confocal (oil, 63×/1.4 NA, Zen 2012) and analyzed with ImageJ/Fiji and FlowJo10.
Detailed methods can be found in the supplemental Methods.
Results
Competitive in vivo stemness screen selects for genes promoting repopulation latency
In previous work to develop a predictive and prognostic signature related to stemness, we identified a list of 104 genes (LSC104) that were differentially expressed between 138 LSC+ and 89 LSC− cell fractions obtained from 78 patients with AML and validated by xenotransplantation.3 In silico analysis of downstream converging protein interactions combining this LSC gene list and a previous data set of HSC vs LSC genes,2,27 as well as other well-known AML genes, identified an additional 21 densely interconnected genes (supplemental Tables 2 and 3). For our initial screen, we proceeded with 64 candidates from this list (supplemental Figure 1 and supplemental Methods for detailed parameters of the screening method). In contrast to screening methods in which vectors are produced from plasmid pools, our protocol involved pools of target cells that were separately transduced by individual vectors harboring barcodes enabling downstream deconvolution by digital droplet polymerase chain reaction (ddPCR; supplemental Figure 2; supplemental Table 4). We established a highly predictive titration protocol for transduction of CD34+CD38− (stem) and CD34+CD38+ (progenitor) CB cells to normalize transduction efficiencies and to guarantee initially balanced cell pools (supplemental Figures 3-5). This allowed for pooling and transplantation within a narrow time frame (1 day), minimizing loss of stemness from in vitro culture. In 2 parallel screens, stem and progenitor enriched cell fractions were transduced with 64 lentiviral vectors and assembled into 16 pools, each consisting of 8 individual gene-transduced populations (Figure 1A). Accordingly, in both screens, every gene was assessed in 2 independent pools, competing against a different set of 7 genes in each pool (supplemental Figure 2C). Stem and progenitor transduced pools were transplanted into NSG (for 20 weeks; n = 96) or NSG-SGM3 (for 4.5 weeks; n = 73) mice, respectively (Table 1), to identify genes of interest promoting long-term repopulation and self-renewal of primitive cells and/or expansion of committed progenitor cells.
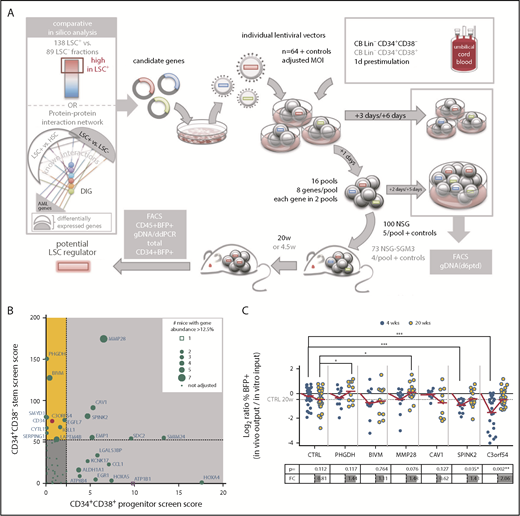
In vivo competitive gain-of-function screen selects for genes promoting repopulation latency. (A) Screen outline: From 64 candidate genes obtained by comparative in silico analysis, lentiviral vectors were produced individually and used at matching multiplicity of infection (MOI) to transduce CB lineage negative (Lin−) CD34+CD38− cells for a stem screen and CB Lin−CD34+CD38+ for a progenitor screen. The next day, 16 pools were assembled, each from 8 individually transduced cell populations, and transplanted intrafemoral into 5 NSG or 4 NSG-SGM3 mice per pool, respectively. Aliquots of individual and pooled samples were in vitro cultured for an additional 5 days for flow cytometric (BFP/gene marking) analysis and genomic DNA isolation for pool composition analysis at input. BM of mice was harvested at 20 or 4.5 weeks for flow cytometric and genomic DNA analysis, and engraftment and candidate gene contribution was scored. (B) For each candidate gene, a score was calculated in both screens by multiplying the output/input ratio for %BFP+ and percent vector copies (barcode abundance) per mouse, and adding a competition score in increments if the gene’s contribution to a pool was more than 1/8 (supplemental Figure 9A).The final score was obtained by accumulation of these individual scores/mouse for all mice analyzed carrying that candidate gene, and used to create a matrix of scores in both screens. Genes scoring in the stem screen only are highlighted in yellow. The score obtained for C3orf54 is highlighted in red. (C) The progeny of 10 000 CB Lin−CD34+CD38− cells transduced with the indicated overexpression vectors were transplanted into NSG mice 1 day after transduction. Input was assessed as mean of transduction efficiency at day 3 and day 6 posttransduction (ptd). Mice were analyzed for human (CD45+) chimerism (injected femur) and %BFP+ within the CD45+ cell fraction after 4 and 20 weeks. Shown are log2 ratios (%BFP+ of CD45+ in vivo output/%BFP+ in vitro input) of 2 to 5 independent experiments, adding up to 9 to 33 mice per time point and candidate. The table below indicates the P values (Student t test) and FC for the comparison of 4- and 20-week ratios per gene. *P < .05; **P < .01; ***P < .001. DIG, densely interconnected genes.
In vivo competitive gain-of-function screen selects for genes promoting repopulation latency. (A) Screen outline: From 64 candidate genes obtained by comparative in silico analysis, lentiviral vectors were produced individually and used at matching multiplicity of infection (MOI) to transduce CB lineage negative (Lin−) CD34+CD38− cells for a stem screen and CB Lin−CD34+CD38+ for a progenitor screen. The next day, 16 pools were assembled, each from 8 individually transduced cell populations, and transplanted intrafemoral into 5 NSG or 4 NSG-SGM3 mice per pool, respectively. Aliquots of individual and pooled samples were in vitro cultured for an additional 5 days for flow cytometric (BFP/gene marking) analysis and genomic DNA isolation for pool composition analysis at input. BM of mice was harvested at 20 or 4.5 weeks for flow cytometric and genomic DNA analysis, and engraftment and candidate gene contribution was scored. (B) For each candidate gene, a score was calculated in both screens by multiplying the output/input ratio for %BFP+ and percent vector copies (barcode abundance) per mouse, and adding a competition score in increments if the gene’s contribution to a pool was more than 1/8 (supplemental Figure 9A).The final score was obtained by accumulation of these individual scores/mouse for all mice analyzed carrying that candidate gene, and used to create a matrix of scores in both screens. Genes scoring in the stem screen only are highlighted in yellow. The score obtained for C3orf54 is highlighted in red. (C) The progeny of 10 000 CB Lin−CD34+CD38− cells transduced with the indicated overexpression vectors were transplanted into NSG mice 1 day after transduction. Input was assessed as mean of transduction efficiency at day 3 and day 6 posttransduction (ptd). Mice were analyzed for human (CD45+) chimerism (injected femur) and %BFP+ within the CD45+ cell fraction after 4 and 20 weeks. Shown are log2 ratios (%BFP+ of CD45+ in vivo output/%BFP+ in vitro input) of 2 to 5 independent experiments, adding up to 9 to 33 mice per time point and candidate. The table below indicates the P values (Student t test) and FC for the comparison of 4- and 20-week ratios per gene. *P < .05; **P < .01; ***P < .001. DIG, densely interconnected genes.
Screen details, input, and analysis
| Stem screen | Progenitor screen | |
|---|---|---|
| Target cells | CB CD34+CD38− | CB CD34+CD38+ |
| Aimed transduction efficiency (mean achieved), % | 15 (13) | 25 (28) |
| Mouse strain | NSG | NSG-SGM3 |
| Total number of mice, sex, age, wk | 100 (96), male, 8 | 73, male and female, 8-16 |
| Group size, mice/pool | 5 (ctrl 4) | 4 |
| Cell count/ mouse, progeny plated | 10 000 | 21 000 |
| Controls | Negative: empty, LUC, gp91P415H;positive: DNAJB9, ID2 | Negative: LUC, gp91P415H, nontransduced (1×) |
| Analysis (BM: DNA, FACS), wk | 20 | 4.5 |
| FACS | CD45, BFP, CD34, viability | |
Transplantation of stem-enriched pools (mean input %BFP+: 13% and 28%; Table 2) resulted in engraftment of up to 69% BFP+ human CD45+ cells in the BM, with individual candidate gene abundance of up to 97% of BFP+ cells (supplemental Figures 6-10). In both the stem and the progenitor screens, we observed diverse patterns of competition and robustness across individual mice and gene pools (supplemental Figures 7-11). We developed an algorithm to score genes based on both relative contribution to total human engraftment, as well as ability to compete against other gene-transduced cells (Figure 1B; supplemental Figure 9A; supplemental Table 5). As a first step, we opted to validate in xenotransplantation assays 3 genes that scored well only in the stem screen (PHGDH, BIVM, C3orf54), and an additional 3 that scored well in both screens (MMP28, SPINK2, CAV1). Unexpectedly, single-gene transduction of CB stem-enriched cells revealed delayed repopulation kinetics for 5 of the 6 candidate genes, evidenced by reduced levels of gene marking (percent BFP+ of human CD45+ cells) relative to input and control at 4 weeks posttransplantation that subsequently reached or exceeded control levels by 20 weeks (Figure 1C). These observations suggested that the screen was selecting for genes conferring transient resistance to activation at 4 weeks,17 and thereby prolonging latency.
Screen engraftment analysis according to CD45, BFP, and CD34 expression
| Parameter | Pools (number of mice) | Negative CTRL (number of mice) | Positive CTRL (number of mice) |
|---|---|---|---|
| Stem screen | |||
| Total BM | |||
| >1% CD45+ | 69/77 (90%) | 8/11 (72%) | 8/8 (100%) |
| >1% BFP (CD45+) | 68/69 (99%) | 5/8 (63%) | 5/8 (63%) |
| FC (output/input) >1 | 31/68 (FC: 0.1-5.2; 46%) | 1/5 (FC: 0.2-1.3; 20%) | 2/5 (FC: 0.2-8.9, 40%) |
| Analyzed by ddPCR | 44 (∼2/3) | ||
| CD34+ | |||
| FC[BFP+(CD34+)/BFP+(CD45+)] | |||
| No BFP+ in CD34+ | 7 | 1 | 1 |
| FC < 0.95 | 38 | 2 | 3 |
| 0.95 < FC > 1.05 | 6 | 0 | 1 |
| FC> 1.05 | 17 | 2 | 0 |
| Analyzed by ddPCR | 12 | ||
| Progenitor screen | |||
| Total BM | |||
| >0.1% CD45+ (maximum 20%) | 53/64 (83%) | 5/8 (63%) | |
| >1% BFP(CD45+); (maximum 43%) | 41/53 (77%) | 1/5 (20%) | |
| FC (output/input) > 1 | 2/41 (5%) | ||
| FC (output/input) > 0.4 | 15/41 (37%) | 0/2 | |
| Analyzed by ddPCR | 18 (∼2/5) |
C3orf54/INKA1 is a potential stem cell regulator
Our scoring algorithm was based on total BM composition, and thus predominantly reflected the progeny generated by long-term persisting cells. To identify genes more specifically involved in stem cell regulation, we examined the composition of the stem cell-enriched CD34+ compartment. CD34+BFP+ cells from 12 individual mice exhibiting high levels of total human (CD45+), BFP+, and CD34+ cell engraftment at 20 weeks were subjected to barcode composition analysis (supplemental Figure 12). In 2 mice receiving different pools containing vectors expressing C3orf54/INKA1/FAM212A (hereafter referred to as INKA1), the CD34+ compartment was almost exclusively composed of INKA1-transduced cells (75.7% and 97.8%; Figure 2A-D) that had outcompeted cells transduced with the higher-scoring genes PHGDH and BIVM. In contrast, the proportion of INKA1-transduced cells in the total BM of these mice was considerably lower (25.5% and 44.1%, respectively). Of note, in the CD34+ cell compartment, INKA1-transduced cells significantly outcompeted cells transduced with RUNX1 and DNMT3B (Figure 2A-B), known stem cell regulators,28,29 despite the latter being detected abundantly in the total BM of the respective mice. Interestingly, although cells transduced with INKA1 showed the strongest relative reduction in engraftment at 4 weeks in total BM, these cells showed the strongest relative increase by 20 weeks (fold change [FC], 2.06; Figure 1C), pointing to an initial resistance to activation without loss of stem cell regenerative capacity. Together, these observations of persistence and a strong competitive advantage within the CD34+ cell compartment at 20 weeks, combined with a low rank (33rd) in the progenitor screen, suggest that INKA1 exclusively regulates stem cells.
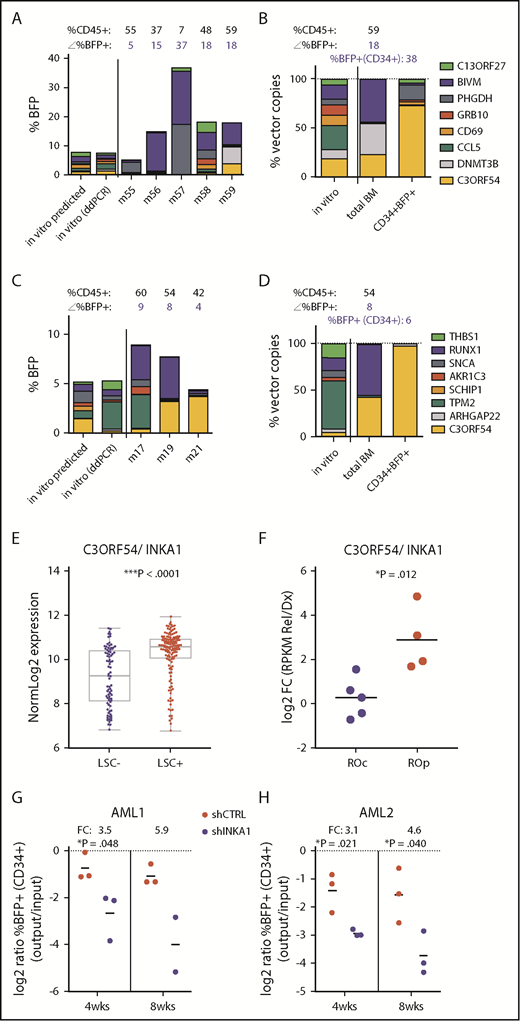
Stemness screen and AML data sets implicate C3orf54/INKA1 as LSC regulator. (A-B) Both plots represent the same pool from the stem screen, as indicated by the legend on the right. (A) From individual vector cultures predicted (inferred from %BFP+) and actual pool composition (ddPCR, day 6 in vitro) is shown according to total %BFP+ next to pool composition analysis from total BM per individual mouse (m). The corresponding percentage CD45+ and BFP+ is indicated above each bar (mouse). (B) Pool composition in CD34+BFP+ cells sorted from BM of m59 is shown in comparison with in vitro input and total BM pool composition as percent vector copies. (C-D) Same as panels A-B for the second pool containing the C3orf54 expressing vector. (D) BM CD34+BFP+ sorted fraction of m19 was subjected to ddPCR analysis. (E) C3orf54/INKA1 expression in 89 LSC− and 138 LSC+ fractions from 78 patients with AML (GSE30377, microArray, Mann-Whitney U test).3 (F) C3orf54/INKA1 expression (RNAseq), in paired diagnosis-relapse samples that are split into relapse origin committed-like (ROc) and primitive-like (ROp), as determined functionally or by clusters from perturbation deconvolution analysis, using gene expression data from normal hematopoietic cell subsets.9 Shown are the log2 ratios of expression levels at relapse vs diagnosis of each individual sample (Student t test). (G-H) CD34+ sorted cells from 2 primary AML samples (AML1, AML2) were transduced with shCTRL or INKA1-KD vectors (pooled shINKA1-1 and shINKA-2; supplemental Figure 14) and intrafemorally injected into NSG at a cell dose of 2.4 × 10⁵ and 4.4 × 10⁵/mouse, respectively. After 4 and 8 weeks, injected femurs were flushed and BM cells were analyzed for CD34 and BFP expression. The relative decline of percentage BFP+ cells within the CD34+ population (output) is plotted as the relative log2 ratio to %BFP+ at input (4 days posttransduction; supplemental Figure 14) with the FC of the means for shINKA1 vs shCTRL indicated above each point.
Stemness screen and AML data sets implicate C3orf54/INKA1 as LSC regulator. (A-B) Both plots represent the same pool from the stem screen, as indicated by the legend on the right. (A) From individual vector cultures predicted (inferred from %BFP+) and actual pool composition (ddPCR, day 6 in vitro) is shown according to total %BFP+ next to pool composition analysis from total BM per individual mouse (m). The corresponding percentage CD45+ and BFP+ is indicated above each bar (mouse). (B) Pool composition in CD34+BFP+ cells sorted from BM of m59 is shown in comparison with in vitro input and total BM pool composition as percent vector copies. (C-D) Same as panels A-B for the second pool containing the C3orf54 expressing vector. (D) BM CD34+BFP+ sorted fraction of m19 was subjected to ddPCR analysis. (E) C3orf54/INKA1 expression in 89 LSC− and 138 LSC+ fractions from 78 patients with AML (GSE30377, microArray, Mann-Whitney U test).3 (F) C3orf54/INKA1 expression (RNAseq), in paired diagnosis-relapse samples that are split into relapse origin committed-like (ROc) and primitive-like (ROp), as determined functionally or by clusters from perturbation deconvolution analysis, using gene expression data from normal hematopoietic cell subsets.9 Shown are the log2 ratios of expression levels at relapse vs diagnosis of each individual sample (Student t test). (G-H) CD34+ sorted cells from 2 primary AML samples (AML1, AML2) were transduced with shCTRL or INKA1-KD vectors (pooled shINKA1-1 and shINKA-2; supplemental Figure 14) and intrafemorally injected into NSG at a cell dose of 2.4 × 10⁵ and 4.4 × 10⁵/mouse, respectively. After 4 and 8 weeks, injected femurs were flushed and BM cells were analyzed for CD34 and BFP expression. The relative decline of percentage BFP+ cells within the CD34+ population (output) is plotted as the relative log2 ratio to %BFP+ at input (4 days posttransduction; supplemental Figure 14) with the FC of the means for shINKA1 vs shCTRL indicated above each point.
In samples from patients with AML, INKA1 is uniformly more highly expressed in LSC+ fractions compared with LSC− fractions (FC, 2.29; P < .0001; Figure 2E).3 Moreover, INKA1 is transcriptionally upregulated at relapse in those samples in which relapse is inferred to originate from primitive LSC clones present at diagnosis (Figure 2F).9 INKA1 is among the top transcripts positively correlating with LSC frequency (rank 8 of 48 genes upregulated in LSC+, Spearman’s rank correlation ρ = 0.454; ***P = 6.43 × 10⁻¹³; supplemental Tables 6 and 7), as estimated by limiting dilution analysis of LSC+ fractions in xenograft assays.3 Knock-down of INKA1 (INKA1-KD) in CD34+ cells from 2 primary AML samples (supplemental Table 8) resulted in reduced engraftment of INKA1-KD CD34+ (three- to sixfold) and CD45+ (two- to fivefold) AML cells on xenotransplantation at an early point (4 weeks), and also when total AML engraftment reached saturating levels (8 weeks, Figure 2G-H; supplemental Figure 14). These observations build on our findings in normal CB and further support a role for INKA1 as a key regulator of LSC stemness and persistence in AML.
INKA1 retains AML cells in a primitive state in vitro
To investigate the molecular mechanisms underlying INKA1 regulation of LSC properties, we used a primary human AML-derived culture system (8227) that maintains a functional and phenotypic hierarchy delineated by CD34 and CD38 expression (Figure 3A). In this model, cells with LSC activity reside in the CD34+CD38− fraction, with more committed clonogenic progeny in the CD34+CD38+ fraction and differentiated blasts in the CD34− fraction.10 Engraftment ability in xenograft assays is restricted to the CD34+ compartment and correlation of gene expression to the 104-gene LSC stemness signature3 decreases across the 8227 hierarchy (Figure 3B-C; supplemental Figure 15). Moreover, INKA1 expression also tends to decrease gradually across the 8227 hierarchy (Figure 3D). These observations support the functional relevance of this system as a model of human AML for mechanistic characterization of LSC biology, as we previously reported for the role of mir-126 in LSC quiescence control.10
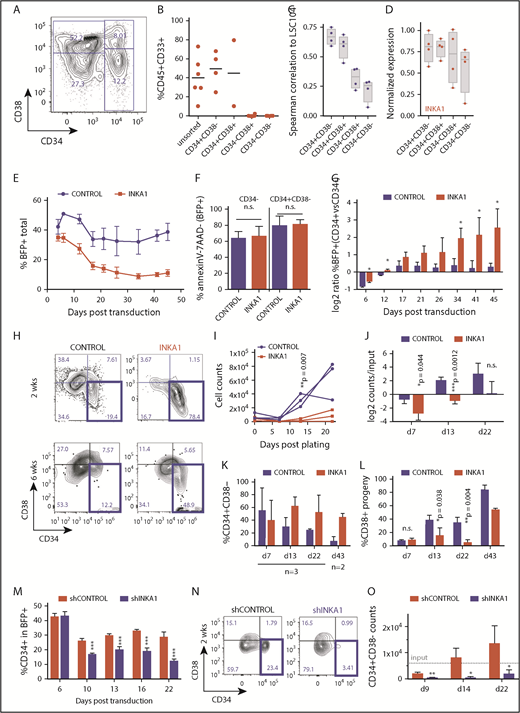
INKA1-OE in 8227 AML LSC model recapitulates relative enrichment of primitive cells while INKA1-KD reduces them. (A) Representative CD34/CD38 FACS plot of the phenotypic 8227 AML hierarchy. (B) Engraftment data of injected femurs at 12 weeks (human CD45+CD33+) of 8227 AML cells that had been sorted into 4 fractions according to CD34 and CD38 expression and transplanted into nonobese diabetic-severe combined immunodeficiency-SGM3 mice and analyzed after 12 weeks. Unsorted: 1.5 × 10⁶; CD34+ fractions: 0.3 × 10⁶, CD34− fractions: 0.5 × 10⁶ cells/mouse. (C) Spearman’s correlation ρ values generated from gene expression data (NanoString, n = 4) from the four 8227 AML fractions of 104 genes that are differentially regulated in LSC+ vs LSC− with their expression in the LSC104 data set. (D) INKA1 expression across 8227 AML hierarchy, according to NanoString analysis (n = 4). (E) CD34+CD38− 8227 AML cells were transduced with CTRL and INKA1-OE vectors, and %BFP+ was assessed over the course of 43 days (n = 3). (F) Cell viability of BFP+ CD34− and CD34+CD38− was analyzed according to AnnexinV− and 7AAD− staining. (G) Relative gene-marking (BFP+) in CD34+ and CD34− fractions was assessed over time (n = 3). (H) Sorted CD34+CD38−BFP+ cells were cultured to assess the capability to regrow the hierarchy. Shown are representative FACS plots at 2 weeks (n = 3) and 6 weeks (n = 2) after sorting. Absolute (I) and relative (J) cell counts are shown over 3 weeks of follow-up and CD34+CD38− maintenance (K), and differentiation to CD38+ (L) cells was monitored over the course of 6 weeks. (M) Long-term in vitro follow-up of %CD34+ cells within BFP+ population upon INKA1-KD (shINKA1) vs control (shCTRL, n = 4). (N) Sorted CD34+CD38−BFP+ cells (shCTRL, shINKA1) were cultured to assess the capability to regrow the hierarchy. Shown are representative FACS plots at 2 weeks (n = 3) after sorting and absolute cell counts of CD34+CD38− cells are shown over the course of 3 weeks follow-up in panel O. Student t test *P < .05; **P < .01; ***P < .001; n.s., nonsignificant.
INKA1-OE in 8227 AML LSC model recapitulates relative enrichment of primitive cells while INKA1-KD reduces them. (A) Representative CD34/CD38 FACS plot of the phenotypic 8227 AML hierarchy. (B) Engraftment data of injected femurs at 12 weeks (human CD45+CD33+) of 8227 AML cells that had been sorted into 4 fractions according to CD34 and CD38 expression and transplanted into nonobese diabetic-severe combined immunodeficiency-SGM3 mice and analyzed after 12 weeks. Unsorted: 1.5 × 10⁶; CD34+ fractions: 0.3 × 10⁶, CD34− fractions: 0.5 × 10⁶ cells/mouse. (C) Spearman’s correlation ρ values generated from gene expression data (NanoString, n = 4) from the four 8227 AML fractions of 104 genes that are differentially regulated in LSC+ vs LSC− with their expression in the LSC104 data set. (D) INKA1 expression across 8227 AML hierarchy, according to NanoString analysis (n = 4). (E) CD34+CD38− 8227 AML cells were transduced with CTRL and INKA1-OE vectors, and %BFP+ was assessed over the course of 43 days (n = 3). (F) Cell viability of BFP+ CD34− and CD34+CD38− was analyzed according to AnnexinV− and 7AAD− staining. (G) Relative gene-marking (BFP+) in CD34+ and CD34− fractions was assessed over time (n = 3). (H) Sorted CD34+CD38−BFP+ cells were cultured to assess the capability to regrow the hierarchy. Shown are representative FACS plots at 2 weeks (n = 3) and 6 weeks (n = 2) after sorting. Absolute (I) and relative (J) cell counts are shown over 3 weeks of follow-up and CD34+CD38− maintenance (K), and differentiation to CD38+ (L) cells was monitored over the course of 6 weeks. (M) Long-term in vitro follow-up of %CD34+ cells within BFP+ population upon INKA1-KD (shINKA1) vs control (shCTRL, n = 4). (N) Sorted CD34+CD38−BFP+ cells (shCTRL, shINKA1) were cultured to assess the capability to regrow the hierarchy. Shown are representative FACS plots at 2 weeks (n = 3) after sorting and absolute cell counts of CD34+CD38− cells are shown over the course of 3 weeks follow-up in panel O. Student t test *P < .05; **P < .01; ***P < .001; n.s., nonsignificant.
INKA1-overexpression (OE) in sorted CD34+CD38− 8227 cells followed by in vitro culture resulted in a progressive decline in gene-marked (BFP+) cells in the bulk population, but not within the CD34+ compartment, without evidence of increased apoptosis (Figure 3E-F; supplemental Figure 16A). This led to a steady increase in the ratio of %BFP+ cells within the CD34+ vs CD34− compartment over time (Figure 3G). Within the BFP+ fraction, the proportion of CD34+ cells progressively increased (1.2- to 4-fold) during long-term culture (supplemental Figure 16B). These observations suggest that INKA1-OE reduces the CD34− cell output generated by CD34+ cells. The number of sorted INKA1-OE CD34+CD38−BFP+ cells showed minimal increase with essentially stable retention of the CD34+CD38− primitive phenotype over the course of 22 days of culture, whereas control-transduced cells expanded approximately 10-fold (Figure 3H-K; supplemental Figure 16E-F). In addition, proportional output of CD38+ cells was reduced by 4-fold in INKA1-OE cells compared with controls, pointing to a reduction in output of differentiated cells (Figure 3L). In contrast, INKA1-KD resulted in a reduction of %CD34+ within the transduced (BFP+) cell population; sorted CD34+CD38−BFP+ cells did not expand and lost their primitive phenotype, producing differentiated progeny instead (Figure 3M-O; supplemental Figure 16G-J).
Cell cycle analysis demonstrated a 3.7-fold higher proportion of CD34+CD38−BFP+INKA1-OE cells in G0 compared with controls, with an equivalent proportion of cells undergoing S/G2/M transition remaining in the 2 conditions (Figure 4A-B). Of note, sorted INKA1-OE CD34+CD38+BFP+ cells showed no cell cycle differences compared with control. INKA1-OE cells showed increased label retention and reduced BrdU incorporation (76% of CTRL; *P = .044; Figure 4C-D). In contrast, INKA1-KD caused a relative 21% reduction of CD34+CD38−BFP+ cells in G0 (Figure 4A; supplemental Figure 17). The cell cycle alterations observed upon INKA1-OE, together with the production of fewer differentiated progeny, may reflect induction of a prolonged latency by INKA1 that restrains AML cells in a primitive state, albeit one, in which cell cycle progression and differentiation are not completely blocked.
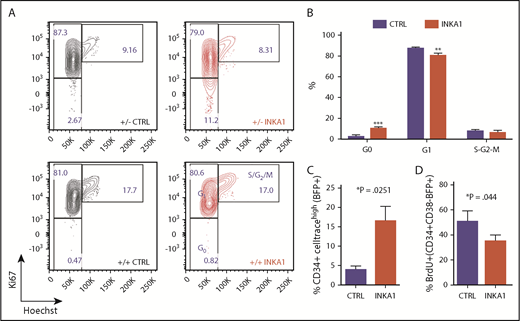
INKA1-OE induces quiescence in primitive 8227 AML cells. (A) Shown are sorted 8227 AML BFP+CD34+CD38− (+/−) and BFP+CD34+CD38+BFP+(+/+) that were stained for intracellular Ki67 expression and DNA content (Hoechst) staining. (B) Cell cycle distribution of transduced CD34+CD38−BFP+ cells (n = 3). (C) Transduced 8227 AML cells were labeled with CellTrace Far Red and analyzed 5 days later by flow cytometry (n = 3). (D) Transduced cells were incubated with BrdU and harvested after 20 hours for intracellular detection of BrdU incorporation (n = 3). Student t test *P < .05; **P < .01; ***P < .001.
INKA1-OE induces quiescence in primitive 8227 AML cells. (A) Shown are sorted 8227 AML BFP+CD34+CD38− (+/−) and BFP+CD34+CD38+BFP+(+/+) that were stained for intracellular Ki67 expression and DNA content (Hoechst) staining. (B) Cell cycle distribution of transduced CD34+CD38−BFP+ cells (n = 3). (C) Transduced 8227 AML cells were labeled with CellTrace Far Red and analyzed 5 days later by flow cytometry (n = 3). (D) Transduced cells were incubated with BrdU and harvested after 20 hours for intracellular detection of BrdU incorporation (n = 3). Student t test *P < .05; **P < .01; ***P < .001.
INKA1-OE inhibits nuclear localization of PAK4 and reduces global levels of H4K16ac
The few reported studies of INKA1 across species and tissues30-33 suggest potential novel connections between INKA1 and stemness. INKA1 has been characterized as an inhibitor of p21 protein (Cdc42/Rac)-activated kinase 4 (PAK4), although no functional role for PAK4 in hematopoiesis has been described.30,31,34 However, inhibition of the upstream regulator of PAK4, ρ-GTPase Cdc42, has been shown to rejuvenate aged murine HSC by altering H4K16 acetylation (H4K16ac) levels and polarity, and Cdc42 has recently been described to regulate AML cell polarity and division symmetry.35-37 Hence, as a first step to determine the mechanism underlying the observed effects of INKA1-OE in 8227 cells, we examined PAK4 and global H4K16ac levels and localization across the 8227 hierarchy. PAK4 was mainly cytoplasmic in both control and INKA1-OE CD34+CD38− cells, but INKA1-OE CD34+CD38+ cells exhibited less PAK4 nuclear localization compared with controls (Figure 5A-B). Low global PAK4 levels correlated with low H4K16ac levels, and nuclear PAK4 expression overlapped with high H4K16ac levels (supplemental Figure 18). INKA1-OE increased the proportion of cells in G0 exhibiting low levels of H4K16ac as assessed by flow cytometry (Figure 5C). Immunofluorescence analysis of CD34+CD38− cells showed a similar reduction in H4K16ac levels. Although variability of localized intranuclear accumulation in some cells may have blunted statistical significance, this data are in line with previous studies reporting polar distribution of H4K16ac (supplemental Figure 19B-C; Figure 5B).35,38 As CDK6 protein level distinguishes quiescence exit kinetics in human short-term and long-term (LT) HSCs,17 we examined CDK6 levels in 8227 cells. CDK6 levels were low in the primitive CD34+ cell fractions, higher in CD34−CD38+ cells, and virtually absent in terminally differentiated CD34−CD38− cells (supplemental Figure 20A-B), following a pattern of expression similar to what we previously reported for the normal hematopoietic hierarchy.17
![Figure 5. INKA1-OE alters PAK4 localization and shifts CD34+ CD38−cells into a quiescence cluster. Transduced 8227 AML cells (n = 3) were sorted into 4 BFP+ fractions according to CD34/CD38 expression, fixated on slides, and subjected to confocal imaging of PAK4, CDK6, H4K16ac, and 4′,6-diamidino-2-phenylindole (DAPI). Images were processed by ImageJ/Fijji, generating a combined .csv file comprised of multiple parameter measurements per cell and stain (total cell, nuclear, and nonnuclear Integrated Density [IntDen], percent nuclear area, 403 cells). The resulting file was imported as .fcs file into FlowJo10. (A) Shown are the 2 CD34+ fractions per condition, combined with nuclear PAK4 levels (IntDen) plotted against nonnuclear PAK4 levels. (B) Example images of CTRL and INKA1-OE CD34+CD38− and CD34+CD38+ cells captured by a Zeiss LSM700 Confocal (oil, 63×/1.4 NA, inverted, Zen 2012 software). Downstream analysis was performed with ImageJ/Fiji. Bars in merge image represent 2 μm. (C) Transduced 8227 AML cells were subjected to CD34 surface staining before intracellular staining for H4K16ac and Ki67 (n = 4-5). Student t test *P < .05. (D) The FlowJo10 TSne plugin was used for multidimensional reduction of the entire immunofluorescence data set (2 conditions with each 4 populations, 12 input parameters: total, nuclear, and cytoplasmic IntDen for CDK6 and PAK4, nuclear IntDen for H4K16ac and 4′,6-diamidino-2-phenylindole, percent nuclear area for all 4 stains; perplexity: 20, iterations: 1000, η: 200, Θ: 0.5). The resulting t-SNE plot revealed 2 major clusters (Cluster1, Cluster2). (E) Comparative visualization of Cluster1 (gray) and Cluster2 (violet) for nuclear (nucl) PAK4, CDK6, and H4K16ac protein expression levels (IntDen). (F) The same t-SNE x and y parameters were used to plot CTRL and INKA1 transduced cells individually. Split in 2 panels, the same data are shown as in panel D, with the individual 8227 subpopulations highlighted in different colors: CD34+CD38−(red), CD34+CD38+(orange); CD34−CD38+(green); CD34−CD38−(blue). (G) Cluster1 and Cluster2 gates were separately applied to the 2 CD34+ populations of CTRL and INKA1 to estimate their relative abundance in these clusters. (H-J) Analog analysis was performed with shCTRL and shINKA1 transduced and CD34+CD38− sorted cells (n = 3). (H) Example images of CTRL and INKA1-KD CD34+CD38− cells. (I) Shown are nuclear PAK4 levels (IntDen) plotted against nonnuclear PAK4 levels for all replicates. (J) Protein expression levels (IntDen) of CDK6, PAK4, and H4K16ac upon INKA1-KD (immunostaining). Student t test. *P < .05; ***P < .001.](https://ash.silverchair-cdn.com/ash/content_public/journal/blood/133/20/10.1182_blood-2018-10-881441/3/m_blood881441f5.png?Expires=1763472937&Signature=cY8PxJ6GbV97Le0BPT1nPWsudx4ksncSCx8kJPcjETmb4npiZu1u0FYzzljXyCYGhnW23MDIZLkyHXuHoKf-XeqcH6WmxAxouttvet54Kb4JN86QgM8Z9j7zsXPlSsxDwImEltx-AGuP3A3vTCEnR8LjbgHGLNlxELGdzQn9ZvPQmz7vUJ0YXH6XYdVwIv4v4hfroHehTrTwZtXlmu9eyJOhlIMBFAwWtMdvdIZmeWKTGkZX7J8QVopQRH2XEv45bZjRGDGWFZ71KOjB77cLNCKPc7GbHhEQj4Mn51Rdmw65iin-ykNIhlVNfeVh~C4~nLDWWr~FmcqXfHhd7Un4sA__&Key-Pair-Id=APKAIE5G5CRDK6RD3PGA)
INKA1-OE alters PAK4 localization and shifts CD34+ CD38−cells into a quiescence cluster. Transduced 8227 AML cells (n = 3) were sorted into 4 BFP+ fractions according to CD34/CD38 expression, fixated on slides, and subjected to confocal imaging of PAK4, CDK6, H4K16ac, and 4′,6-diamidino-2-phenylindole (DAPI). Images were processed by ImageJ/Fijji, generating a combined .csv file comprised of multiple parameter measurements per cell and stain (total cell, nuclear, and nonnuclear Integrated Density [IntDen], percent nuclear area, 403 cells). The resulting file was imported as .fcs file into FlowJo10. (A) Shown are the 2 CD34+ fractions per condition, combined with nuclear PAK4 levels (IntDen) plotted against nonnuclear PAK4 levels. (B) Example images of CTRL and INKA1-OE CD34+CD38− and CD34+CD38+ cells captured by a Zeiss LSM700 Confocal (oil, 63×/1.4 NA, inverted, Zen 2012 software). Downstream analysis was performed with ImageJ/Fiji. Bars in merge image represent 2 μm. (C) Transduced 8227 AML cells were subjected to CD34 surface staining before intracellular staining for H4K16ac and Ki67 (n = 4-5). Student t test *P < .05. (D) The FlowJo10 TSne plugin was used for multidimensional reduction of the entire immunofluorescence data set (2 conditions with each 4 populations, 12 input parameters: total, nuclear, and cytoplasmic IntDen for CDK6 and PAK4, nuclear IntDen for H4K16ac and 4′,6-diamidino-2-phenylindole, percent nuclear area for all 4 stains; perplexity: 20, iterations: 1000, η: 200, Θ: 0.5). The resulting t-SNE plot revealed 2 major clusters (Cluster1, Cluster2). (E) Comparative visualization of Cluster1 (gray) and Cluster2 (violet) for nuclear (nucl) PAK4, CDK6, and H4K16ac protein expression levels (IntDen). (F) The same t-SNE x and y parameters were used to plot CTRL and INKA1 transduced cells individually. Split in 2 panels, the same data are shown as in panel D, with the individual 8227 subpopulations highlighted in different colors: CD34+CD38−(red), CD34+CD38+(orange); CD34−CD38+(green); CD34−CD38−(blue). (G) Cluster1 and Cluster2 gates were separately applied to the 2 CD34+ populations of CTRL and INKA1 to estimate their relative abundance in these clusters. (H-J) Analog analysis was performed with shCTRL and shINKA1 transduced and CD34+CD38− sorted cells (n = 3). (H) Example images of CTRL and INKA1-KD CD34+CD38− cells. (I) Shown are nuclear PAK4 levels (IntDen) plotted against nonnuclear PAK4 levels for all replicates. (J) Protein expression levels (IntDen) of CDK6, PAK4, and H4K16ac upon INKA1-KD (immunostaining). Student t test. *P < .05; ***P < .001.
INKA1-OE alters PAK4 localization and shifts CD34+ CD38−cells into a quiescence cluster. Transduced 8227 AML cells (n = 3) were sorted into 4 BFP+ fractions according to CD34/CD38 expression, fixated on slides, and subjected to confocal imaging of PAK4, CDK6, H4K16ac, and 4′,6-diamidino-2-phenylindole (DAPI). Images were processed by ImageJ/Fijji, generating a combined .csv file comprised of multiple parameter measurements per cell and stain (total cell, nuclear, and nonnuclear Integrated Density [IntDen], percent nuclear area, 403 cells). The resulting file was imported as .fcs file into FlowJo10. (A) Shown are the 2 CD34+ fractions per condition, combined with nuclear PAK4 levels (IntDen) plotted against nonnuclear PAK4 levels. (B) Example images of CTRL and INKA1-OE CD34+CD38− and CD34+CD38+ cells captured by a Zeiss LSM700 Confocal (oil, 63×/1.4 NA, inverted, Zen 2012 software). Downstream analysis was performed with ImageJ/Fiji. Bars in merge image represent 2 μm. (C) Transduced 8227 AML cells were subjected to CD34 surface staining before intracellular staining for H4K16ac and Ki67 (n = 4-5). Student t test *P < .05. (D) The FlowJo10 TSne plugin was used for multidimensional reduction of the entire immunofluorescence data set (2 conditions with each 4 populations, 12 input parameters: total, nuclear, and cytoplasmic IntDen for CDK6 and PAK4, nuclear IntDen for H4K16ac and 4′,6-diamidino-2-phenylindole, percent nuclear area for all 4 stains; perplexity: 20, iterations: 1000, η: 200, Θ: 0.5). The resulting t-SNE plot revealed 2 major clusters (Cluster1, Cluster2). (E) Comparative visualization of Cluster1 (gray) and Cluster2 (violet) for nuclear (nucl) PAK4, CDK6, and H4K16ac protein expression levels (IntDen). (F) The same t-SNE x and y parameters were used to plot CTRL and INKA1 transduced cells individually. Split in 2 panels, the same data are shown as in panel D, with the individual 8227 subpopulations highlighted in different colors: CD34+CD38−(red), CD34+CD38+(orange); CD34−CD38+(green); CD34−CD38−(blue). (G) Cluster1 and Cluster2 gates were separately applied to the 2 CD34+ populations of CTRL and INKA1 to estimate their relative abundance in these clusters. (H-J) Analog analysis was performed with shCTRL and shINKA1 transduced and CD34+CD38− sorted cells (n = 3). (H) Example images of CTRL and INKA1-KD CD34+CD38− cells. (I) Shown are nuclear PAK4 levels (IntDen) plotted against nonnuclear PAK4 levels for all replicates. (J) Protein expression levels (IntDen) of CDK6, PAK4, and H4K16ac upon INKA1-KD (immunostaining). Student t test. *P < .05; ***P < .001.
To quantify the coordinate changes in intensity and cellular localization for all 3 proteins analyzed by immunofluorescence (PAK4, H4K16ac, CDK6) we used a multidimensional reduction approach combining both overexpression conditions (control and INKA1) and all 4 8227 subpopulations (t-SNE; n = 3; 403 cells; Figure 5D). We identified 2 major clusters (Cluster1, Cluster2; Figure 5D) where Cluster1 was enriched for cells with lower levels of nuclear PAK4, CDK6, and H4K16ac relative to cells in Cluster2 (Figure 5E). This analysis suggests that Cluster1 is associated with primitiveness/reduced activation. Highlighting the 4 CD34/CD38 cell fractions of control and INKA1-OE cells separately in the t-SNE plot revealed that the majority of INKA1-OE CD34+CD38− cells are in Cluster1, whereas few are found in Cluster2. In contrast, only 25% of control CD34+CD38− cells overlapped with Cluster1 (P = .048), and the majority localized to Cluster2 (Figure 5F-G). Of note, the control and INKA1-OE conditions could be distinguished simply on basis of distribution of CD34+ cells in these 2 clusters; there were no striking differences in the distribution of the 2 CD34− fractions (Figure 5F; supplemental Figure 20B-C).
To determine whether PAK4 directly interacts with endogenous and exogenous INKA1 in transduced 8227 AML cells, we undertook 2 approaches: colocalization analysis applying Pixel Intensity Spatial Correlation Analysis (median Spearman’s rank correlation value = 0.76) and proximity ligation assay (supplemental Figure 21A,E,G). Both approaches revealed direct interaction. This analysis also revealed that INKA1-OE reduced not only PAK4 protein and transcript levels but also INKA1 protein levels, despite elevated transcript levels (supplemental Figures 16C-D and 21A-F). Thus, the ratio of INKA1 to PAK4 expression was increased by INKA1-OE implying PAK4 target saturation. The relative INKA1 abundance manifested as reduced colocalization scores (supplemental Figure 21D-E). Inhibition of PAK4 activity on INKA1-OE in CD34+CD38− 8227 cells was further confirmed by reduced nuclear phosphorylation of Ser675 of β-catenin, a known PAK4 substrate (supplemental Figure20D-E).39 In contrast to the INKA1-OE mediated reduction of PAK4 transcript and protein expression, INKA1-KD caused a 1.4-fold upregulation of PAK4 protein levels (Figure 5H-J).40 As PAK4 has also been implicated in a positive feedback loop stimulating its own expression, these data suggest that INKA1-OE alters PAK4 expression via PAK4 inhibition, whereas INKA1-KD alleviates PAK4 inhibition, allowing it to stimulate its own expression.40 Silencing of endogenous INKA1 in 8227 CD34+CD38− cells also resulted in 2.3-fold elevation of CDK6 protein levels compared with shCTRL, enhancement of PAK4 nuclear transition, and 2.0-fold increase in acetylation of H4K16 (Figure 5H-J). Although further study will be required to define these interactions in detail, our data support the concept that nuclear localization of PAK4 is linked to the H4K16ac chromatin mark, and both are involved in regulating G0 exit; INKA1-OE interferes with G0 exit via PAK4 inhibition.
INKA1-OE induces label retention and prolongs LSC latency in vivo
To determine whether INKA1-OE regulates LSC function in vivo, we examined the engraftment potential of transduced 8227 AML cells after expansion in vitro and labeling with CellTrace, which allows detection of rare nondividing or slowly dividing cells. At 4 weeks, total CD45+ engraftment and percent BFP+ cells relative to percent BFP+(CD34+) input was reduced for INKA1-OE cells compared with controls (Figure 6A-B). Similar to our in vitro observations, INKA1-OE tended to enrich for CD34+CD38− cells in the graft (Figure 6C-D). A small (2% of BFP+; n = 3) but significant population of CellTrace label-retaining cells could be detected in INKA1-OE grafts (Figure 6E-F), consistent with the presence of cells with a history of no or few cell divisions after transplantation.
![Figure 6. INKA1-OE induces label retention and prolonged LSC latency in vivo. Transduced CD34+CD38− 8227 AML cells were expanded for 2 (EXP1), 6 (EXP3), or 9 weeks (EXP2); labeled with CellTrace Far Red; and transplanted into NSG mice (106 cells/mouse, EXP1: n = 2; EXP2: n = 4-5; EXP3: n = 13-15 for 3 analysis time points: 4, 8, and 12 weeks). (A) Human CD45+ cell engraftment at 4 weeks. (B) BFP+(CD45+) engraftment relative to %BFP+(CD34+) input at 4 weeks shown as mean per experiment. (C-F) Freshly isolated BM from individual mice was pooled per group and experiment, mouse cell depleted and analyzed for CD34/CD38 expression and label retention (CellTrace). (D) The relative abundance of CD34+CD38− cells in CTRL/INKA1 transduced cells (BFP+) vs BFP− cells within the same pools was assessed. (E-F) CellTrace label retention in BFP+ cells. Student t test. (G) CD45+ engraftment for EXP3: 3 time points for primary transplants (4, 8, 12 weeks) and 2 secondary transplantation experiments from 8 and 12 weeks CD45+BFP+ pooled and sorted primary grafts (additional 8 weeks: 8 weeks + 8 weeks, 20 000 cells/mouse; 12w+8w, 100 000 cells/mouse) were analyzed. (H) Longitudinal analysis of percent CD34+ in BFP+ fraction. Secondary transplants are connected to the point of their primary transplantation origin by a dotted line. Student t test with Welch’s correction. (I) Cell cycle analysis from mouse cell depleted and CD45+BFP+ sorted cells from 8 and 12 weeks primary transplantation. (J) BFP+ percentage within CD45+ population for each individual mouse and time is shown next to input (%BFP+[CD34+]). (K) H4K16ac staining from mouse cell depleted and CD45+BFP+ sorted cells from 8 and 12 weeks primary transplantation. (L) Shown is the CD34+/CD15+ composition of the CD45+BFP+ graft of individual mice after secondary transplantation (12 weeks + 8 weeks). *P < .05.](https://ash.silverchair-cdn.com/ash/content_public/journal/blood/133/20/10.1182_blood-2018-10-881441/3/m_blood881441f6.png?Expires=1763472937&Signature=TAPCqO8xW8fvtdwg45hIyGwC9x3DU3X9LjYzwU1hwu5sSv-Cn1m-GC68wk7DdJe1xv-dQr9QkGdiQU5RI15XO3Drt8mlOi3nEjo0EzBni9oe8nkITMEYV3cJ9V4bPU0gkd6Cd9nOHi4dIFYAh6dcwVEfrG5pBmaHAixP7FEjZiHWO-B7bYkBryTSMdPDUp--Vh8sx0m-yk7O68NzYFtihRLpS74pYHyBtzHyL6MFcgXVPYqb47E6O8tASPbwIgyPLo2YitrR6utRUfvvXiwKHTiJ-BOoslHBrtoTnGPnPQTLI2sccZ0p86b3nHbAMlzUxDZ9ki3LaYNSH0uHaMnUig__&Key-Pair-Id=APKAIE5G5CRDK6RD3PGA)
INKA1-OE induces label retention and prolonged LSC latency in vivo. Transduced CD34+CD38− 8227 AML cells were expanded for 2 (EXP1), 6 (EXP3), or 9 weeks (EXP2); labeled with CellTrace Far Red; and transplanted into NSG mice (106 cells/mouse, EXP1: n = 2; EXP2: n = 4-5; EXP3: n = 13-15 for 3 analysis time points: 4, 8, and 12 weeks). (A) Human CD45+ cell engraftment at 4 weeks. (B) BFP+(CD45+) engraftment relative to %BFP+(CD34+) input at 4 weeks shown as mean per experiment. (C-F) Freshly isolated BM from individual mice was pooled per group and experiment, mouse cell depleted and analyzed for CD34/CD38 expression and label retention (CellTrace). (D) The relative abundance of CD34+CD38− cells in CTRL/INKA1 transduced cells (BFP+) vs BFP− cells within the same pools was assessed. (E-F) CellTrace label retention in BFP+ cells. Student t test. (G) CD45+ engraftment for EXP3: 3 time points for primary transplants (4, 8, 12 weeks) and 2 secondary transplantation experiments from 8 and 12 weeks CD45+BFP+ pooled and sorted primary grafts (additional 8 weeks: 8 weeks + 8 weeks, 20 000 cells/mouse; 12w+8w, 100 000 cells/mouse) were analyzed. (H) Longitudinal analysis of percent CD34+ in BFP+ fraction. Secondary transplants are connected to the point of their primary transplantation origin by a dotted line. Student t test with Welch’s correction. (I) Cell cycle analysis from mouse cell depleted and CD45+BFP+ sorted cells from 8 and 12 weeks primary transplantation. (J) BFP+ percentage within CD45+ population for each individual mouse and time is shown next to input (%BFP+[CD34+]). (K) H4K16ac staining from mouse cell depleted and CD45+BFP+ sorted cells from 8 and 12 weeks primary transplantation. (L) Shown is the CD34+/CD15+ composition of the CD45+BFP+ graft of individual mice after secondary transplantation (12 weeks + 8 weeks). *P < .05.
INKA1-OE induces label retention and prolonged LSC latency in vivo. Transduced CD34+CD38− 8227 AML cells were expanded for 2 (EXP1), 6 (EXP3), or 9 weeks (EXP2); labeled with CellTrace Far Red; and transplanted into NSG mice (106 cells/mouse, EXP1: n = 2; EXP2: n = 4-5; EXP3: n = 13-15 for 3 analysis time points: 4, 8, and 12 weeks). (A) Human CD45+ cell engraftment at 4 weeks. (B) BFP+(CD45+) engraftment relative to %BFP+(CD34+) input at 4 weeks shown as mean per experiment. (C-F) Freshly isolated BM from individual mice was pooled per group and experiment, mouse cell depleted and analyzed for CD34/CD38 expression and label retention (CellTrace). (D) The relative abundance of CD34+CD38− cells in CTRL/INKA1 transduced cells (BFP+) vs BFP− cells within the same pools was assessed. (E-F) CellTrace label retention in BFP+ cells. Student t test. (G) CD45+ engraftment for EXP3: 3 time points for primary transplants (4, 8, 12 weeks) and 2 secondary transplantation experiments from 8 and 12 weeks CD45+BFP+ pooled and sorted primary grafts (additional 8 weeks: 8 weeks + 8 weeks, 20 000 cells/mouse; 12w+8w, 100 000 cells/mouse) were analyzed. (H) Longitudinal analysis of percent CD34+ in BFP+ fraction. Secondary transplants are connected to the point of their primary transplantation origin by a dotted line. Student t test with Welch’s correction. (I) Cell cycle analysis from mouse cell depleted and CD45+BFP+ sorted cells from 8 and 12 weeks primary transplantation. (J) BFP+ percentage within CD45+ population for each individual mouse and time is shown next to input (%BFP+[CD34+]). (K) H4K16ac staining from mouse cell depleted and CD45+BFP+ sorted cells from 8 and 12 weeks primary transplantation. (L) Shown is the CD34+/CD15+ composition of the CD45+BFP+ graft of individual mice after secondary transplantation (12 weeks + 8 weeks). *P < .05.
At 8 weeks posttransplant, engraftment levels increased in control mice but remained low in INKA1-OE mice (Figure 6G). Cell cycle analysis revealed that despite a considerable increase of percent CD34+ cells in INKA1-OE grafts (Figure 6H), 35% of INKA1-OE CD34+ cells remained in G0 compared with 1% of control CD34+ cells (Figure 6I). By 12 weeks posttransplant, engraftment levels in control and INKA1-OE mice were comparable (mean, 40.1% vs 37.1% CD45+), reflecting a fourfold vs 19-fold expansion, respectively, between weeks 8 and 12. Because the level of percent BFP+ cells remained constant during this time in INKA1-OE grafts (Figure 6J), this expansion can be equally attributed to BFP+ and BFP− cells. The expansion in the total graft was accompanied by a reduction of the percentage of primitive cells (percent CD34+ in BFP+) to the same level as controls by week 12 (Figure 6H). Cell cycle analysis at this point demonstrated that cells in both groups were actively cycling (Figure 6I). Similar to our in vitro observations, INKA1-OE reduced H4K16ac levels in vivo at 8 weeks; however, they were restored to control levels by 12 weeks (Figure 6K). Thus, INKA1 induces a quiescence program that prolongs LSC latency in vivo, which manifests as initially delayed repopulation kinetics followed by an accelerated output of progeny within a narrow time frame.
To determine whether INKA1-OE resulted in loss of LSC activity, we serially transplanted CD45+BFP+ cells from 8227 xenografts harvested at 8- and 12-week points into secondary NSG-SGM3 recipients for an additional 8 weeks.26 Overall CD45+ engraftment was reduced in INKA1-OE grafts compared with controls, but there was greater retention of CD34+ cells, as predicted from our in vitro and primary 8227 xenograft data (Figure 6G-H,L; supplemental Figure 22). This result is notable because the NSG-SGM3 mouse model provides a highly permissive human cytokine environment that stimulates extensive proliferation and differentiation.26 INKA1-OE cells retained not only the primitive CD34+ phenotype but also the potential to generate differentiated output, as evidenced by the presence of CD15+ cells in all secondary grafts (Figure 6L). These data indicate that cells with bona fide LSC activity, but biased toward self-renewal rather than differentiation, were propagated from primary mice.
Discussion
Here, in a competitive in vivo gain-of-function screen for stemness genes, we have identified INKA1 as a novel regulator of G0 exit and stem cell latency in AML. The success of our screen to identify this stemness regulator hinged on several factors: the careful selection of candidates from LSC-specific gene lists where LSC populations had been functionally validated, a focus on how well the CD34+ stem cell compartment was regenerated, and longitudinal evaluation of engraftment kinetics in xenotransplant recipients at both early and later points in CB validation studies. Numerous studies in human xenografts and mice have shown that transplantation places replicative pressures on stem cells that typically lead either to their exhaustion41 or to incomplete reconstitution of the stem cell compartment.17,41-45 Thus, xenograft assays provide an excellent selection environment in which regulators that attenuate these natural losses can be identified. Although we were screening for regulators of LSC stemness and validated our findings in an AML model, we chose to use CB for our initial repopulation assays to avoid the potentially confounding variability in engraftment kinetics related to the inherent genetic and functional heterogeneity of AML samples. Considerable data exist that LSC and HSC share gene expression programs and many functional properties, including quiescence and self-renewal, and several known hematopoietic regulators function in both normal and leukemic stem cells.2,17,18 Accordingly, the biological effects of INKA1-OE in CB were recapitulated in the 8227 AML model system in vitro and in vivo, although more studies will be required to determine whether INKA1 functions via the same mechanisms in CB and AML. In contrast to the rapid activation usually seen posttransplantation, INKA1-OE retained LSC in a primitive state characterized by a lowered cell cycle rate and reduced output of differentiated progeny at early points. However, this latency state was transient and was followed by uniform expansion of LSCs at later points that were capable of serial repopulation. Our studies have not explored the mechanisms underlying the transience of the latency state. We speculate that intrinsic trigger signals accumulate within the latent LSC, eventually activating cell cycling without leading to exhaustion, although we cannot exclude that cycling may be triggered by extrinsic or microenvironmental signals. The link between latency induced by INKA1 and eventual expansion/persistence of self-renewing LSC points to the importance of stem cell kinetics itself, rather than fate determination, as a mediator of LSC pool size. This concept is also supported by our prior finding that LT-HSC have delayed G0 exit kinetics compared with short-term-HSC because of low CDK6 levels.17 The consequence of this delay during transplantation or under homeostatic conditions limits cell divisions of LT-HSC, thereby preserving the LT-HSC pool size and preventing stem cell exhaustion. Overall, our study highlights latency as a stem cell property that balances the competing processes of maintenance and exhaustion within the LSC compartment. There is also evidence of the importance of stem cell latency in other settings.14-17,46,47 For example, HSC latency is apparent after autologous transplantation in humans undergoing gene therapy.46 Moreover, variability in xenograft repopulation kinetics has been observed for cancer stem cells from other tumor types,48 suggesting that regulation of latency may be a property of stem cells beyond the hematopoietic system. It will be important to explore whether regulation of latency in these settings involves the INKA1-PAK4 axis or another mechanism.
The only reported link between INKA1 and human disease has been elevated transcript levels in patients with immune thrombocytopenia.49 To our knowledge, no INKA1 mutations have been reported in AML. However, the data we report here, including its uniformly high expression in LSCs, correlation of expression levels with LSC frequency, upregulated expression in AML relapse samples that originate from LSCs with a primitive phenotype,9 and increased stemness upon overexpression and loss of stemness upon knock-down, all support a role for INKA1 as regulator of stemness in AML. The identification of samples obtained from favorable-risk patients with AML that exhibit long-latency engraftment in xenografts14 raises the possibility of pharmacologic modulation of latency as a therapeutic strategy in AML to target LSCs for exhaustion. Indeed, KD of CDC42, an upstream regulator of PAK4, prolonged latency in a human MLL-AF9/NRas AML model.34,36 Interestingly, PAK4 expression levels are lowest in AML compared with other cancers in the The Cancer Genome Atlas database, whereas INKA1 expression is more variable across cancer types, but is comparatively high in AML (supplemental Figure 23).50,51 Several PAK4 inhibitors are currently being tested in preclinical and clinical studies for solid cancers, where high PAK4 expression correlates with poor prognosis and tumor aggressiveness.52-54 However, our study raises the concern that global PAK4 inhibition might actually protect cancer stem cells from antiproliferative treatments by delaying exit from quiescence. An alternative strategy supported by our INKA1-KD data would be to upregulate or activate PAK4 to drive cancer stem cells into cycle and thereby sensitize them to antiproliferative therapies.
PAK4 is a kinase with multiple targets that is involved in regulation of multiple cellular pathways with potentially different biological consequences in different cancers.52,55,56 However, to our knowledge, it has never been implicated in epigenetic regulation. Our data support a potential linkage between PAK4 and H4K16ac. Although H4K16ac is known to be differentially regulated across the G1-S-G2-M phases of the cell cycle,57-59 our results now link the absence of H4K16ac to retention of cells in G0, and hence to stem cell quiescence. Interestingly, Florian et al.35 showed that increasing H4K16ac levels via Cdc42 inhibition with Casin resulted in enhanced engraftment of aged murine HSC. Our study shows that in a leukemia context, H4K16ac is reduced upon INKA1-OE-induced changes in PAK4 abundance, localization, and activity, leading to prolonged latency and preservation of stem cell function. Together, these results point to possible species-specific and/or context-specific (age, normal vs leukemic) differences in PAK4 and H4K16ac regulation that require further examination.
In summary, this work sets the stage for future investigation of the roles of activation and latency in maintenance of LSC function and therapy resistance. Identifying and dissecting such programs will potentially define new strategies for targeting LSC vulnerabilities in AML.
The online version of this article contains a data supplement.
The publication costs of this article were defrayed in part by page charge payment. Therefore, and solely to indicate this fact, this article is hereby marked “advertisement” in accordance with 18 USC section 1734.
Acknowledgments
The authors thank the obstetrics unit of Trillium Health Partners (Mississauga and Credit Valley sites) for cord blood samples, the sort operators at the UHN-SickKids Flow Cytometry Facility for cell sorting, Jessica L. McLeod for help with intrafemoral injections, Jason Moffat for access to his plasmid libraries (lenti ORFeome, ORFeome 8.1), and Stefan Stein for providing gp91P415H cDNA.
This work was supported by the Deutsche Forschungsgemeinschaft (German Research Foundation; K.B.K). This research is part of the University of Toronto’s Medicine by Design initiative, which receives funding from the Canada First Research Excellence Fund. Work in J.E.D.’s laboratory is supported by grants from the Canadian Institutes of Health Research, Canadian Cancer Society, Terry Fox Foundation, Genome Canada through the Ontario Genomics Institute, Ontario Institute for Cancer Research with funds from the province of Ontario, a Canada Research Chair, the Princess Margaret Hospital foundation, and the Ontario Ministry of Health and Long Term Care. Computational analysis was supported in part by Medicine by Design, Ontario Research Fund (#34876), Natural Sciences Research Council (NSERC #203475), Canada Foundation for Innovation (#29272, #225404, #30865), Krembil Foundation, and IBM.
Authorship
Contribution: K.B.K. designed the study, performed research, analyzed data, and wrote the manuscript; L.G.-P., Q.L., A.M., S.-I.T., and G.K. performed research and analyzed data; S.W.K.N., C.A.C., M.J.T., and C.P. analyzed data; E. Wienholds and P.v.G provided an initial screen concept; E. Wagenblast provided the Ultramir construct; M.D.M. provided patient samples and the list of AML genes; E.R.L. and S.Z. provided conceptual advice; I.J. provided research support and conceptual advice; J.C.Y.W. provided research support and conceptual advice and wrote the manuscript; S.Z.X. performed experiments, analyzed data, and provided conceptual advice; and J.E.D. supervised the study and wrote the manuscript.
Conflict-of-interest disclosure: S.-I.T. is a current employee of Kyowa Hakko Kirin Co Ltd. E. Wienholds is a current employee of Deep Genomics Inc. J.E.D. has sponsored research agreements with Celgene and is on the Scientific Advisory Board of Trillium Therapeutics. The remaining authors declare no competing financial interests.
Correspondence: John E. Dick, Princess Margaret Cancer Centre, 101 College St, Princess Margaret Cancer Research Tower, Toronto, ON M5G 2C1, Canada; e-mail: jdick@uhnresearch.ca.

This feature is available to Subscribers Only
Sign In or Create an Account Close Modal