

Key Points
Ski is required for the fitness of HSCs, in which it suppresses TGF-β signaling and abnormal RNA splicing.
Active TGF-β signaling and abnormal RNA splicing occur in a subset of patients with MDS who exhibit loss of SKI because of miR-21.

Abstract
The transforming growth factor beta (TGF-β) signaling pathway controls hematopoietic stem cell (HSC) behavior in the marrow niche; however, TGF-β signaling becomes chronic in early-stage myelodysplastic syndrome (MDS). Although TGF-β signaling normally induces negative feedback, in early-stage MDS, high levels of microRNA-21 (miR-21) contribute to chronic TGF-β signaling. We found that a TGF-β signal–correlated gene signature is sufficient to identify an MDS patient population with abnormal RNA splicing (eg, CSF3R) independent of splicing factor mutations and coincident with low HNRNPK activity. Levels of SKI messenger RNA (mRNA) encoding a TGF-β antagonist are sufficient to identify these patients. However, MDS patients with high SKI mRNA and chronic TGF-β signaling lack SKI protein because of miR-21 activity. To determine the impact of SKI loss, we examined murine Ski−/− HSC function. First, competitive HSC transplants revealed a profound defect in stem cell fitness (competitive disadvantage) but not specification, homing, or multilineage production. Aged recipients of Ski−/− HSCs exhibited mild phenotypes similar to phenotypes in those with macrocytic anemia. Second, blastocyst complementation revealed a dramatic block in Ski−/− hematopoiesis in the absence of transplantation. Similar to SKI-high MDS patient samples, Ski−/− HSCs strikingly upregulated TGF-β signaling and deregulated expression of spliceosome genes (including Hnrnpk). Moreover, novel single-cell splicing analyses demonstrated that Ski−/− HSCs and high levels of SKI expression in MDS patient samples share abnormal alternative splicing of common genes (including those that encode splicing factors). We conclude that miR-21–mediated loss of SKI activates TGF-β signaling and alternative splicing to impair the competitive advantage of normal HSCs (fitness), which could contribute to selection of early-stage MDS-genic clones.
Introduction
Adult hematopoietic stem cell (HSC) fitness is functionally defined as clonal competition to home and reside in the bone marrow niche while maintaining a balance between sufficient multilineage differentiation and long-term self-renewal/quiescence. The transforming growth factor beta (TGF-β) signaling pathway regulates HSC fate1 but is abnormally active in patients with early-stage myelodysplastic syndrome (MDS).2 The deregulation of TGF-β signaling is of clinical interest because the amplitude of TGF-β signaling may have prognostic value in MDS,2 and TGF-β receptor inhibitors improve hematopoiesis in MDS samples.3
TGF-β signaling is tightly controlled by antagonists (eg, SMAD7, SKI) which block promiscuous activity. Upon ligand receptor engagement, these antagonists are transiently eliminated to amplify the signal; however, they are re-induced by TGF-β signaling and subsequently terminate the signal (a negative feedback loop).4 Early-stage MDS marrow cells have significantly diminished expression of SMAD7, which normally competes with R-SMADs for receptor binding and elevated levels of microRNA-21 (miR-21) which targets SMAD7.3,5 Thus, miR-21 interferes with the TGF-β negative feedback loop to generate a chronic TGF-β signal in MDS.
The Ski family members (SKI, SNO) function as transcriptional co-repressors in the Ski/NCoR/mSin3A/HDAC complex6,7 for Smad, PU.1, Gli, MAD, and thyroid hormone receptor proteins.8-11 Originally, Ski was identified as the proto-oncogene transduced by the avian Sloan Kettering Institute retroviruses.12,13 Rearrangements during viral transduction eliminated the C-terminus of Ski,13 and the N-terminal region contained in v-Ski is sufficient for transformation14 and is alternatively spliced.15,16 The closest gene relative to Ski is Skil (encoding Sno), which shares many of the functional domains found in Ski, but encodes a shorter protein product and has weaker transformation capacity compared with Ski.17,18 In mice, loss of Ski function is lethal because of severe defects in neurulation and vertebral and craniofacial patterning,19 whereas in humans, SKI has been implicated in the craniofacial defects associated with the 1p36 monosomy microdeletion syndrome20 as well as in Shprintzen-Goldberg syndrome.21,22 Recently, Ski gain of function was shown to maintain HSC repopulating activity ex vivo,23 whereas overexpression of Ski in wild-type hematopoietic stem and progenitor cells caused myeloproliferative disease by promoting HSC gene signatures.24 Although these results implicate Ski in promoting HSC fitness at steady state, it is not known whether Ski is critically required for proper HSC function.
Here, analysis of published primary human MDS RNA sequencing (RNA-Seq) data using a TGF-β signaling pathway signature identified a novel predominant molecular subtype of MDS associated strongly with SKI expression. This subtype was defined by abnormal alternative splicing and is associated with loss of HNRNPK expression rather than splicing factor mutations. Although MDS patients with chronic TGF-β signaling are associated with high expression of SKI messenger RNA (mRNA), these patients essentially lack SKI protein. This finding may explain why elevated mRNA for a TGF-β antagonist (SKI) identifies cells with chronic TGF-β signaling. Mechanistically, Ski is translationally blocked by miR-21, which is elevated in MDS coincident with chronic TGF-β. To genetically determine the impact of SKI loss, we examined murine Ski−/− HSCs and found a defect in HSC fitness even in the absence of transplantation (blastocyst complementation). Moreover, Ski−/− HSCs upregulate gene expression indicative of TGF-β superfamily signaling and exhibit splicing alterations associated with low HNRNPK activity. Our findings suggest that loss of Ski is sufficient to generate important aspects of human MDS pathobiology with high expression of SKI.
Materials and methods
See supplemental Data (available on the Blood Web site) for details regarding materials and methods.
Data sets
The fetal liver (FL)-Ski+/+ and FL-Ski−/− single-cell RNA-Seq data sets are deposited in the Gene Expression Omnibus database as series GSE115903.
Statistics
To determine significance between groups, comparisons were made using the Student two-tailed t test, and P < .05 was accepted for statistical significance.
Results
An SKI-correlated gene signature underlies activated TGF-β signaling and deregulated splicing in early-stage MDS
Some patients with early-stage MDS display chronic TGF-β signaling.2,3 We reanalyzed a published bulk RNA-Seq data set of CD34+ bone marrow cells from patients with MDS25 using a TGF-β signaling gene signature that separated samples from MDS patients from those from healthy controls (supplemental Figure 1A) in which SKI mRNA was consistently upregulated (Figure 1A). Supervising only on SKI-correlated gene expression, we identified a novel major subset of MDS patients that is distinct from healthy controls (Figure 1B). The SKI-high MDS-restricted cluster was enriched for patients diagnosed with early-stage MDS (12 low-risk vs 9 high-risk patients). Expression of SKI similarly organized a larger gene array data set of MDS patient samples (supplemental Figure 1B),26 with strong gene set enrichment analysis27 correlation between SKI-high gene expression enrichments found in the 2 data sets (supplemental Figure 1C). Next, we determined the differentially expressed genes between the SKI-high vs healthy controls and SKI-low groups vs healthy controls (fold change >1.5; adjusted P < .05). The SKI-high group exhibited a large number of differentially expressed genes (7572 upregulated, 4706 downregulated), whereas the SKI-low group showed relatively small differences compared with controls (101 upregulated, 167 downregulated). The genes upregulated in the SKI-high group were enriched for those involved in signaling by G protein-coupled receptors, CDC42 signaling, and TGF-β superfamily signaling (Figure 1C). Alternatively, the downregulated genes in the SKI-high group were enriched for those involved in metabolism of RNA, mitotic cell cycle, tricarboxylic acid cycle, and metabolism (Figure 1C). As evidenced by the differential expression of TGF-β pathway genes, these results suggest that upregulation of SKI mRNA in patients with early-stage MDS is associated with a chronic TGF-β signal.
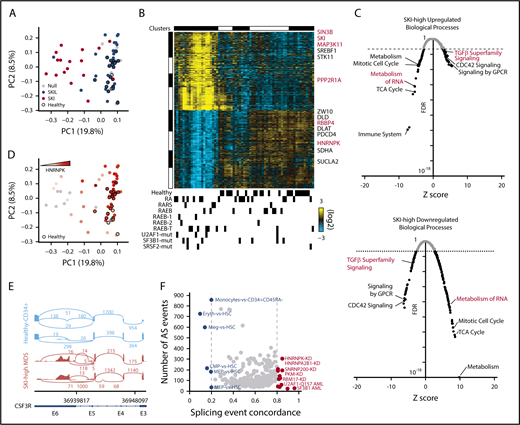
Either TGF-β signaling or SKI-correlated gene signatures identify activated TGF-β signaling and deregulated splicing in early-stage MDS. (A) Principal component analysis (PCA) plot for bulk RNA-Seq data for CD34+ bone marrow cells organized by a TGF-β signaling gene expression signature (23 healthy donors, 44 MDS patients). Each dot represents 1 patient sample, healthy donors are indicated by black borders, and the color represents strong correlation to SKI or SKIL. (B) Heatmap of the top SKI-correlated genes. Each column represents 1 sample and each row represents 1 gene. Top: gene expression clusters were generated in AltAnalyze with the key genes indicated on the right; bottom: clinical characterizations are noted. Mutations in splicing factors are noted (U2AF1-mut, SF3B1-mut, and SRSF2-mut) (supplemental Figure 1A). (C) Scatter plot displaying the false discovery rate (FDR) P value vs Z-score of individual biological processes enriched by the differentially (top) upregulated or (bottom) downregulated genes in SKI-high MDS samples compared with controls. Each dot represents a biological process, and the dotted line indicates an FDR P value of .05. (D) PCA plot from panel A, in which the color represents increasing expression of HNRNPK. (E) Alternative splicing (AS) example: representative sashimi plots of the CSF3R locus reveals MDS-specific premature termination of the open reading frame. (F) Splicing concordance analysis: scatter plot displaying splicing event concordance vs the number of AS events in common between SKI-high MDS samples and each displayed splicing data set (eg, HNRNPK-KD). GPCR, G protein-coupled receptors; RA, refractory anemia; RAEB, refractory anemia with excess blasts; RARS, refractory anemia with ringed sideroblasts; TCA, tricarboxylic acid.
Either TGF-β signaling or SKI-correlated gene signatures identify activated TGF-β signaling and deregulated splicing in early-stage MDS. (A) Principal component analysis (PCA) plot for bulk RNA-Seq data for CD34+ bone marrow cells organized by a TGF-β signaling gene expression signature (23 healthy donors, 44 MDS patients). Each dot represents 1 patient sample, healthy donors are indicated by black borders, and the color represents strong correlation to SKI or SKIL. (B) Heatmap of the top SKI-correlated genes. Each column represents 1 sample and each row represents 1 gene. Top: gene expression clusters were generated in AltAnalyze with the key genes indicated on the right; bottom: clinical characterizations are noted. Mutations in splicing factors are noted (U2AF1-mut, SF3B1-mut, and SRSF2-mut) (supplemental Figure 1A). (C) Scatter plot displaying the false discovery rate (FDR) P value vs Z-score of individual biological processes enriched by the differentially (top) upregulated or (bottom) downregulated genes in SKI-high MDS samples compared with controls. Each dot represents a biological process, and the dotted line indicates an FDR P value of .05. (D) PCA plot from panel A, in which the color represents increasing expression of HNRNPK. (E) Alternative splicing (AS) example: representative sashimi plots of the CSF3R locus reveals MDS-specific premature termination of the open reading frame. (F) Splicing concordance analysis: scatter plot displaying splicing event concordance vs the number of AS events in common between SKI-high MDS samples and each displayed splicing data set (eg, HNRNPK-KD). GPCR, G protein-coupled receptors; RA, refractory anemia; RAEB, refractory anemia with excess blasts; RARS, refractory anemia with ringed sideroblasts; TCA, tricarboxylic acid.
SKI-high MDS samples exhibited decreased expression of members of the spliceosome (eg, HNRNPK; Figure 1B,D). Comparison of patients with SKI-high MDS with healthy controls for alternative splicing identified 2081 unique differential splicing events (>10% difference; adjusted P < .05). Among the top differentially spliced genes was CSF3R, encoding the granulocyte-colony stimulating factor receptor, which is mutated in MDS.28 Because the detected CSF3R splice variant RNA results in a prematurely terminated mRNA transcript in SKI-high MDS that is predicted to be degraded (Figure 1E), it is likely that this event would significantly impair neutrophil generation in these patients. Conversely, we identified only 84 unique splicing events comparing patients with SKI-low MDS with healthy controls.
To understand the possible cause of the splicing changes in these samples, we compared the splicing events to a large compendium of RNA-binding protein knockdowns, cell-type splicing signatures, and acute myeloid leukemia splicing factor mutation–defined splicing signatures derived from existing RNA-Seq data sets.29,30 We find that the SKI-high MDS splicing is most consistent with an increase in splicing associated with HSCs compared with erythroid or megakaryocyte progenitors, consistent with MDS-associated anemia (Figure 1F). Although a small number of SKI-high MDS patients have SF3B1 or U2AF1 mutations, SF3B1 mutation– and U2AF1-Q157 mutation–induced splicing accounted for <50 splicing events in total within the SKI-high MDS samples. Conversely, among knockdowns with >50 overlapping events, splicing associated with knockdown of HNRNPK shared the greatest number of genes with SKI-high MDS (Figure 1F). To mechanistically link the SKI-high splicing signature to specific splicing factors, we compared the differentially spliced genes in the SKI-high MDS signature with human crosslinking immunoprecipitation sequencing (CLIP-Seq) data (ENCODE; Encyclopedia of DNA Elements) for 108 RNA binding proteins (supplemental Table 1), using a slightly modified version of our RELI algorithm.31 Of these, 49 factors were enriched for binding events within SKI-high gene bodies (adjusted P < .05), but only 4 of these factors meet a 75% splicing event concordance cutoff and are differentially expressed in SKI-high patients (HNRNPK, HNRNPC, PRPF8, and U2AF1, with fold changes of 1.2, 1.3, 1.4, and 1.5, respectively; P < .05, false discovery rate corrected). Notably, HNRNPK was the most significantly differentially expressed among these (adjusted P = 8 × 10⁻⁷). In addition, a de novo motif resembling the poly-C binding specificity of HNRNPK was also highly statistically enriched within SKI-high alternative exon sequences (P < .05). These results support our conclusion that loss of HNRNPK can account for several alternative splicing events found in SKI-high patients.
To investigate the potential MDS relevance of SKI-high alternative splicing events, we compared the alternative splicing events in the SKI-high patients with the HNRNPK-KD (overlapping in K562 or HEPG2) and HNRNPA2B1-KD (K562) data sets. This identified 46 splicing events corresponding to 38 genes (supplemental Table 1) that are enriched for mediators of cellular response to DNA damage stimulus and alternative splicing regulation. Although none of these overlapping alternative splicing genes are common MDS drivers, the HEPG2 HNRNPK-KD events also found in SKI-high patients include alternative splicing of EZH2 and CSF3R. Six additional SKI-high alternative splicing genes were found to overlap with K562 HNRNPK-KD (SRSF11, AURKB, GSK3B, PSIP1, FHIT, and CASP8, using a DisGeNET-curated MDS gene set: C3463824). Overlapping events in SKI-high patients and K562 HNRNPA2B1-KD data found ZRSR2, CD55, MECP2, FANCD2, and DERL1 to be alternative splicing (DisGeNET). Hence, multiple independent analyses (knockdown, CLIP-Seq, binding site, and gene expression), indicate that HNRNPK is a SKI-associated splicing regulator.
miR-21 targets Ski in primary hematopoietic cells and early-stage MDS
Having observed chronic TGF-β signaling gene expression in cells with elevated expression of SKI mRNA, which encodes a TGF-β signal antagonist, we considered whether upregulation of SKI mRNA could be a consequence of microRNA (miR)-mediated blockade in SKI translation. To investigate the latter possibility, we identified a region of the Ski 3′-untranslated region (3′ UTR) that exhibits nearly complete evolutionary conservation, an unusual property for noncoding sequences. Specifically, the first 500 base pairs of the SKI 3′ UTR demonstrate almost complete sequence identity among mouse, rat, and human genes and contain a perfect 8-base-pair seed match for miR-21 (Figure 2A), which is elevated in the bone marrow of some patients with early-stage MDS5 and in 33.3% of SKI-high patient samples (supplemental Figure 1B). We find a strong correlation between the levels of SKI and MIR21 in this patient cohort (P = 6 × 10⁶) despite some patients expressing high levels of either SKI or MIR21 but not the other (each comprising 16.5% of the cohort, with the remaining 33.9% of patients expressing low levels of both SKI and MIR21). To validate direct regulation of SKI mRNA by miR-21, we performed a standard luciferase sensor assay. To generate an Ski-luciferase sensor construct, a firefly luciferase gene was fused to the first 500 base pairs of the murine SKI 3′ UTR, which contains the putative miR-21 target sequence. When transfected into MCF7 cells, which express miR-21,32 we observed a 50% reduction in luciferase activity for the SKI-luciferase sensor construct compared with the luciferase vector control (Figure 2B). The reduction in luciferase activity is miR-21 specific because the mutation of 2 nucleotides in the miR-21 binding seed sequence (Figure 2A) normalized the activity of the Ski-luciferase sensor (Figure 2B). We also overexpressed miR-21 in wild-type murine lineage– bone marrow cells and observed a significant decrease in Ski protein compared with empty vector–transduced cells (Figure 2C).
![Figure 2. miR-21 targets Ski in primary hematopoietic cells and early-stage MDS. (A) Sequence alignment between miR-21 and a region of the SKI 3′ UTR that is conserved between humans and mice. (B) miR target validation: luciferase sensor assay for the empty vector (EV), wild-type (WT), or mutated SKI 3′ UTR in MCF7 cells (mean ± standard error of the mean [SEM] for 3 independent experiments). (C) miR-21 forced expression: representative immunoblot of retroviral transduced lineage– bone marrow (from 3 independent experiments). Nearby protein marker sizes (in kDa) are indicated. (D) Primary marrow cell context for miR-21 activity: representative immunoblot of freshly isolated lineage– bone marrow from mice with the indicated genotypes (above the immunoblot) (from 3 independent experiments). Nearby protein marker sizes (in kDa) are indicated. (E) Steady-state Ski mRNA levels in freshly isolated lineage– bone marrow cells (from 3 biological replicates). (F) Validation in miR-21–expressing MDS: confocal microscopy images of immunofluorescent anti-SKI staining of human bone marrow sections with the indicated diagnoses. The scale bars represent 100 μm for 20× images and 25 μm for 60× images. Red text indicates samples with MIR21 quantitation. (G) Quantitation of immunofluorescence staining in panel F. Red dots indicate samples with MIR21 quantitation. (H) Steady-state MIR21 mRNA levels in bone marrow samples. (I) Comparison between the fraction of SKI-expressing cells and MIR21 mRNA levels in MDS patients. Data in (B,E,G-I) are displayed as mean ± SEM. **P < .01; ***P < .001. Ab, antibody; DAPI, 4′,6-diamidino-2-phenylindole; RCMD, refractory cytopenia with multilineage dysplasia.](https://ash.silverchair-cdn.com/ash/content_public/journal/blood/132/21/10.1182_blood-2018-06-860890/5/m_blood860890f2.png?Expires=1770249535&Signature=tu0ui5Pr7-vDudNF04I9RTGS0-3E-S5gClpn0tW81tXhqwDQ0XITjkkEsN67inXFo3Bq9pVQLn8Kgm4Ij00o0-JoDIKi-50N0qmdEdHOWKDkZgF0FXhI2hg08Ol3S~wP~OolQ~BOVqwRgW4xSs5YNtV-G2oAmIFSXE807e~fY3wHDZgwFSOFZGR5v8UuA1thzkTbc6Vljs9wOhF~zb1~HWAtTvtH9ka6YTbzh9dgn~0psVSbOb7uQzSeT-QWPcX824AZBcVSqIo-IG9h8U9DzyFW6Orv~YmmCcs4pTRfdoNk3~7~JVY1dTxRcCSn0RyEy~3wMvlE~2-dUo69b0TLsA__&Key-Pair-Id=APKAIE5G5CRDK6RD3PGA)
miR-21 targets Ski in primary hematopoietic cells and early-stage MDS. (A) Sequence alignment between miR-21 and a region of the SKI 3′ UTR that is conserved between humans and mice. (B) miR target validation: luciferase sensor assay for the empty vector (EV), wild-type (WT), or mutated SKI 3′ UTR in MCF7 cells (mean ± standard error of the mean [SEM] for 3 independent experiments). (C) miR-21 forced expression: representative immunoblot of retroviral transduced lineage– bone marrow (from 3 independent experiments). Nearby protein marker sizes (in kDa) are indicated. (D) Primary marrow cell context for miR-21 activity: representative immunoblot of freshly isolated lineage– bone marrow from mice with the indicated genotypes (above the immunoblot) (from 3 independent experiments). Nearby protein marker sizes (in kDa) are indicated. (E) Steady-state Ski mRNA levels in freshly isolated lineage– bone marrow cells (from 3 biological replicates). (F) Validation in miR-21–expressing MDS: confocal microscopy images of immunofluorescent anti-SKI staining of human bone marrow sections with the indicated diagnoses. The scale bars represent 100 μm for 20× images and 25 μm for 60× images. Red text indicates samples with MIR21 quantitation. (G) Quantitation of immunofluorescence staining in panel F. Red dots indicate samples with MIR21 quantitation. (H) Steady-state MIR21 mRNA levels in bone marrow samples. (I) Comparison between the fraction of SKI-expressing cells and MIR21 mRNA levels in MDS patients. Data in (B,E,G-I) are displayed as mean ± SEM. **P < .01; ***P < .001. Ab, antibody; DAPI, 4′,6-diamidino-2-phenylindole; RCMD, refractory cytopenia with multilineage dysplasia.
miR-21 targets Ski in primary hematopoietic cells and early-stage MDS. (A) Sequence alignment between miR-21 and a region of the SKI 3′ UTR that is conserved between humans and mice. (B) miR target validation: luciferase sensor assay for the empty vector (EV), wild-type (WT), or mutated SKI 3′ UTR in MCF7 cells (mean ± standard error of the mean [SEM] for 3 independent experiments). (C) miR-21 forced expression: representative immunoblot of retroviral transduced lineage– bone marrow (from 3 independent experiments). Nearby protein marker sizes (in kDa) are indicated. (D) Primary marrow cell context for miR-21 activity: representative immunoblot of freshly isolated lineage– bone marrow from mice with the indicated genotypes (above the immunoblot) (from 3 independent experiments). Nearby protein marker sizes (in kDa) are indicated. (E) Steady-state Ski mRNA levels in freshly isolated lineage– bone marrow cells (from 3 biological replicates). (F) Validation in miR-21–expressing MDS: confocal microscopy images of immunofluorescent anti-SKI staining of human bone marrow sections with the indicated diagnoses. The scale bars represent 100 μm for 20× images and 25 μm for 60× images. Red text indicates samples with MIR21 quantitation. (G) Quantitation of immunofluorescence staining in panel F. Red dots indicate samples with MIR21 quantitation. (H) Steady-state MIR21 mRNA levels in bone marrow samples. (I) Comparison between the fraction of SKI-expressing cells and MIR21 mRNA levels in MDS patients. Data in (B,E,G-I) are displayed as mean ± SEM. **P < .01; ***P < .001. Ab, antibody; DAPI, 4′,6-diamidino-2-phenylindole; RCMD, refractory cytopenia with multilineage dysplasia.
Next, we determined whether miR-21 uses mRNA cleavage or translational blockade to modulate Ski. We note that forced miR expression mimics small interfering RNA and leads to mRNA cleavage.33 To explore miR-21 regulation of Ski in a primary cell context without forced miR-21 expression, we examined Gfi1−/− bone marrow cells in which the Gfi1 target gene mir21 is deregulated leading to high miR-21 activity.34 In Gfi1−/− bone marrow cells, we found a dramatic reduction in Ski protein (Figure 2D), and the level of Ski mRNA was modestly elevated (Figure 2E). Importantly, Ski protein reduction in Gfi1−/− bone marrow cells is critically dependent upon miR-21 because Gfi1−/−mir21−/− restores Ski protein levels (Figure 2D). These results demonstrate that Ski is a direct translational target of miR-21 in primary hematopoietic cells.
Given that miR-21 levels are elevated in the bone marrow of some patients with early-stage MDS with chronic TGF-β signaling,5 we hypothesized that SKI expression may be reduced in early-stage MDS patient marrow. We performed immunofluorescence staining (Figure 2F) and found a marked reduction in global SKI signal across the bone marrow of most early-stage MDS samples. The specificity of this staining was confirmed by the noted absence of signal in control samples stained only with the secondary antibody and as compared with that detected in both healthy or non-MDS anemic controls (Figure 2F). To more accurately measure the observed changes in SKI expression, we used imaging software (Nikon Elements) to quantify the number of SKI+/DAPI+ cells, which were subsequently normalized by the total number of DAPI+ cells in each sample (% SKI-expressing cells). This quantitation supported our conclusion that SKI is globally lost in most MDS samples compared with controls (Figure 2G). Because we noted that a few MDS samples had relatively normal SKI levels, we hypothesized that these samples may not have elevated levels of MIR21. Comparison between the available MIR21 expression data5 (Figure 2H) and the SKI quantitation revealed a negative association between MIR21 and SKI expression (Figure 2I). Thus, in primary MDS patient specimens with elevated MIR21 and chronic TGF-β signaling, SKI protein is reduced.
Ski is critically required for HSC fitness
Next, we determined whether loss of Ski was sufficient to induce any of the changes within SKI-high MDS patient samples. Ski and Skil are both normally expressed in murine HSCs and early hematopoietic progenitors (supplemental Figure 2A).35 Although Ski has been implicated as a regulator of murine HSCs in gain-of-function studies,23,24 we sought to determine the functional impact of Ski loss of function. Germ line Ski−/− is perinatal lethal on the C57BL/6 background as a result of severe defects in neurulation and vertebral and craniofacial patterning.19 We circumvented this issue by analyzing Ski−/− hematopoiesis in embryonic day 14.5 (E14.5) fetuses. Compared with Ski+/+ FLs, those isolated from Ski−/− fetuses were hypocellular (supplemental Figure 2B). Therefore, we used flow cytometry to quantify the number of SLAM HSCs (lineage–Sca-1+c-Kit+CD48–CD150+) in the FLs (Figure 3A). We found a statistically significant reduction in the total number of lineage– cells but not lineage–Sca-1+c-Kit+ (LSK) or SLAM HSCs in Ski−/− FLs (supplemental Figure 2C). Despite a slight reduction in the total number of HSCs, Ski−/− FLs were significantly enriched for SLAM HSCs as reflected by the percentage of total cells (supplemental Figure 2D). Next, we transplanted equal numbers of FL cells from E14.5 Ski−/− mice or their Ski+/+ littermate controls (CD45.2) into lethally irradiated congenic (CD45.1) recipient mice (Figure 3B). The Ski+/+ and Ski−/− FL cells showed no significant difference in engraftment, whereas multilineage analysis at 4 months posttransplant revealed a modest reduction in Ski−/− HSC contribution to mature myeloid cells (supplemental Figure 2E-F). Furthermore, we detected equal numbers of Ski+/+ and Ski−/− SLAM HSCs in recipients after 4 months (Figure 3B; supplemental Figure 2G), demonstrating that Ski is not critically required for HSC specification, engraftment, or multilineage production.
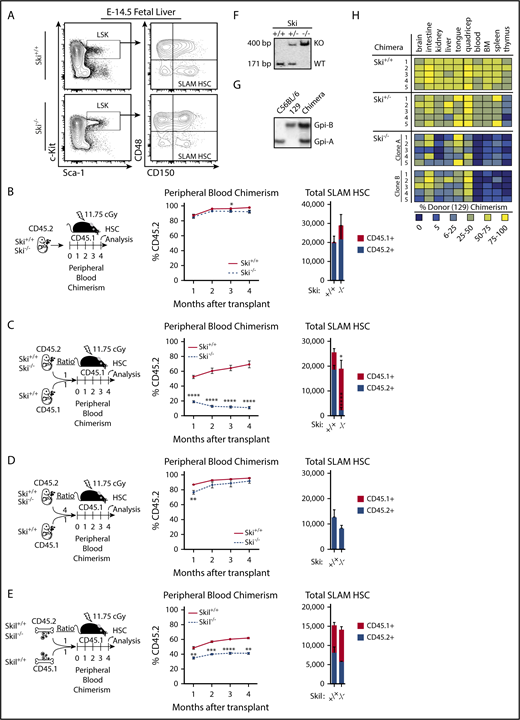
Ski is critically required for HSC fitness in the absence of transplantation. (A) Representative fluorescence-activated cell sorter plots of E14.5 FL cells gated on live, single lineage– cells. All scales are log10. LSK: lineage–Sca-1+c-Kit+ (supplemental Figure 2C-D). (B) For HSC transplantation controls, E14.5 FL cells were transplanted in the absence of competitors (5-6 mice per group), (C) for competitive Ski−/− HSC transplantation, E14.5 FL cells were transplanted at a 1:1 ratio to competitors (6 mice per group), (D) for dosage dependency, E14.5 FL cells were transplanted at a 4:1 ratio to competitors (6 mice per group), and (E) for competitive Skil−/− HSC transplantation, adult whole Skil−/− bone marrow cells were transplanted at a 1:1 ratio to competitors (6 mice per group), and recipients in panels B-E were analyzed for the percentage of donor contribution to peripheral blood chimerism and total number of SLAM HSCs. (F) Southern blot of Ski+/+, Ski+/− or Ski−/− ES cells used in blastocyst complementation assays confirms genotype. (G) A representative glucose phosphate isomerase assay used to quantify chimerism in blastocyst complementation assays. (H) A heatmap representation of tissue-specific chimerism in progeny from a blastocyst complementation assay with C57BL/6 mouse strain blastocysts complemented with 1 Ski+/+, 1 Ski+/−, or 2 independent Ski−/− ES cell clones derived from a 129P3 mouse (5 mice per clone). (B-E) data are displayed as mean ± SEM. *P < .05; **P < .01; ***P < .001; ****P < .0001.
Ski is critically required for HSC fitness in the absence of transplantation. (A) Representative fluorescence-activated cell sorter plots of E14.5 FL cells gated on live, single lineage– cells. All scales are log10. LSK: lineage–Sca-1+c-Kit+ (supplemental Figure 2C-D). (B) For HSC transplantation controls, E14.5 FL cells were transplanted in the absence of competitors (5-6 mice per group), (C) for competitive Ski−/− HSC transplantation, E14.5 FL cells were transplanted at a 1:1 ratio to competitors (6 mice per group), (D) for dosage dependency, E14.5 FL cells were transplanted at a 4:1 ratio to competitors (6 mice per group), and (E) for competitive Skil−/− HSC transplantation, adult whole Skil−/− bone marrow cells were transplanted at a 1:1 ratio to competitors (6 mice per group), and recipients in panels B-E were analyzed for the percentage of donor contribution to peripheral blood chimerism and total number of SLAM HSCs. (F) Southern blot of Ski+/+, Ski+/− or Ski−/− ES cells used in blastocyst complementation assays confirms genotype. (G) A representative glucose phosphate isomerase assay used to quantify chimerism in blastocyst complementation assays. (H) A heatmap representation of tissue-specific chimerism in progeny from a blastocyst complementation assay with C57BL/6 mouse strain blastocysts complemented with 1 Ski+/+, 1 Ski+/−, or 2 independent Ski−/− ES cell clones derived from a 129P3 mouse (5 mice per clone). (B-E) data are displayed as mean ± SEM. *P < .05; **P < .01; ***P < .001; ****P < .0001.
Because HSC fitness is functionally defined by clonal competition, we next transplanted an equal number of Ski+/+ or Ski−/− FL cells against Ski+/+ CD45.1 FL cells into lethally irradiated congenic recipient mice (Figure 3C). Despite robust contribution to peripheral blood chimerism in recipients of Ski+/+ FL cells, an immediate and drastic reduction in chimerism was detected in recipients of Ski−/− FL cells. Moreover, the number of donor-derived SLAM HSCs was significantly reduced in recipients of Ski−/− FL cells compared with controls. This Ski−/− defect was exacerbated after serial transplantation of unfractionated bone marrow from the primary transplant recipients into lethally irradiated congenic secondary recipients (supplemental Figure 2H). The contribution of Ski−/− FL cells to peripheral blood chimerism dropped further (from levels seen in the primary recipients), and Ski−/− SLAM HSCs were completely exhausted at 4 months posttransplant. Our results suggest a critical role for Ski in maintaining the long-term fitness of HSCs.
Although the number of Ski−/− phenotypic SLAM HSCs is not statistically different from that in wild-type FLs (Figure 3A), we questioned whether the competitive defects of Ski−/− HSCs are the result of a reduction in the number of functional HSCs. To this end, we transplanted 4 times the number of Ski+/+ or Ski−/− E14.5 FL cells compared to the number of Ski+/+ CD45.1 FL competitor cells into lethally irradiated congenic recipient mice (Figure 3D; supplemental Figure 2C). Peripheral blood chimerism levels in recipients of Ski−/− FL cells were rescued as well as total SLAM HSC numbers, as quantified at 4 months posttransplant. Given these data and a previous report that TGF-β–deficient HSCs have in vivo homing defects,36 we hypothesized that Ski−/− HSCs may also have an impaired capacity to home to the bone marrow (which could be rescued by increased numbers of cells). To test this, we used carboxyfluorescein diacetate succinimidyl ester (CSFE) to label Ski+/+ or Ski−/− FL cells prior to transplant into lethally irradiated recipients, then quantified the total number of CFSE+ SLAM HSCs in the bone marrow of the recipients at 16 hours posttransplant. Overall, Ski+/+ and Ski−/− FL cells had equivalent homing capacities (supplemental Figure 2I). By normalizing the number of homed SLAM HSCs to the total number injected, we calculated the percent of homed HSCs and found that Ski+/+ and Ski−/− FL SLAM HSCs had equivalent homing capacities, whereas similar numbers of total SLAM HSCs were detected in the bone marrow. These results suggest that Ski maintains HSC fitness through a mechanism separate from homing.
To investigate whether Ski−/− HSC defects extend to Ski family member Skil, we transplanted an equal number of Skil+/+ or Skil−/− whole bone marrow cells against Skil+/+ CD45.1 competitors into lethally irradiated congenic recipient mice (Figure 1E). Although we observed a modest yet significant decrease in the contribution of Skil−/− HSCs to peripheral blood reconstitution, the defect was less pronounced than in Ski−/− recipients. In contrast to the Ski−/− transplants, the total number of Skil+/+ and Skil−/− HSCs was statistically equivalent when quantified at 4 months posttransplant. Thus, our data implicate Ski as the critical member of its gene family in hematopoietic stem cell fitness.
Given the potential differences between fetal and adult hematopoiesis and the impact of HSC transplantation, we next examined the effect of Ski gene dosage on hematopoietic chimerism in the absence of transplantation. Specifically, we performed blastocyst complementation assays using Ski+/+, Ski+/−, or Ski−/− embryonic stem (ES) cells on the 129 background (Figure 3F-H) and wild-type C57BL/6 blastocysts. Chimerism in various organs in the resulting adult progeny was determined through glucose phosphate isomerase isoform analyses (Figure 3G). Progeny of Ski+/+ or Ski+/− ES cells contributed to all types of tissues in adult chimeras, with the notable exception of the thymus to which Ski+/− ES cells contributed poorly (Figure 3H). In contrast, whereas 2 independent Ski−/− ES cell clones contributed to the development of nonhematopoietic organs, we observed a consistent and sharp reduction in contribution to blood, bone marrow, spleen, and thymus (Figure 3H). These results confirm defective Ski−/− HSC fitness in the absence of transplantation and suggest a cell-intrinsic defect.
Loss of Ski is sufficient to upregulate TGF-β signaling and deregulate splicing in HSCs
Because Ski functions as a transcriptional corepressor, we next wanted to determine the transcriptional deregulation underlying Ski−/− HSC defects. To evaluate heterogeneity, we performed single-cell RNA-Seq (scRNA-Seq) on adult wild-type bone marrow–derived SLAM HSCs, and then bioinformatically identified quiescent and activated HSC populations. These clusters were derived by hierarchical ordered partitioning and collapsing hybrid (HOPACH) clustering of the wild-type bone marrow–derived HSCs using canonical cell cycle genes (defined by GO:0007049) (supplemental Figure 3A). A predicted quiescent population of cells was enriched for long-term HSC genes (eg, Procr, Mecom, Ifitm1) whereas an active population was enriched for cell cycle genes (eg, Mcm6, Pcna, Top2a), confirming our group classifications. Next, we analyzed transplanted FL-derived Ski+/+ or Ski−/− SLAM HSCs by scRNA-Seq at 6 months posttransplant, classified all Ski+/+ and Ski−/− cells against the expression centroids of these clusters (as previously described),37 and returned the clustered cells to their respective groups within each cluster (supplemental Figure 3B). We noted an equal distribution of Ski+/+ and Ski−/− cells between the quiescent and activated cell clusters, but Ski−/− HSCs displayed more downregulated than upregulated genes associated within each assigned cell state compared with wild-type HSCs (quiescent: 414 downregulated and 136 upregulated genes; activated: 380 downregulated and 108 upregulated genes) (Figure 4A). This may be explained either by a reduction in the number of genes expressed within these clusters or by a reduced fidelity of Ski−/− HSCs to their assigned clusters. However, the genes upregulated in quiescent Ski−/− HSCs were enriched for TGF-β superfamily signaling, CDC42 signaling, AKT signaling, BMP receptor signaling, the AP-1 network, metabolism, and metabolism of RNA (Figure 4B), whereas those downregulated were enriched in mRNA expression and gene expression (supplemental Figure 3C). Alternatively, the genes upregulated in activated Ski−/− HSCs were enriched for mRNA splicing and nucleotide excision repair (Figure 4C) whereas those downregulated in active Ski−/− HSCs were enriched for mTORC1 signaling, tricarboxylic acid cycle, metabolism, and gene expression (supplemental Figure 3D). These results identify Ski-dependent genetic programs that control major biological processes in HSCs.
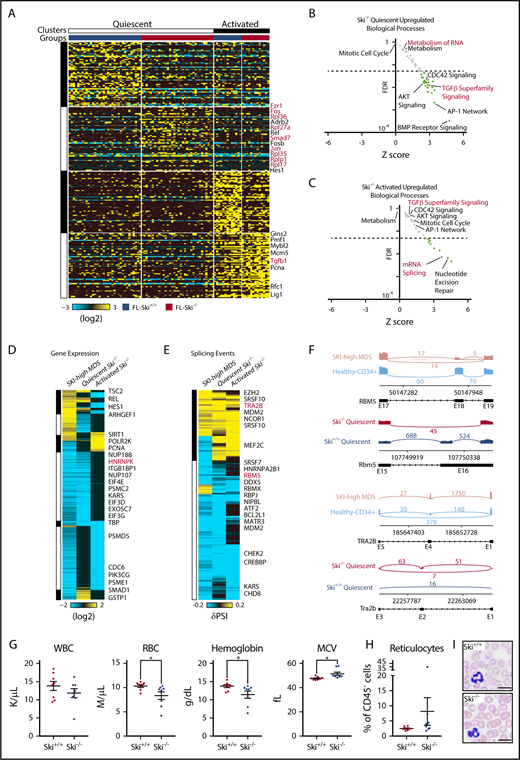
Loss of Ski is sufficient to upregulate TGF-β signaling and deregulate splicing in HSC. (A) Heatmap of scRNA-Seq from SLAM HSCs (94 cells). Each column represents a single cell and each row represents 1 gene. Top: Clusters and groups; right: key genes (supplemental Figure 3A). (B-C) Scatter plot displaying the FDR vs Z-score of individual biological processes enriched within the differentially expressed genes in Ski−/− HSCs compared with Ski+/+ HSCs. Each dot represents a biological process, and the dotted line indicates an FDR value of 0.05 (supplemental Figure 3B-C). (D) Comparative analysis of differential gene expression. Heatmap of conserved differential gene expression between SKI-high MDS patient samples (vs normal CD34+ controls) and Ski−/− HSCs (vs Ski+/+ HSCs). Each row represents a single gene; (right) key genes are annotated. (E) Comparative analysis of alternative splicing. Heatmap of alternative splicing events that are conserved between SKI-high MDS patient samples (vs normal CD34+ controls) and pseudobulk of single cells of Ski−/− HSCs (vs Ski+/+ HSCs). Each row represents a single gene; right: key genes are annotated. (F) Conserved alternative splicing examples: representative sashimi plots of the RBM5/Rbm5 and TRA2B/Tra2b loci. (G-I) Peripheral blood analysis of noncompetitive transplant recipients at 10 months posttransplant with Ski+/+ or Ski−/− FL cells. (G) Complete blood counts. (H) Quantitation of the fraction of peripheral blood reticulocytes as a percentage of all CD45– cells. (I) Representative peripheral blood smears (8 biological replicates per group). The scale bars represent 10 μm. (G-H) Data are displayed as mean ± SEM. *P < .05. MCV, mean corpuscular volume; RBC, red blood cell; WBC, white blood cell count.
Loss of Ski is sufficient to upregulate TGF-β signaling and deregulate splicing in HSC. (A) Heatmap of scRNA-Seq from SLAM HSCs (94 cells). Each column represents a single cell and each row represents 1 gene. Top: Clusters and groups; right: key genes (supplemental Figure 3A). (B-C) Scatter plot displaying the FDR vs Z-score of individual biological processes enriched within the differentially expressed genes in Ski−/− HSCs compared with Ski+/+ HSCs. Each dot represents a biological process, and the dotted line indicates an FDR value of 0.05 (supplemental Figure 3B-C). (D) Comparative analysis of differential gene expression. Heatmap of conserved differential gene expression between SKI-high MDS patient samples (vs normal CD34+ controls) and Ski−/− HSCs (vs Ski+/+ HSCs). Each row represents a single gene; (right) key genes are annotated. (E) Comparative analysis of alternative splicing. Heatmap of alternative splicing events that are conserved between SKI-high MDS patient samples (vs normal CD34+ controls) and pseudobulk of single cells of Ski−/− HSCs (vs Ski+/+ HSCs). Each row represents a single gene; right: key genes are annotated. (F) Conserved alternative splicing examples: representative sashimi plots of the RBM5/Rbm5 and TRA2B/Tra2b loci. (G-I) Peripheral blood analysis of noncompetitive transplant recipients at 10 months posttransplant with Ski+/+ or Ski−/− FL cells. (G) Complete blood counts. (H) Quantitation of the fraction of peripheral blood reticulocytes as a percentage of all CD45– cells. (I) Representative peripheral blood smears (8 biological replicates per group). The scale bars represent 10 μm. (G-H) Data are displayed as mean ± SEM. *P < .05. MCV, mean corpuscular volume; RBC, red blood cell; WBC, white blood cell count.
Next, to determine which deregulated processes in MDS are proximal to SKI loss of function, we compared the MDS and Ski−/− HSC data sets and found 55 commonly upregulated biological processes shared between Ski−/− HSCs and SKI-high MDS samples. Specifically, the genes upregulated in both SKI-high MDS and quiescent Ski−/− HSCs were enriched for members of the TGF-β superfamily signaling, CDC42 signaling, AKT signaling, and many cytokine/growth factor signaling pathways (ie, platelet-derived growth factor receptor, epidermal growth factor receptor, insulin-like growth factor 1, interleukin-5 [IL-5], granulocyte-macrophage colony-stimulating factor, interferon -γ, c-MET, estrogen receptor, vascular endothelial growth factor receptor 1 and 2, IL-3, and tumor necrosis factor-related apoptosis-inducing ligand) (Figure 4D). No pathways were found to be commonly depleted between SKI-high MDS and either of the Ski−/− HSC groups. Alternatively, there were 10 pathways upregulated in quiescent Ski−/− HSCs but downregulated in SKI-high MDS, including metabolism, translation, and metabolism of RNA. Similarly, 3 pathways were upregulated in activated Ski−/− HSCs but downregulated in SKI-high MDS, including DNA strand elongation and nucleotide excision repair. These results demonstrate the existence of significant cell state–specific differences in gene expression between the quiescent and activated HSC states, which highlights the importance of analyzing these populations separately. Furthermore, the identified conserved gene expression changes may be of potential functional significance to MDS. We note an upregulation of the lymphoid-specifying gene HES1/Hes138 (Figure 4D), which may contribute to the decreased myeloid output seen in MDS and in Ski−/− HSCs (supplemental Figure 2F). In addition, given that TGF-β signaling and CDC42 signaling both influence HSC polarity,39,40 their deregulation may influence HSC fate decisions in MDS. Overall, our results identify Ski-controlled genetic programs deregulated in MDS while suggesting that loss of Ski alone is sufficient to generate a chronic TGF-β signal.
Because the splicing pathway as a whole (metabolism of RNA) was commonly deregulated in both Ski−/− HSC and SKI-high MDS samples and both groups displayed downregulation of Hnrnpk/HNRNPK, we analyzed our transcriptional data to identify differential splicing events on a genome-wide scale. We found a number of significant alternative splicing events (in MDS bulk RNA-Seq and a pseudobulk compilation of the Ski−/− HSC scRNA-Seq) similar to the number of differentially expressed genes. We next focused our analysis on identifying orthologous splicing events based upon genomic exon-junction coordinates between quiescent Ski−/− HSCs and SKI-high MDS (Figure 4E), which had a striking enrichment for other members of the spliceosome (eg, RBM5, TRA2B). Notably, we observed significant inclusion of exon 18 of RBM5 (exon 16 of Rbm5) and inclusion of exon 4 of TRA2B (exon 2 of Tra2b), of which the TRA2B alternative splicing events are predicted to be loss of function (Figure 4F). Thus, in both humans and mice with loss of SKI, alternative splicing of spliceosome components (RBM5 and TRA2B) may augment low expression of HNRNPK.
Finally, we analyzed recipient mice 10 months after transplantation with Ski+/+ or Ski−/− FL cells. Compared with recipients of Ski+/+ FL cells, most recipients of Ski−/− FL cells displayed mild phenotypes similar to those in macrocytic anemia (lower red blood cell and hemoglobin counts, higher mean corpuscular volume, and more mitotic proerythroblasts) as well as slightly elevated numbers of circulating reticulocytes, and slightly reduced white blood cell counts (Figure 4G-I; supplemental Figure 3E). We conclude that loss of Ski is sufficient to induce TGF-β signaling and alternative splicing to hinder the fitness of normal HSCs. Suppression of normal HSC function is expected to facilitate selection of early-stage MDS-genic clones.
Discussion
The major barriers to the successful treatment of MDS include an incomplete understanding of disease pathobiology and a lack of actionable targets to eradicate MDS clones while sparing their normal counterparts. Previous work has implicated overactive TGF-β signaling in early-stage MDS pathobiology. Inhibition of the TGF-β receptor improved hematopoietic differentiation in MDS patient samples.2 However, because TGF-β signaling is used for the maintenance of many tissues, the complete blockade of its activity may not present a viable option for therapy. Instead, by gaining further insights into the direct transcriptional changes engendered by chronic TGF-β, new MDS-specific targets may be identified.
Because of the myelosuppressive effects of TGF-β, its downstream signaling must be tightly controlled to support balanced hematopoiesis. Thus, multiple levels of negative regulation are induced to suppress the signal, including a competitive inhibitor (SMAD7) and transcriptional corepressors (SKI, SNO). In early-stage MDS, high levels of miR-21 inhibit expression of SMAD7 and activate TGF-β signaling.5 We show that SKI is also suppressed by miR-21 in MDS. Chronic inflammation (inflammaging41 ) is thought to contribute to MDS predisposition, and inflammatory cytokine IL-6 signaling induces mir2142 and is elevated in MDS.43-47 Overall, our findings further nominate miR-21 as a central node that may integrate cell intrinsic genomic states and extrinsic (eg, inflammatory) cues to generate a chronic TGF-β signal in MDS.
Our data provide a mechanism to explain how the TGF-β signal may contribute to MDS pathobiology. We note that loss of SKI was accompanied by loss of spliceosome gene expression (eg, HNRNPK) as well as alternative splicing of other splicing factors. Because spliceosomal gene mutations and aberrant splicing are hallmarks of MDS,48 our data nominate the loss of SKI (downstream of elevated miR-21) as a potential key event underlying aberrant splicing in MDS (alternative splicing events that are independent of splicing factor mutations). Indeed, Hnrnpk+/− mice develop transplantable hematopoietic neoplasms with myeloproliferation.49
In early-stage MDS, chronic TGF-β signaling is thought to contribute to clonal expansion of HSC-bearing MDS mutations. Thus, events in early-stage MDS leading to upregulation of miR-21 would lead to loss of SKI. We find that loss of SKI alone is sufficient to generate a chronic TGF-β signal and features similar to macrocytic anemia. Moreover, high expression of MIR21 and SKI mRNA is slightly correlated with the del(5q) mutation (P = .049), and del(5q) MDS patients commonly exhibit active TGF-β signaling and macrocytic anemia.50,51 Thus, del(5q) MDS patients, or MDS patients with high serum IL-6 or high MIR21 and SKI mRNA expression may benefit the most from therapies that inhibit the TGF-β pathway (perhaps by targeting miR-21).
The full-text version of this article contains a data supplement.
The publication costs of this article were defrayed in part by page charge payment. Therefore, and solely to indicate this fact, this article is hereby marked “advertisement” in accordance with 18 USC section 1734.
Acknowledgments
The authors thank V. Summey, J. Bailey, M. Venkatasubramanian, J. Kitzmiller, T. Bourdeau, M. Meadows, M. Kofron, and J. Whitsett for technical assistance; S. Porteous for initial analysis of Ski null blood cells; K. Luo for Skil−/− mice; H. Xu and D. Williams for initial studies of Ski−/− HSC transplants (not included here); Y. Liu and J. Xu for the R script to generate false discovery rate plots; and the Cincinnati Children’s Hospital Medical Center Flow Cytometry Core, Gene Expression Core, DNA Core, and Confocal Imaging Core. The authors also thank J. Cancelas, E. Stavnezer, M. D. Filippi, G. Huang, and D. Starczynowski for helpful discussions.
This work was partially supported by grants from the National Institutes of Health, National Institute of Environmental Health Sciences (T32 ES007250) (D.E.M.), National Heart, Lung, and Blood Institute (HL122661), National Cancer Institute (CA196658), and the Edward P. Evans Foundation (H.L.G.).
D.E.M. is a PhD candidate at the University of Cincinnati. This work is submitted in partial fulfillment of the requirement for his doctorate.
Authorship
Contribution: D.E.M. performed experiments, analyzed results, generated figures, and wrote the article; K.F. analyzed results; C.S.V. performed experiments, analyzed results, and generated figures; C.C. shared Ski−/− mice and performed experiments; K.P. analyzed results and generated figures; M.T.W. and X.C. performed computational analyses; A.V. shared MDS patient samples; K.C. analyzed data; N.S. analyzed results, generated figures, and wrote the article; and H.L.G. designed experiments and wrote the article.
Conflict-of-interest disclosure: The authors declare no competing financial interests.
Correspondence: H. Leighton Grimes, Cincinnati Children’s Hospital Medical Center, 3333 Burnet Ave, MLC7038, Cincinnati, OH 45229; e-mail: lee.grimes@cchmc.org; and Nathan Salomonis, Cincinnati Children’s Hospital Medical Center, 3333 Burnet Ave, MLC 7024, Cincinnati, OH 45229; e-mail: nathan.salomonis@cchmc.org.

This feature is available to Subscribers Only
Sign In or Create an Account Close Modal