

Key Points
Deletion of BM Tfr2 ameliorates anemia and iron overload in a murine model of transfusion-independent thalassemia.
Deletion of Tfr2 enhances transcription of genes involved in cell proliferation and mitochondrial activity.

Abstract
β-thalassemias are genetic disorders characterized by anemia, ineffective erythropoiesis, and iron overload. Current treatment of severe cases is based on blood transfusion and iron chelation or allogeneic bone marrow (BM) transplantation. Novel approaches are explored for nontransfusion-dependent patients (thalassemia intermedia) who develop anemia and iron overload. Here, we investigated the erythropoietin (EPO) receptor partner, transferrin receptor 2 (TFR2), as a novel potential therapeutic target. We generated a murine model of thalassemia intermedia specifically lacking BM Tfr2: because their erythroid cells are more susceptible to EPO stimulation, mice show improved erythropoiesis and red blood cell morphology as well as partial correction of anemia and iron overload. The beneficial effects become attenuated over time, possibly due to insufficient iron availability to sustain the enhanced erythropoiesis. Germ line deletion of Tfr2, including haploinsufficiency, had a similar effect in the thalassemic model. Because targeting TFR2 enhances EPO-mediated effects exclusively in cells expressing both receptors, this approach may have advantages over erythropoiesis-stimulating agents in the treatment of other anemias.
Introduction
β-thalassemias are autosomal-recessive disorders caused by β-globin gene mutations resulting in defective hemoglobin synthesis and α-globin excess. The unbalanced synthesis between normal α- and reduced/absent β-globin chains is the pathogenic clue of the disease and causes massive expansion of the immature erythroid precursors.1 The balance between erythroid progenitor proliferation and erythroid precursor differentiation is subverted: the early erythroid cell pool is abnormally expanded, whereas maturation of erythroblasts is defective2 because of increased apoptosis.3
Erythropoiesis is governed by erythropoietin (EPO), a hormone primarily produced by the kidney. EPO levels, stimulated by hypoxia, are high in β-thalassemia. EPO binding to its receptor (EPOR) on the surface of erythroid precursors activates the JAK2/STAT5-signaling pathway and the transcription of several genes involved in proliferation, differentiation, and survival.4-10 Despite high EPO levels, since the globin defect, erythroid differentiation is blocked in β-thalassemia and the resulting hallmarks of the disease are ineffective erythropoiesis (IE) and anemia. Because of the expanded erythropoiesis, the increased erythroid regulator erythroferrone (ERFE)11,12 suppresses hepcidin and causes iron overload.
Current treatment of β-thalassemia is based on lifelong blood transfusions and iron chelation, a costly, demanding and far from optimal treatment accessible to only a minority of patients worldwide. A subset of patients not requiring transfusions (thalassemia intermedia) suffers from multiple morbidities and secondary iron overload.13,14 The only curative approach for the most severe forms of β-thalassemia is allogeneic bone marrow (BM) transplantation (BMT), an approach limited by the availability of HLA-matched donors and the risk of graft-versus-host disease.15 Clinical trials of gene therapy are in progress with encouraging results16,17 ; however, gene therapy will likely become available to a minority of patients. There is a great interest in developing novel treatments that target IE, improving erythroid maturation and controlling iron overload. The most promising are activin ligand traps, molecules that inhibit the transforming growth factor-β pathway18,19 now in a phase 3 clinical trial.20,21 Other approaches aimed at increasing the iron hormone hepcidin, restricting iron for erythropoiesis as the use of hepcidin/minihepcidins,22,23 transferrin,24,25 and inhibitors of the protease TMPRSS626-30 have been tested with beneficial effects mainly in models of thalassemia intermedia. Defining the molecular mechanism of these novel compounds and exploiting potential combinations is a therapeutic challenge for the future.
We recently identified transferrin (TF) receptor 2 (TFR2), a sensor of circulating TF-bound iron, as a regulator of erythropoiesis. TFR2 is a transmembrane protein, mainly expressed in hepatocytes and erythroid cells. Hepatic TFR2 induces hepcidin transcription in response to increased circulating iron31-33 and, although the molecular mechanisms remain to be clarified, TFR2 mutations cause hemochromatosis type 3.31
In erythroid precursors, TFR2 associates with EPOR in the endoplasmic reticulum.34 Both in hepatic and erythroid cells, TFR2 is stabilized on the cell membrane by diferric transferrin35,36 ; as a sensor of circulating iron, TFR2 adjusts both hepcidin and red cell production to the available iron.37,38 Understanding the erythroid TFR2 function started from the intriguing finding that, when challenged with iron deficiency, Tfr2−/− mice developed erythrocytosis, whereas animals with hepatic-specific Tfr2 deletion did not.39 We confirmed the hypothesis that erythrocytosis in Tfr2−/− animals was determined by the loss of erythroid Tfr2 by generating mice with BM-specific inactivation of Tfr2 (Tfr2BMKO mice). These mice showed erythrocytosis, increased EPO sensitivity of erythroid cells, and a reduced apoptosis rate of late erythroblasts mimicking mild iron deficiency.40
Altogether, these results led us to conclude that TFR2 might be a novel therapeutic target for the treatment of β-thalassemia. We speculate that loss of Tfr2 in thalassemia intermedia may both enhance erythroid precursor survival and mimic iron deficiency, a condition reported to partially correct the β-thalassemia phenotype.22,26-30,41 To verify this hypothesis, we used the Hbbth3/+ murine model of thalassemia intermedia, generated mice lacking Tfr2 in the whole body or in BM and demonstrated a long-lasting amelioration of the phenotype in both cases.
Methods
Mouse models and BMT
Hbbth3/+ mice (with heterozygous deletion of β1 and β2 genes)42 on a pure C57BL/6N background (The Jackson Laboratory, Bar Harbor, ME) and Tfr2−/− mice on a pure 129S2 background33 were crossed obtaining Tfr2+/− and Tfr2+/−/Hbbth3/+ progenies on a mixed C57/129S2 background; these animals were backcrossed generating Tfr2−/−/Hbbth3/+, Tfr2+/−/Hbbth3/+, and Hbbth3/+ mice. Mice were fed a standard diet; blood was collected by tail-vein puncture for hematological analyses at 4, 10, 15, 20, 25, 29, 33, and 37 weeks of age from both sex animals. A cohort of animals was euthanized at 10 weeks, another at 37 weeks of age. At euthanization, blood was collected for transferrin saturation (TS) determination; liver and spleen were weighed and dried for iron quantification.
BM cells isolated from a subset of 10-week-old Tfr2−/−/Hbbth3/+ and Hbbth3/+ male mice were used for BMT, as described (Nai et al40 ; supplemental Methods, available on the Blood Web site). Transplanted mice were fed a standard diet until 9 weeks after BMT when a cohort of animals was euthanized. A second cohort was fed an iron-deficient (ID) (<3 mg/kg carbonyl iron; SAFE, Augy, France) or iron-balanced (IB) (200 mg/kg carbonyl iron; SAFE) diet starting 9 weeks until 22 weeks after BMT. Blood was collected for hematological analyses every 4 weeks. At euthanization, animals were analyzed as previously described. In addition, serum EPO and ERFE (courtesy of Tom Ganz and Elizabeta Nemeth, University of California Los Angeles, Los Angeles, CA) were measured. Liver, spleen, kidneys, and heart were weighed, dissected, and snap-frozen immediately for RNA analysis, dried for tissue iron quantification, or processed for fluorescence-activated cell sorter (FACS) analysis. BM cells were harvested and processed for FACS or RNA analysis.
All mice were maintained in the animal facility of San Raffaele Institute in accordance with the European Union guidelines. The study was approved by the institutional animal care and use committee of the San Raffaele Institute.
Hematological analysis, flow cytometry, and tissue iron quantification
Quantitative RT-PCR
Quantitative reverse transcription–polymerase chain reaction (RT-PCR) was performed by standard methods (supplemental Methods).
RNAseq analysis
RNA was prepared by standard methods (supplemental Methods). Strand-specific RNA sequencing (RNAseq) library preparation was performed with the Illumina Stranded Truseq mRNA kit (Illumina, San Diego, CA). Libraries were multiplexed and run in paired-end mode on an Illumina Nextseq 500 platform (read length, 80 bases). Fastq files were demultiplexed, checked for quality control using the FastQC program, and mapped against the mm10 mouse genome with the STAR package to generate bam files. Reads were annotated against the GRCm38.p5 reference gene set (Ensembl) and counted using the summarizeOverlaps function of the GenomicAlignments package (Bioconductor). Differentially expressed genes were obtained with the Deseq2 package43 using the independent hypothesis weighting function of the IHW package for false discovery rate (FDR) calculation.44 Genes with FDR <10% and with log2 fold change less than −0.5 (downregulated) or more than +0.5 (upregulated) were used for GOterm analysis with the topGO package (Bioconductor). Canonical pathways were investigated based on the log2 fold change of the entire gene set using the gene set enrichment analysis (GSEA) package (Broad Institute).
The RNAseq fastq file can be obtained from the Arrayexpress platform under the accession number E-MTAB-6606 (https://www.ebi.ac.uk/arrayexpress/experiments/e-mtab-6606/).
Statistics
Data are presented as mean plus or minus standard error (SE). The unpaired 2-tailed Student t test was performed using GraphPad Prism 5.0 (GraphPad). P < .05 was considered statistically significant.
Results
Deletion of erythroid Tfr2 induces a sustained amelioration of anemia in Hbbth3/+ mice
To investigate whether Tfr2 loss ameliorates the thalassemic phenotype, to overcome any possible interference of iron-loading typical of Tfr2−/− mice, we developed a model of specific Tfr2 inactivation in BM cells of Hbbth3/+ animals, which fully recapitulates the characteristics of β-thalassemia intermedia in humans42 .
Lethally irradiated wild-type (wt) mice were transplanted with BM cells from Hbbth3/+ or Tfr2−/−/Hbbth3/+ donor mice coisogenic for the allelic form of the CD45 antigen. Engraftment of donor cells was almost complete both in the BM and in the spleen (supplemental Figure 1). Hemoglobin (Hb) levels and red blood cell (RBC) count are stable over time in Hbbth3/+ mice. A consistent and persistent increase of RBC count (Figure 1A) and Hb levels (Figure 1B) is observed in thalassemic mice lacking BM Tfr2 (Tfr2BMKO/Hbbth3/+). This occurs in the presence of a further decrease of both erythrocyte indexes, mean corpuscular volume (MCV; Figure 1C), and mean corpuscular hemoglobin (MCH; Figure 1D), indicating iron-restricted erythropoiesis. Only at ∼22 weeks after BMT does the improvement fade in double mutants: Hb and MCV levels return comparable to values of Hbbth3/+ mice. However, in Tfr2BMKO/Hbbth3/+ mice, RBC count persists higher and MCH levels lower than in thalassemic controls, even if MCH also drops at this time point in Hbbth3/+ animals.

Hematological parameters of Hbbth3/+mice with BM-specific deletion of Tfr2. The hematological parameters of mice were analyzed monthly from 9 to 22 weeks after transplantation with a thalassemic (Hbbth3/+) or a Tfr2−/−/Hbbth3/+ (Tfr2BMKO/Hbbth3/+) BM. Mice were fed a standard diet. In the figure are graphed: (A) RBC; (B) Hb; (C) MCV; and (D) MCH. Mean values of 6 to 8 animals for genotype are graphed. The dotted red line indicates mean value in wt mice.40 Error bars indicate SE. Asterisks refer to statistically significant differences between age-matched Hbbth3/+ and Tfr2BMKO/Hbbth3/+ mice: *P < .05; **P < .01; ***P < .005.
Hematological parameters of Hbbth3/+mice with BM-specific deletion of Tfr2. The hematological parameters of mice were analyzed monthly from 9 to 22 weeks after transplantation with a thalassemic (Hbbth3/+) or a Tfr2−/−/Hbbth3/+ (Tfr2BMKO/Hbbth3/+) BM. Mice were fed a standard diet. In the figure are graphed: (A) RBC; (B) Hb; (C) MCV; and (D) MCH. Mean values of 6 to 8 animals for genotype are graphed. The dotted red line indicates mean value in wt mice.40 Error bars indicate SE. Asterisks refer to statistically significant differences between age-matched Hbbth3/+ and Tfr2BMKO/Hbbth3/+ mice: *P < .05; **P < .01; ***P < .005.
Overall, these results demonstrate that deletion of erythroid Tfr2 induces a sustained amelioration of anemia in thalassemic mice, although loss of the beneficial effect on Hb levels occurs long-term.
Tfr2BMKO/Hbbth3/+ mice show improved erythropoiesis and reduced iron accumulation
To assess whether the loss of Tfr2 in Hbbth3/+ mice improves IE, we evaluated the erythroid differentiation (Figure 2A) in Tfr2BMKO/Hbbth3/+ and Hbbth3/+ animals at both 9 and 22 weeks after BMT. At 9 weeks, the erythropoiesis of Hbbth3/+ mice is highly compromised (Figure 2B-D), whereas it is moderately improved by the absence of BM Tfr2, as shown by the reduced percentage of circulating reticulocytes (Figure 2D). Twenty-two weeks after BMT, double mutants show a further erythropoiesis improvement, with reduced percentage of circulating reticulocytes (Figure 2D) and of stage IV (orthochromatic erythroblasts-reticulocytes) both in BM and spleen, increased stage V cells (mature RBCs) in the BM (Figure 2C), and amelioration of RBC morphology (Figure 2B). This erythropoietic improvement likely maintains the RBC count high despite the initial reduction of Hb levels. The amelioration of anemia and erythropoiesis in double mutants is accompanied by the expected reduction of serum EPO levels at both time points (Figure 2E). Surprisingly, despite this improvement, the percentage of Ter119+ cells and the spleen sizes are unchanged in double mutant mice at both time points (Figure 2F).
![Figure 2. Analysis of erythropoiesis and serum EPO and ERFE levels of Tfr2BMKO /Hbbth3/+ mice. Mice were analyzed 9 and 22 weeks after transplantation with thalassemic (Tfr2wt/Hbbth3/+) or Tfr2−/−/Hbbth3/+ (Tfr2BMKO/Hbbth3/+) BM. Mice were fed a standard diet. In the figure are graphed: (A) representative gating strategy for analysis of Ter119 subpopulations in Hbbth3/+ and Tfr2BMKO/Hbbth3/+ mice. Viable cells (impermeable to propidium iodide [PI]) from BM were analyzed for Ter119/CD44 expression. Ter119 were gated and further analyzed with respect to forward scatter (FSC) and CD44 surface expression for subpopulation composition (gated clusters: proerythroblasts [I], basophilic erythroblasts [II], polychromatic erythroblasts [III], orthochromatic erythroblasts and immature reticulocytes [IV], and mature red cells [V]); (B) blood smears stained with May-Grunwald-Giemsa showing the morphology of RBCs of representative Hbbth3/+ and Tfr2BMKO/Hbbth3/+ mice (original magnification ×40); (C) percentage of Ter119+ cells on alive cells and subpopulation composition (gated cluster I-V) based on Ter119/CD44 expression and FSC (reflecting cell size) both in the BM and in the spleen; (D) percentage of reticulocytes in peripheral blood; (E) serum EPO levels; (F) spleen weight normalized to body weight and (G) serum ERFE levels. Bars indicate SE. Asterisks refer to statistically significant differences between age-matched Hbbth3/+ and Tfr2BMKO/Hbbth3/+ mice: *P < .05; **P < .01; ***P < .005. FSC-A, forward scatter area; SSC-A, side scatter area.](https://ash.silverchair-cdn.com/ash/content_public/journal/blood/132/21/10.1182_blood-2018-05-852277/7/m_blood852277f2.png?Expires=1767726411&Signature=y2B1aLV12LIq2pdtTi3JW1KuIr30gde1Q7qPPxqPI9GJXDM1xiKHVbhNMYEi2ZGHTKjYE~RJTzydImdM73wRWBIpw7qgIJ9SrxbrERTe2jdJrtG16n9XIWY8XIXBBLsoa1LgyVqoGSwZyv~fk4wmjI1JpS5fHwJ4vAfa1oG8vT6maekQV554PD3UJVAVcNEJTyMoqpogLhNlmc2At55L2xg~2YlHHP5rDjYUDs1JRyG9OVtM47bc6HNO1eFOu8o3RFfNvu01ZVwjEmgQPTfdcCmCVycu3jnfBoBrrVDFdixrQ9lt-tpnXLWEwp9~2kADZTkBsX5t5YuqzP5mQbTfyQ__&Key-Pair-Id=APKAIE5G5CRDK6RD3PGA)
Analysis of erythropoiesis and serum EPO and ERFE levels of Tfr2BMKO/Hbbth3/+mice. Mice were analyzed 9 and 22 weeks after transplantation with thalassemic (Tfr2wt/Hbbth3/+) or Tfr2−/−/Hbbth3/+ (Tfr2BMKO/Hbbth3/+) BM. Mice were fed a standard diet. In the figure are graphed: (A) representative gating strategy for analysis of Ter119 subpopulations in Hbbth3/+ and Tfr2BMKO/Hbbth3/+ mice. Viable cells (impermeable to propidium iodide [PI]) from BM were analyzed for Ter119/CD44 expression. Ter119 were gated and further analyzed with respect to forward scatter (FSC) and CD44 surface expression for subpopulation composition (gated clusters: proerythroblasts [I], basophilic erythroblasts [II], polychromatic erythroblasts [III], orthochromatic erythroblasts and immature reticulocytes [IV], and mature red cells [V]); (B) blood smears stained with May-Grunwald-Giemsa showing the morphology of RBCs of representative Hbbth3/+ and Tfr2BMKO/Hbbth3/+ mice (original magnification ×40); (C) percentage of Ter119+ cells on alive cells and subpopulation composition (gated cluster I-V) based on Ter119/CD44 expression and FSC (reflecting cell size) both in the BM and in the spleen; (D) percentage of reticulocytes in peripheral blood; (E) serum EPO levels; (F) spleen weight normalized to body weight and (G) serum ERFE levels. Bars indicate SE. Asterisks refer to statistically significant differences between age-matched Hbbth3/+ and Tfr2BMKO/Hbbth3/+ mice: *P < .05; **P < .01; ***P < .005. FSC-A, forward scatter area; SSC-A, side scatter area.
Analysis of erythropoiesis and serum EPO and ERFE levels of Tfr2BMKO/Hbbth3/+mice. Mice were analyzed 9 and 22 weeks after transplantation with thalassemic (Tfr2wt/Hbbth3/+) or Tfr2−/−/Hbbth3/+ (Tfr2BMKO/Hbbth3/+) BM. Mice were fed a standard diet. In the figure are graphed: (A) representative gating strategy for analysis of Ter119 subpopulations in Hbbth3/+ and Tfr2BMKO/Hbbth3/+ mice. Viable cells (impermeable to propidium iodide [PI]) from BM were analyzed for Ter119/CD44 expression. Ter119 were gated and further analyzed with respect to forward scatter (FSC) and CD44 surface expression for subpopulation composition (gated clusters: proerythroblasts [I], basophilic erythroblasts [II], polychromatic erythroblasts [III], orthochromatic erythroblasts and immature reticulocytes [IV], and mature red cells [V]); (B) blood smears stained with May-Grunwald-Giemsa showing the morphology of RBCs of representative Hbbth3/+ and Tfr2BMKO/Hbbth3/+ mice (original magnification ×40); (C) percentage of Ter119+ cells on alive cells and subpopulation composition (gated cluster I-V) based on Ter119/CD44 expression and FSC (reflecting cell size) both in the BM and in the spleen; (D) percentage of reticulocytes in peripheral blood; (E) serum EPO levels; (F) spleen weight normalized to body weight and (G) serum ERFE levels. Bars indicate SE. Asterisks refer to statistically significant differences between age-matched Hbbth3/+ and Tfr2BMKO/Hbbth3/+ mice: *P < .05; **P < .01; ***P < .005. FSC-A, forward scatter area; SSC-A, side scatter area.
In agreement with low EPO concentration, serum levels of the erythroid regulator ERFE,11 an EPO target gene, are reduced in Tfr2BMKO/Hbbth3/+ animals relative to Hbbth3/+ 9 weeks after BMT, whereas, despite lower EPO levels in Tfr2BMKO/Hbbth3/+ animals, they are comparable between the 2 genotypes at 22 weeks (Figure 2G).
TS is similar between the 2 groups at both time points (Table 1), but is significantly lower in older mice (Hbbth3/+ 22 vs 9 weeks: P < .001; Tfr2BMKO/Hbbth3/+ 22 vs 9 weeks: P < .05). Iron concentration in liver (LIC), spleen (SIC), kidney, and heart is as well comparable in thalassemic mice with or without erythroid Tfr2 9 weeks after BMT. However, deletion of erythroid Tfr2 prevents further iron accumulation with aging in liver and kidney. Consistent with LIC, hepatic hepcidin (Hamp) expression is unaffected by the lack of erythroid Tfr2 at 9 weeks and reduced at 22 weeks (Table 1). Notably, SIC is decreased to normal levels40 in Tfr2BMKO/Hbbth3/+ animals (Table 1).
Iron parameters of Tfr2BMKO/Hbbth3/+mice 9 and 22 weeks after BMT
| TS, % | LIC, μg/g | SIC, μg/g | KIC, μg/g | HIC, μg/g | Hamp −ΔCt | Hamp/LIC | ||
|---|---|---|---|---|---|---|---|---|
| 9 wk after BMT | Hbbth3/+ | 49.9 ± 4.5 | 529.2 ± 23.7 | 4039 ± 69 | 248.0 ± 29.3 | 229.2 ± 10.8 | 5.79 ± 0.12 | 1.01 ± 0.09 |
| Tfr2BMKO/Hbbth3/+ | 41.1 ± 2.3 | 530.8 ± 72.4 | 3981 ± 172 | 249.8 ± 23.8 | 215.7 ± 15.1 | 5.90 ± 0.24 | 1.18 ± 0.14 | |
| 22 wk after BMT | Hbbth3/+ | 31.1 ± 1.7 | 961.3 ± 98.2 | 7234 ± 779 | 401.3 ± 38.1 | 388.7 ± 19.4 | 5.03 ± 0.29 | 0.50 ± 0.05 |
| Tfr2BMKO/Hbbth3/+ | 30.3 ± 5.3 | 658.6 ± 83.0* | 2383 ± 647*** | 263.7 ± 21.4* | 382.9 ± 29.7 | 2.80 ± 0.96* | 0.31 ± 0.19 |
Mice were analyzed 9 and 22 weeks after transplantation with thalassemic (Hbbth3/+) or Tfr2−/−/Hbbth3/+ (Tfr2BMKO/Hbbth3/+) BM. Mice were fed a standard diet. The table reports: TS, LIC, SIC, KIC, HIC, and mRNA expression of hepcidin (Hamp) relative to Hprt1 and relative to LIC (Hamp/LIC). Mean values plus or minus SEs are indicated.
HIC, heart iron content; Hprt1, hypoxanthine phosphoribosyltransferase 1; KIC, kidney iron content; mRNA, messenger RNA.
Asterisks refer to statistically significant differences between age-matched Tfr2BMKO/Hbbth3/+ and Hbbth3/+ mice: *P < .05; ***P < .005.
Overall, these results suggest that increased Hb levels in double mutant mice are accompanied by a more effective erythropoiesis and are not due to, but are the cause of, the reduced iron accumulation observed.
The EPO-EPOR–signaling pathway is overactive in erythroid precursors of Tfr2BMKO/Hbbth3/+ mice
To elucidate the molecular mechanisms by which the genetic loss of Tfr2 ameliorates the thalassemic phenotype, we investigated whether the EPO-EPOR–signaling pathway is overactive as we reported in Tfr2-null erythroid cells.40 The expression levels of the EPOR-JAK2-STAT5 target genes Erfe11 (Figure 3A,D) and Bcl-xl4,5,8 (Figure 3B,E) are comparable in the 2 groups of mice 9 weeks after BMT both in BM and spleen, whereas they are slightly lower in the BM of Tfr2BMKO/Hbbth3/+ relative to Hbbth3/+ animals at 22 weeks. In parallel, Fasl, a proapoptotic molecule inhibited by the EPOR–phosphatidylinositol 3-kinase–AKT pathway,6 is significantly reduced in Tfr2BMKO/Hbbth3/+ mice at both time points (Figure 3C,F). Taking into account the remarkably lower serum EPO levels measured in Tfr2BMKO/Hbbth3/+ mice as compared with Hbbth3/+ controls (Figure 2C), these results are consistent with the EPO-EPOR pathways being activated by the loss of Tfr2 in thalassemia, as observed in wt cells.40
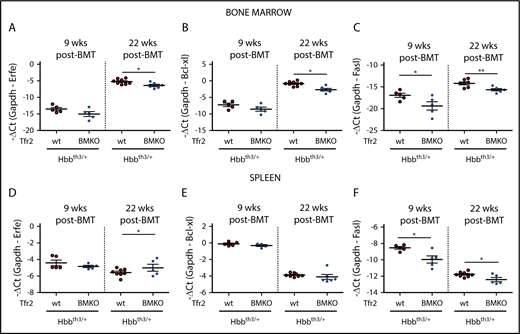
Analysis of EPO target genes in the BM and spleen of Tfr2BMKO/Hbbth3/+mice. The expression levels of EPO target genes were determined in BM cells (A-C) and spleen samples (D-F) from Hbbth3/+ and Tfr2BMKO/Hbbth3/+ mice 9 and 22 weeks after BMT. In the figure are graphed: messenger RNA (mRNA) expression of ERFE (Erfe, A,D), B-cell lymphoma–extra large (Bcl-xL; B,E), and Fas ligand (Fasl; C,F) relative to glyceraldehyde 3-phosphate dehydrogenase (Gapdh). Bars indicate SE. Asterisks refer to statistically significant differences between age-matched Hbbth3/+ and Tfr2BMKO/Hbbth3/+ mice: *P < .05; **P < .01. Ct, cycle threshold.
Analysis of EPO target genes in the BM and spleen of Tfr2BMKO/Hbbth3/+mice. The expression levels of EPO target genes were determined in BM cells (A-C) and spleen samples (D-F) from Hbbth3/+ and Tfr2BMKO/Hbbth3/+ mice 9 and 22 weeks after BMT. In the figure are graphed: messenger RNA (mRNA) expression of ERFE (Erfe, A,D), B-cell lymphoma–extra large (Bcl-xL; B,E), and Fas ligand (Fasl; C,F) relative to glyceraldehyde 3-phosphate dehydrogenase (Gapdh). Bars indicate SE. Asterisks refer to statistically significant differences between age-matched Hbbth3/+ and Tfr2BMKO/Hbbth3/+ mice: *P < .05; **P < .01. Ct, cycle threshold.
Transcription of genes of cell proliferation, mitochondrial activity, and oxidative stress response is enhanced in Tfr2BMKO/Hbbth3/+ mice
To obtain a global view of cellular processes that explain the remarkable amelioration of the phenotype in Tfr2BMKO/Hbbth3/+ mice, we evaluated how the transcriptome is modulated by the absence of Tfr2. We performed RNAseq analysis on spleen samples from double mutant mice and Hbbth3/+ controls at 22 weeks after BMT, a time point of maximal amelioration of Tfr2BMKO/Hbbth3/+ erythropoiesis. For RNAseq experiments, we chose spleen tissue because of the high erythropoietic content, similar in the 2 genotypes (with ∼80% of Ter119+ erythroid cells).
Principal component analysis of the transcription profile of single samples shows a distinct clustering into 2 groups, which correspond to the 2 genotypes (supplemental Figure 2A). In total, we identified 2796 genes differentially regulated between the 2 genotypes (supplemental Figure 2B; supplemental Data File 1). Among them, 1997 are protein coding. The expression levels of a large number of EPO target genes45 are comparable between Hbbth3/+ and Tfr2BMKO/Hbbth3/+ mice (supplemental Data File 1), confirmed by real-time PCR. Analysis of iron-related genes reveals a strong reduction of the expression of the iron exporter ferroportin (Slc40a1), of heme oxygenase 1 (Hmox1), and of δ-aminolevulinate synthase 2 (Alas2) (supplemental Figure 2C). Genes upregulated in the spleen of Tfr2BMKO/Hbbth3/+ mice involve biological processes related to energy production (eg, cellular respiration, oxidative phosphorylation, mitochondrial respiratory chain complex assembly, adenosine triphosphate [ATP] metabolic process, respiratory electron transport chain), ribosome biogenesis and assembly, and translation. Genes downregulated span from leukocyte and lymphocyte proliferation and differentiation to lipid transport and catabolism (Figure 4; supplemental Data File 1). Gene ontology analysis of cellular component (supplemental Figure 3A; supplemental Data File 1) and molecular function (supplemental Figure 3B; supplemental Data File 1), as well as GSEA of the relative canonical pathways (supplemental Figure 3C; supplemental Data File 1), confirmed and extended an enrichment of genes involved in cell cycle, proliferation, mitochondrial function and localization, RNA binding, and ribosomal function as well as proteasome activity and an underrepresentation of genes involved in lipid and cholesterol handling, leukocyte/lymphocyte differentiation, and coagulation. In addition, most of the antioxidant and protective targets activated by the canonical NF-κB–signaling pathway,46 a recognized target of EPO-EPOR signaling,47 are overexpressed in spleen samples of double mutants as compared with thalassemic controls (Table 2).

RNAseq analysis of the spleen of Hbbth3/+and Tfr2BMKO/Hbbth3/+mice. (A) Gene ontology (GO) analysis relative to the biological function of the differentially expressed genes (FDR < 10% and log2 fold change less than −0.5 for the downregulated; FDR < 10% and log2 fold change > 0.5 for the upregulated) of Tfr2BMKO/Hbbth3/+ mice vs Hbbth3/+. (B) Heatmap representation of the differentially expressed genes belonging to the single biological processes represented in panel A.
RNAseq analysis of the spleen of Hbbth3/+and Tfr2BMKO/Hbbth3/+mice. (A) Gene ontology (GO) analysis relative to the biological function of the differentially expressed genes (FDR < 10% and log2 fold change less than −0.5 for the downregulated; FDR < 10% and log2 fold change > 0.5 for the upregulated) of Tfr2BMKO/Hbbth3/+ mice vs Hbbth3/+. (B) Heatmap representation of the differentially expressed genes belonging to the single biological processes represented in panel A.
Expression level of NF-κB target genes involved in ROS protection from RNAseq analysis of the spleen of Hbbth3/+and Tfr2BMKO/Hbbth3/+mice
| Gene name | Hbbth3/+ | Tfr2BMKO/Hbbth3/+ | P (DESeq2)* | padj (IHW)† |
|---|---|---|---|---|
| Sod2 (MnSOD) | 41.02 ± 0.73 | 51.43 ± 3.26 | .006551 | .056003 |
| Sod1 (CuZnSOD) | 1205.18 ± 100.71 | 1617.59 ± 98.45 | .005153 | .045185 |
| FtH1 | 5377.17 ± 414.93 | 6666.98 ± 593.60 | .030397 | .134317 |
| Txn1 | 627.74 ± 18.86 | 735.73 ± 80.39 | .054498 | .195756 |
| Txn2 | 74.12 ± 5.09 | 92.57 ± 3.54 | .014006 | .083579 |
| GSTp1 | 124.66 ± 11.92 | 171.08 ± 17.92 | .00604 | .059385 |
Data are indicated as median of the TPM plus or minus standard error of the mean.
FtH1, ferritin heavy chain 1; GSTp1, glutathione S-transferase P1; IHW, independent hypothesis weighting; padj, adjusted P value; ROS, reactive oxygen species; Sod, superoxide dismutase; TPM, transcripts per kilobase million; Txn, thioredoxin.
The P value has been calculated using the DESeq2 algorithm.
The adjusted P value has been obtained using the IHW correction.
In summary, transcriptomic data suggest a more pronounced erythroid commitment of cells lacking Tfr2, accompanied by increased activity of mitochondria and proteasome and sustained activation of the antioxidant response.
Iron deficiency improves erythropoiesis of Tfr2BMKO/Hbbth3/+ mice
To investigate whether iron deficiency has a further effect on the hematological phenotype of double mutant mice, a cohort of Tfr2BMKO/Hbbth3/+ and Hbbth3/+ animals was fed an ID diet for 13 weeks, starting 9 weeks after BMT. RBC count and Hb levels of Hbbth3/+ animals are moderately increased after 4 weeks of diet, likely because of ID-induced TFR2 removal from erythroid surface36 and then persist constant. Increased RBC count and Hb levels are noticed in Tfr2BMKO/Hbbth3/+ mice only from 17 weeks, when iron deficiency was likely achieved, reaching maximal levels at 21 weeks and starting to decline at 22 weeks (Figure 5A-B). Notwithstanding a mild reduction in the percentage of BM Ter119+ cells, the maturation pattern of erythroid cells of Tfr2BMKO/Hbbth3/+ mice analyzed at sacrifice appears significantly improved as compared with both Hbbth3/+ controls (Figure 5C) and to animals fed a standard diet (Figure 2A). This confirms that the corrective effect of restricting iron to thalassemic erythropoiesis41 also occurs in the absence of Tfr2.
![Figure 5. Hematological and iron phenotype of Hbbth3/+ mice with BM-specific deletion of Tfr2 fed an ID diet. Hbbth3/+ and Tfr2BMKO/Hbbth3/+ mice were fed an ID diet (<3 mg/kg carbonyl iron; SAFE) starting 9 weeks after transplantation until sacrifice 22 weeks after BMT. Complete blood count was analyzed monthly, whereas a more complete phenotypic analysis of mice was performed at sacrifice. In the figure are graphed: (A) RBC number; (B) Hb levels; (C) percentage of Ter119+ cells on alive cells and subpopulation composition (gated clusters: proerythroblasts [I], basophilic erythroblasts [II], polychromatic erythroblasts [III], orthochromatic erythroblasts and immature reticulocytes [IV], and mature red cells [V]) based on Ter119/CD44 expression and forward scatter (reflecting cell size) both in the BM and in the spleen; (D) TS; (E) LIC and (F) SIC. The dotted red line indicates mean value in wt IB mice.40 Bars indicate SE. Asterisks refer to statistically significant differences between age-matched Hbbth3/+ and Tfr2BMKO/Hbbth3/+ mice: *P < .05; **P < .01; ***P < .005.](https://ash.silverchair-cdn.com/ash/content_public/journal/blood/132/21/10.1182_blood-2018-05-852277/7/m_blood852277f5.png?Expires=1767726411&Signature=CIXx4k3sTtdKq2R6Rf6mi8GSKivzfB3r44XpoQMlDJKiw7Qukm39qiInytee2FDvEhqQp0xhT4cVGxC2J0U-UrKGLl5lgEKozmoLdJTKMYeFLuPtEWfoNh~nkxO3uxrI7wqs70LVeC3G5QtbleIYRgYFI8YYdx-UZyM5WICgvMK8SFInMGQsKzZthJJBjtFjPbgac8ezzsllrWA4inv1Xvn3V~BcWeeGFQQ7fGQIKWaLrMEjTWe56oFi-A05GwPKYjSHf4sjOu92RZE3c-NB5Y92TXy~GI2xEjC7cXEo7TKw1cTZ~jdkisJisbeAK8x~2ZSu0R9Wp-toVtEeRw~A8w__&Key-Pair-Id=APKAIE5G5CRDK6RD3PGA)
Hematological and iron phenotype of Hbbth3/+mice with BM-specific deletion of Tfr2 fed an ID diet.Hbbth3/+ and Tfr2BMKO/Hbbth3/+ mice were fed an ID diet (<3 mg/kg carbonyl iron; SAFE) starting 9 weeks after transplantation until sacrifice 22 weeks after BMT. Complete blood count was analyzed monthly, whereas a more complete phenotypic analysis of mice was performed at sacrifice. In the figure are graphed: (A) RBC number; (B) Hb levels; (C) percentage of Ter119+ cells on alive cells and subpopulation composition (gated clusters: proerythroblasts [I], basophilic erythroblasts [II], polychromatic erythroblasts [III], orthochromatic erythroblasts and immature reticulocytes [IV], and mature red cells [V]) based on Ter119/CD44 expression and forward scatter (reflecting cell size) both in the BM and in the spleen; (D) TS; (E) LIC and (F) SIC. The dotted red line indicates mean value in wt IB mice.40 Bars indicate SE. Asterisks refer to statistically significant differences between age-matched Hbbth3/+ and Tfr2BMKO/Hbbth3/+ mice: *P < .05; **P < .01; ***P < .005.
Hematological and iron phenotype of Hbbth3/+mice with BM-specific deletion of Tfr2 fed an ID diet.Hbbth3/+ and Tfr2BMKO/Hbbth3/+ mice were fed an ID diet (<3 mg/kg carbonyl iron; SAFE) starting 9 weeks after transplantation until sacrifice 22 weeks after BMT. Complete blood count was analyzed monthly, whereas a more complete phenotypic analysis of mice was performed at sacrifice. In the figure are graphed: (A) RBC number; (B) Hb levels; (C) percentage of Ter119+ cells on alive cells and subpopulation composition (gated clusters: proerythroblasts [I], basophilic erythroblasts [II], polychromatic erythroblasts [III], orthochromatic erythroblasts and immature reticulocytes [IV], and mature red cells [V]) based on Ter119/CD44 expression and forward scatter (reflecting cell size) both in the BM and in the spleen; (D) TS; (E) LIC and (F) SIC. The dotted red line indicates mean value in wt IB mice.40 Bars indicate SE. Asterisks refer to statistically significant differences between age-matched Hbbth3/+ and Tfr2BMKO/Hbbth3/+ mice: *P < .05; **P < .01; ***P < .005.
The iron-poor diet significantly decreases TS in both groups of mice as compared with wt IB animals (Figure 5D) and completely prevents iron loading. Indeed, LIC (Figure 5E) of both Hbbth3/+ and Tfr2BMKO/Hbbth3/+ mice and SIC (Figure 5F) of Hbbth3/+ overlap the mean values of wt mice. Interestingly, SIC of Tfr2BMKO/Hbbth3/+ is even lower than in wt40 (Figure 5F), indicating exhaustion of spleen iron stores, likely due to an increased iron consumption by the enhanced erythropoiesis.
Germ line deletion of one or both Tfr2 alleles ameliorates anemia of Hbbth3/+ mice
To confirm the role of TFR2 in β-thalassemia, and propose it as a therapeutic target, we verified whether germ line homozygous or heterozygous Tfr2 deletion also improves anemia in Hbbth3/+ animals. Both RBC number (Figure 6A; supplemental Figure 4A) and Hb levels (Figure 6B; supplemental Figure 4B) are increased in mice lacking Tfr2, an effect that, for Hb levels, is maintained for at least 29 weeks. Interestingly, a gene dosage effect is observed on Hb and RBC improvement. In contrast with results obtained in transplanted mice, MCV (Figure 6C; supplemental Figure 4C) and MCH (Figure 6D; supplemental Figure 4D) are comparable between Hbbth3/+ mice with both or a single Tfr2 allele, whereas MCV is increased in animals lacking both copies of Tfr2, likely because of their high iron burden. The improvement of the hematological phenotype occurs despite the expected severe iron overload of Tfr2−/−/Hbbth3/+ mice, which show higher LIC (Figure 6E) and TS (Figure 6F) than Hbbth3/+ mice. SIC is comparable between thalassemic mice with or without Tfr2 (Figure 6G). Approximately 60% of Tfr2−/−/Hbbth3/+ mice show decreased Hb at levels in the range of Hbbth3/+ controls when 37 weeks old; however, the phenotype improvement persists in all mice lacking 1 Tfr2 allele. These mice are characterized by a modest increase of TS (Figure 6F) relative to thalassemic controls, without alterations of LIC (Figure 6E) and SIC (Figure 6G) when 10 weeks old. In contrast, 37 week old Tfr2+/−/Hbbth3/+ mice have normal TS as Hbbth3/+ animals and slightly increased LIC.
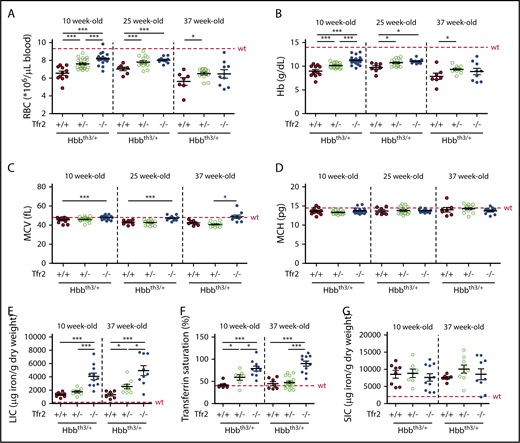
Hematological and iron parameters of Hbbth3/+mice with germ line deletion of Tfr2. Hematological parameters of both male and female Hbbth3/+ mice with wt Tfr2 (Tfr2+/+) or germ line ablation of a single allele (Tfr2+/−) or both alleles (Tfr2−/−) of Tfr2 determined at 10, 25, and 37 weeks of age; iron parameters were determined in a pool of 10- and 37-week-old Hbbth3/+, Tfr2+/−/Hbbth3/+, and Tfr2−/−/Hbbth3/+ mice. In the figure are graphed: (A) RBC count; (B) Hb levels; (C) MCV; (D) MCH; (E) LIC, (F) TS, and (G) SIC. The dotted red line indicates mean value in wt IB mice. Error bars indicate SE. Asterisks refer to statistically significant differences: *P < .05; **P < .01; ***P < .005.
Hematological and iron parameters of Hbbth3/+mice with germ line deletion of Tfr2. Hematological parameters of both male and female Hbbth3/+ mice with wt Tfr2 (Tfr2+/+) or germ line ablation of a single allele (Tfr2+/−) or both alleles (Tfr2−/−) of Tfr2 determined at 10, 25, and 37 weeks of age; iron parameters were determined in a pool of 10- and 37-week-old Hbbth3/+, Tfr2+/−/Hbbth3/+, and Tfr2−/−/Hbbth3/+ mice. In the figure are graphed: (A) RBC count; (B) Hb levels; (C) MCV; (D) MCH; (E) LIC, (F) TS, and (G) SIC. The dotted red line indicates mean value in wt IB mice. Error bars indicate SE. Asterisks refer to statistically significant differences: *P < .05; **P < .01; ***P < .005.
Overall, these results demonstrate that, irrespective of the iron loading, germ line Tfr2 deletion induces a long-lasting amelioration of anemia in thalassemic mice, indicating that the beneficial effect of Tfr2 loss is iron independent.
Discussion
Current treatments of β-thalassemia48 are unsatisfactory or unavailable worldwide1 ; thus, the search for novel targeted therapies is a clinical need. Here, we show that the genetic loss of Tfr2 results in a long-lasting improvement of anemia due to more efficient erythropoiesis in the Hbbth3/+ mouse model. This benefit persists at least up to 5 months in animals lacking Tfr2 both ubiquitously and selectively in the BM, making TFR2 (especially erythroid TFR2) a novel therapeutic target for β-thalassemia. We ascribe the positive effect to erythroid Tfr2 deletion; however, we cannot exclude a contribution of Tfr2 deletion in other BM-derived cells as macrophages, although phenotype alterations have not been reported in selective inactivation of macrophage Tfr2.49
The improved erythropoiesis increases iron utilization at degrees that may become counterproductive because depletion of spleen stores causes excessive iron restriction, neutralizing the benefit. This side effect, also suggested by TS reduction over time, strengthens the need to monitor body iron according to the degree of Tfr2 inactivation.
We observed a gene dosage effect of germ line Tfr2 deletion: Tfr2-haploinsufficient thalassemic animals maintain higher Hb levels until 37 weeks old, whereas their iron phenotype is comparable to thalassemic controls. In contrast, Hb levels of (germinal) Tfr2−/−-thalassemic mice deteriorate over time, in parallel with iron overload. These observations suggest that even a partial inhibition of the receptor might ameliorate the thalassemic phenotype without substantially altering systemic iron homeostasis.
Surprisingly, despite the hematological improvement, spleen size remains unchanged in double mutant mice. This is consistent with the positive effect on splenomegaly, with negligible improvement of anemia observed with JAK2 inhibitor treatment of both thalassemic mice50 and patients.51
To unequivocally elucidate the pathway/s altered by the loss of Tfr2, we performed RNAseq analysis on spleen samples at a time of maximally improved erythropoiesis in double mutants.
We found that Tfr2 deletion activates signaling pathways involved in cell proliferation (ribosomal proteins, RNApolimerase, cell cycle), mitochondrial activity, proteasome function, and antioxidant response, while reducing coagulation, leukocyte/lymphocyte proliferation and differentiation, and lipid metabolism pathways. This analysis is compatible with increased sensitivity of Tfr2-deficient erythropoiesis to EPO stimulation, as observed in wt mice.40 The RNAseq patterns indicate an increased erythroid commitment and a mitochondrial metabolic switch. Interestingly, a metabolic shift occurs during hematopoiesis with the induction of mitochondrial activity, which sustains proliferation and differentiation of erythroid cells.52,53 EPO directly stimulates the metabolic activity and mitochondrial gene expression in adipocytes,54 and we speculate that an analogous effect is also induced in erythroid cells. Another contributor to the improved differentiation is increased proteasome activity because proteasomal degradation is required for enucleation of erythroblasts to form mature erythrocytes55-57 and improved enucleation ameliorates the thalassemic phenotype following iron restriction.25 Finally, the activation of the NF-κB antioxidant response46 may control ineffective erythropoiesis because reactive oxygen species increased in ineffective erythropoiesis of thalassemia58 and may contribute to transcriptional downregulation of Fasl.59 Of note, NF-κB activation is reported secondary to EPO effect.47 Thus, based both on RT-PCR of EPO target genes and RNAseq findings, and considering the low EPO levels of Tfr2BMKO/Hbbth3/+ mice, we conclude that the EPO pathway is more active in these animals than in thalassemic controls.
The analysis of iron-related genes showed decreased expression of Fpn, Hmox1, and Alas2, genes that respond to iron, oxidative stress, and heme. Their downregulation could be secondary to decreased hemolysis and/or free heme accumulation in thalassemic cells or to the reduced splenic iron.60,61 Indeed, because of the spleen iron reduction of aged Tfr2BMKO/Hbbth3/+, we cannot formally exclude a contribution of iron deficiency to the transcriptional modifications observed.
Recent in vitro findings demonstrate that the iron-mediated lysosomal trafficking of TFR2 controls EPOR surface expression and activity through quantitative variations of Scribble,62,63 a scaffold protein involved in receptors trafficking and cell polarization.64-66 In the absence of Tfr2, Scribble would be stabilized increasing surface EPOR, upregulating JAK2-STAT5, while inhibiting AKT signaling.67 In our model, both pathways seems to be enhanced in the absence of Tfr2. However, Scribble correct localization is important to regulate AKT signaling because when mislocalized, Scribble activates the AKT–mammalian target of rapamycin pathway.68 Additional studies are required to clarify this point.
As in wt mice,40 in the thalassemic model, deletion of erythroid Tfr2 does not directly modulate iron homeostasis: 9 weeks after BMT, iron accumulation is not prevented, but further iron overload is precluded in double mutant mice over time. These results suggest that the thalassemia amelioration driven by the lack of erythroid Tfr2 is not due to a reduction of available iron. We propose that the more effective erythropoiesis mobilizes iron, especially from the spleen, a major site of erythropoiesis in mice. This process would require hepcidin suppression that apparently does not occur. Nine weeks after BMT, hepcidin levels are similar in the 2 groups of mice, whereas at 22 weeks, they are slightly decreased in Tfr2BMKO/Hbbth3/+ mice. However, considering the lower degree of anemia (and hypoxia) as compared with thalassemic controls, hepcidin levels are inappropriately low and Erfe levels inappropriately high in the double mutants. As observed in wt animals, genetic loss of Tfr2 resets iron homeostasis in favor of iron recycling and absorption to meet the requirement of the increased erythropoiesis.
The strong reduction of spleen iron may explain the mild Hb decrease observed in Tfr2BMKO/Hbbth3/+ mice at 22 weeks, despite improved erythropoiesis. Overall, our findings strengthen the need for adequate iron availability for erythropoietic activity.
Despite the impressive systemic iron overload of Tfr2−/−/Hbbth3/+ mice, their hematological phenotype is significantly and persistently improved, suggesting that iron overload is not a major determinant of anemia in thalassemic mice. In line with this assumption, exacerbation of iron overload through iron dextran in thalassemia was even associated with increased Hb in 1 study.69 In contrast, iron depletion induced by a prolonged ID diet induces only a transient modest improvement of Hb in both groups of mice.
In conclusion, erythroid TFR2 appears to be an attractive therapeutic target to potentiate erythropoiesis in β-thalassemia; our findings on Tfr2-haploinsufficient thalassemic mice suggest that TFR2-specific targeting by antisense oligonucleotides or small interfering RNAs could be proposed to ameliorate anemia in nontransfusion-dependent patients. Mechanistic studies aimed at characterizing the TFR2-EPOR interaction may lead to the design of interfering molecules, mimicking an erythroid-specific TFR2 depletion. Finally, targeting TFR2 enhances EPO-mediated effects exclusively in erythroid cells, an advantage over erythropoiesis-stimulating agents. For this reason, it might become an option for other disorders, characterized by anemia and/or ineffective erythropoiesis.
The online version of this article contains a data supplement.
The publication costs of this article were defrayed in part by page charge payment. Therefore, and solely to indicate this fact, this article is hereby marked “advertisement” in accordance with 18 USC section 1734.
Acknowledgments
The authors thank Tomas Ganz and Elizabeta Nemeth (University of California, Los Angeles, Los Angeles, CA) for murine serum erythroferrone measurement.
This work was supported in part by the Cooley’s Anemia Foundation (Research Fellowship), the Cariplo Foundation (“Young Investigator” grant no. 2017-0916), and the European Hematology Association (Josè-Carreras Junior Research fellowship) (A.N.); by the European Hematology Association (Advanced Research fellowship) (S.A.); and by the Telethon Foundation (SR-TIGET Core Grant) (G.F.).
Authorship
Contribution: I.A. and M.R.L. performed experiments, analyzed data, and contributed to the writing of the manuscript; S.A., G.M., and M.P. performed research and analyzed data; M.U.M. contributed to the writing of the paper; L.S. and G.F. contributed to the experimental design, data analysis, and manuscript writing; C.C. conceived the experiments and critically reviewed the paper; A.N. designed and performed research, analyzed data, and wrote the manuscript; and all authors approved the final version of the manuscript.
Conflict-of-interest disclosure: C.C. is an advisor of Vifor Iron Core and received honoraria from Vifor Pharma. A.N., L.S., and C.C. have filed a patent application (US provisional no. 62/483 172) on the results presented in the paper. The remaining authors declare no competing financial interests.
The current affiliation for I.A. is Department of Biotechnology and Biosciences, University of Milano-Bicocca, Milan, Italy.
Correspondence: Antonella Nai, San Raffaele Scientific Institute and Vita-Salute San Raffaele University, Via Olgettina, 58, 20132 Milan, Italy; e-mail: nai.antonella@hsr.it; and Clara Camaschella, San Raffaele Scientific Institute, Via Olgettina, 58, 20132 Milan, Italy; e-mail: camaschella.clara@hsr.it.

This feature is available to Subscribers Only
Sign In or Create an Account Close Modal