

Key Points
Wt1 heterozygous loss enhanced stem cell self-renewal in an age-dependent manner.
Wt1-haploinsufficient leukemias require additional events to promote hematopoietic transformation.

Abstract
Genetic studies have identified recurrent somatic mutations in acute myeloid leukemia (AML) patients, including in the Wilms’ tumor 1 (WT1) gene. The molecular mechanisms by which WT1 mutations contribute to leukemogenesis have not yet been fully elucidated. We investigated the role of Wt1 gene dosage in steady-state and pathologic hematopoiesis. Wt1 heterozygous loss enhanced stem cell self-renewal in an age-dependent manner, which increased stem cell function over time and resulted in age-dependent leukemic transformation. Wt1-haploinsufficient leukemias were characterized by progressive genetic and epigenetic alterations, including those in known leukemia-associated alleles, demonstrating a requirement for additional events to promote hematopoietic transformation. Consistent with this observation, we found that Wt1 depletion cooperates with Flt3-ITD mutation to induce fully penetrant AML. Our studies provide insight into mechanisms of Wt1-loss leukemogenesis and into the evolutionary events required to induce transformation of Wt1-haploinsufficient stem/progenitor cells.
Introduction
Wilms’ tumor 1 (WT1) was first identified as a predisposition gene for Wilms’ tumor,1,2 functioning as a tumor suppressor with loss-of-function mutations in ∼15% of sporadic Wilms’ tumor cases.3,4 Oncogenic roles for WT1 have been proposed in other contexts, including breast,5 ovarian,6 and lung carcinomas.7,8 In hematologic malignancies, WT1 is targeted by somatic mutations in ∼6% to 15% of cases of de novo acute myeloid leukemia (AML).9-12 These include heterozygous base substitution, deletion, and insertion mutations primarily targeting exons 1, 7, and 910,13 and typically leading to premature stop codons and frame shifts that result in loss of function and expression of a truncated protein.10,14 A similar mutational spectrum was found in pediatric AML15 and T-cell acute lymphoblastic leukemia (T-ALL).16 Overexpression of WT1 has also been observed in AML and has been implicated in leukemogenesis,9 further complicating the understanding of how WT1 expression may contribute to tumorigenesis. In de novo adult AML, WT1 mutations are associated with younger age, worsened overall survival, relapse-free survival,13,17,18 and resistance to chemotherapy18 and are often concurrently mutated with FLT3-ITD or CEBPA.19,20 A similar co-occurrence with FLT3-ITD was identified in pediatric AML, leading to worse overall survival than the presence of either mutation alone.15 In T-ALL, WT1 mutations can co-occur with NOTCH1 mutations and are enriched at the time of relapse.16 The role that WT1 mutations play in disease development and how they cooperate with co-occurring genes to promote leukemic transformation remain to be determined.
Murine models have been generated to investigate the role of Wt1 in development and renal disorders.21,22 Wt1−/− animals die between day 13.5 and day 15.5 of embryonic development due to impaired kidney and gonad maturation.23 Germ line Wt1-knockout mice induce dramatic failure of spleen (SPL) development, suggesting an important role for Wt1 in hematopoiesis.24 In vitro studies have demonstrated that WT1 triggers myelomonocytic differentiation and promotes stem cell quiescence.25
WT1 is a transcription factor that binds to specific target loci to regulate their expression and contribute to oncogenic transformation by modulating the epigenetic landscape.26 Several groups27,28 discovered that WT1 acts as a TET proteins cofactor in mediating 5-hydroxymethylation of cytosines (5-hmC),29-32 a pathway that is disrupted in AML.33,34
These observations suggest an avenue by which mutations in WT1 may contribute to leukemogenesis. Despite these insights, there remains a need for a model of WT1-mutant leukemia to fully characterize the role of Wt1 in steady-state hematopoiesis and stem cell function. Here, we demonstrate that Wt1 alterations, coupled with time-dependent changes in the genetic/epigenetic landscape of hematopoietic stem/progenitor cells, lead to enhanced stem cell function and leukemic transformation.
Methods
Generation of Wt1 conditional-knockout mice and Wt1-Flt3 double-mutant mice
Animals were housed at Memorial Sloan Kettering Cancer Center. Procedures were conducted in accordance with the Guidelines for the Care and Use of Laboratory Animals and were approved by the Institutional Animal Care and Use Committees at Memorial Sloan Kettering Cancer Center. Wt1fl/+ mice were a gift from Vicky Huff21 and were backcrossed with mice carrying the C57BL/6 Mx-1 Cre transgene for 6 generations to obtain a pure C57BL/6 background. Mx1-Cre Wt1 floxed mice were later mated with Flt3-ITD mice.35 Genotyping polymerase chain reaction was performed as previously described.21,35
In vivo studies
WT1 conditional and control mice received 4 intraperitoneal injections of polyinosinic-polycytidylic acid [poly(I:C); Amersham, Piscataway, NJ] every other day at a dose of 20 µg/kg starting at different times postbirth (1 month for the young acute and young chronic cohorts and 6-8 months for the old acute cohort). Peripheral blood was collected by submandibular puncture. Complete blood counts were obtained using an IDEXX ProCyte DX automated hemocytometer. At the time of euthanization, peripheral blood, bone marrow (BM), SPLs, livers, lymph node, and thymus of Wt1 conditional and control mice were isolated, and single-cell suspensions were analyzed.
RNA sequencing
Single live Lineage−Sca1−c-Kit+ myeloid progenitors (MPs) were sorted into phosphate-buffered saline. Total RNA was extracted from MP-sorted cells using a DNA/RNA preparation kit (QIAGEN, Valencia, CA), and its quality was assessed on a 2200 TapeStation (Agilent Technologies). A complementary DNA (cDNA) library was generated from 50 ng of total RNA using a QuantSeq 3′mRNA-Seq Library Prep Kit FWD (Lexogen, Vienna, Austria), supplemented with a common set of external RNA controls (ERCC RNA Spike-In Mix, Thermo Fisher Scientific), according to the manufacturer’s recommendations. An in-house pipeline was used for read mapping and alignment, transcript construction, and quantification of data generated by sequencing (HiSeq 2000; New York Genome Center, NY). All processed RNA sequencing (RNA-seq) was deposited into the Gene Expression Omnibus database under accession number GSE109922.
Results
Wt1 haploinsufficiency induces altered myeloid differentiation in vivo
We generated a hematopoietic-specific conditional Wt1-knockout mouse model to investigate the role of Wt1 in steady-state hematopoiesis. Mx1-Cre–driven recombination induced a dose-dependent decrease in Wt1 expression in the BM and SPL cells from Mx+Wt1fl/+ (Wt1fl/+) and Mx+Wt1fl/fl (Wt1fl/fl) mice compared with controls, as shown in supplemental Figure 1A-D, available on the Blood Web site. Homozygous or heterozygous loss of Wt1 was not associated with any sustained significant differences in peripheral blood counts, similar to control (supplemental Figure 1E). One month after Wt1 deletion, we observed an increased proportion of Lineage− (Lin−) cells (mean, 51.2% of total BM; Wt1+/+, 31.9%; Wt1fl/fl, 36.6%; P < .0001) and granulocyte-macrophage progenitors (GMPs) (mean, 70.7% of MPs; Wt1+/+, 54.9%; Wt1fl/fl, 56%; P < .005) in Wt1-haploinsufficient mice BM. In contrast, this increase was not observed in wild-type (WT) mice or in mice with complete loss of Wt1 in their hematopoietic compartment (Figure 1A). We next performed colony-forming assays using Lineage−Sca1+c-Kit+ (LSK)-sorted cells from control, Wt1fl/+, and Wt1fl/fl mice. Wt1 loss resulted in an enhanced fraction of granulocyte/macrophage (GM) colonies (mean, 0.783%; WT, 0.55%; Wt1fl/fl, 0.54%; P < .05) at the expense of multipotential colonies (mean, 0.22%; WT, 0.45%; Wt1fl/fl, 0.46%; P < .05) compared with WT cells (Figure 1B). We did not notice significant differences in colony output with Wt1-heterozygous cells compared with controls. These data suggest a dose- and time-dependent effect of Wt1 on the regulation of hematopoietic differentiation and self-renewal.
![Figure 1. Wt1 depletion alters myeloid differentiation but does not markedly impact steady-state hematopoiesis. (A) The proportion of Lin− cells and progenitors (common myeloid progenitors [CMPs], GMPs, and megakaryocyte/erythrocyte progenitors [MEPs]) were measured in the BM compartment of primary mice 1 month after Wt1 depletion (n = 5). (B) Methylcellulose colony-forming assay of sorted LSK cells from Wt1fl/+ and Wt1fl/fl mice and their control littermates. Representative results of 3 independent experiments, each performed in triplicate. Kaplan-Meier survival curves of secondary (C) and tertiary (D) recipients transplanted with control, Wt1fl/+ or Wt1fl/fl total BM cells (n = 10). (E) Thymus and lymph node weights of mice with T-ALL compared with control littermates (n = 3-5). (F) CD3+ cells fraction in the SPL, BM, and peripheral blood (PB) compartments of diseased mice compared with controls (n = 3-5). (G) Thymic percentages of CD4+, CD8+, and CD4+CD8+ cells among CD3+ cells of T-ALL and control mice at disease onset (n = 3-5). (H) Quantification of mature and c-Kit+ cells (%) in the peripheral blood and BM of control and diseased Wt1fl/+ secondary recipients (n = 3-5). (I) Stem/progenitor cell percentages in the BM of T-ALL animals compared with controls (n = 3-5). Graphs show mean ± standard error of the mean. *P < .05, **P < .01, ****P < .0001, 2-way analysis of variance (A-B,E-I) or Mantel-Cox test (C-D). GEMM, granulocyte-erythrocyte-monocyte-megakaryocyte.](https://ash.silverchair-cdn.com/ash/content_public/journal/blood/132/12/10.1182_blood-2018-03-837468/4/m_blood837468f1.png?Expires=1765888556&Signature=jviTLkn~~BopCPI9gXLgD2cUjl5ypWO0Mg~nEvy61lcXNv77zk3vLIgSSImRaFpCOECvHxBofa0hcZuCG22m0nLlh3VQZDgcg2gKT~3mkrohl5DDnSwH~uXr6~ChyWDK9lgWC-gNas9YUYEqS0ByZyC62h5M2r-cusf2OFJLKkd5uNe1yE9aWQbv5pnWZz47o5AuEOehJWBpewy-5Ja3Ex1Ud7DyTicO1o69Aw-QPUMv95QU1YMuOZTqvbaHvDLFNZJRDRa1pMk-uIYtQYUhMKYgzu3e-XlomKxejzL3jel9NlvapsHM5OYxfAXlRZ8cFjbfpMTzozy2Dov8YPrU3Q__&Key-Pair-Id=APKAIE5G5CRDK6RD3PGA)
Wt1 depletion alters myeloid differentiation but does not markedly impact steady-state hematopoiesis. (A) The proportion of Lin− cells and progenitors (common myeloid progenitors [CMPs], GMPs, and megakaryocyte/erythrocyte progenitors [MEPs]) were measured in the BM compartment of primary mice 1 month after Wt1 depletion (n = 5). (B) Methylcellulose colony-forming assay of sorted LSK cells from Wt1fl/+ and Wt1fl/fl mice and their control littermates. Representative results of 3 independent experiments, each performed in triplicate. Kaplan-Meier survival curves of secondary (C) and tertiary (D) recipients transplanted with control, Wt1fl/+ or Wt1fl/fl total BM cells (n = 10). (E) Thymus and lymph node weights of mice with T-ALL compared with control littermates (n = 3-5). (F) CD3+ cells fraction in the SPL, BM, and peripheral blood (PB) compartments of diseased mice compared with controls (n = 3-5). (G) Thymic percentages of CD4+, CD8+, and CD4+CD8+ cells among CD3+ cells of T-ALL and control mice at disease onset (n = 3-5). (H) Quantification of mature and c-Kit+ cells (%) in the peripheral blood and BM of control and diseased Wt1fl/+ secondary recipients (n = 3-5). (I) Stem/progenitor cell percentages in the BM of T-ALL animals compared with controls (n = 3-5). Graphs show mean ± standard error of the mean. *P < .05, **P < .01, ****P < .0001, 2-way analysis of variance (A-B,E-I) or Mantel-Cox test (C-D). GEMM, granulocyte-erythrocyte-monocyte-megakaryocyte.
Wt1 depletion alters myeloid differentiation but does not markedly impact steady-state hematopoiesis. (A) The proportion of Lin− cells and progenitors (common myeloid progenitors [CMPs], GMPs, and megakaryocyte/erythrocyte progenitors [MEPs]) were measured in the BM compartment of primary mice 1 month after Wt1 depletion (n = 5). (B) Methylcellulose colony-forming assay of sorted LSK cells from Wt1fl/+ and Wt1fl/fl mice and their control littermates. Representative results of 3 independent experiments, each performed in triplicate. Kaplan-Meier survival curves of secondary (C) and tertiary (D) recipients transplanted with control, Wt1fl/+ or Wt1fl/fl total BM cells (n = 10). (E) Thymus and lymph node weights of mice with T-ALL compared with control littermates (n = 3-5). (F) CD3+ cells fraction in the SPL, BM, and peripheral blood (PB) compartments of diseased mice compared with controls (n = 3-5). (G) Thymic percentages of CD4+, CD8+, and CD4+CD8+ cells among CD3+ cells of T-ALL and control mice at disease onset (n = 3-5). (H) Quantification of mature and c-Kit+ cells (%) in the peripheral blood and BM of control and diseased Wt1fl/+ secondary recipients (n = 3-5). (I) Stem/progenitor cell percentages in the BM of T-ALL animals compared with controls (n = 3-5). Graphs show mean ± standard error of the mean. *P < .05, **P < .01, ****P < .0001, 2-way analysis of variance (A-B,E-I) or Mantel-Cox test (C-D). GEMM, granulocyte-erythrocyte-monocyte-megakaryocyte.
Wt1-haploinsufficient but not Wt1-deficient hematopoietic cells progress to leukemic transformation
We next followed mice over time and performed serial in vivo transplants of BM cells from WT, Wt1fl/+, and Wt1fl/fl animals. A subset of secondary recipients engrafted with Wt1fl/+ cells (n = 3/11 mice) developed acute leukemia best characterized as T-ALL (median survival, 64 days; P < .0001) (Figure 1C). Five of 11 secondary recipients of Wt1fl/+ BM cells died of BM failure shortly after transplantation (Figure 1C, data not shown). The disease was transplantable (median survival, 29 days) (Figure 1D) and characterized by thymomegaly, lymphadenopathy, and splenomegaly compared with controls (Figure 1E; supplemental Figure 1F). Flow analysis revealed an elevated fraction of splenic CD3+ cells (mean, 38.5%; WT, 8.9%; P < .01) in Wt1fl/+ T-ALL mice (Figure 1F). The malignant lymphocytes in the thymus and lymph nodes of diseased animals were primarily CD8+ T cells (Figure 1G; supplemental Figure 1G). Wt1fl/+ T-ALL mice showed a significant increase in the proportion of circulating c-Kit+ cells and a concomitant reduction in the percentage of myeloid/B-lymphoid cells (Mac1+Gr1+ and B220+) compared with controls (Figure 1H). We noticed a similar significant diminution in the amount of B220+/Mac1−Gr1+ cells, as well as an expansion of multipotent progenitors (MPPs) (mean, 88.9% of LSK cells; WT, 40.3%; P < .005) and MPs (mean, 86.5% of Lin− cells; WT, 26.7%; P < .05), in the BM from diseased mice (Figure 1H-I). Histopathologically, Wt1fl/+ T-ALL mice were characterized by infiltration of the BM and the SPL by a monotonous population of hematopoietic cells that resemble atypical lymphocytes associated with an increased expression of c-Kit (supplemental Figure 1H-I). These data demonstrate that Wt1fl/+, but not Wt1fl/fl, secondary transplant recipients can progress to acute leukemia.
Wt1-haploinsufficient T-ALL is associated with acquisition of somatic genetic events and clonal evolution
The development of T-ALL in Wt1-haploinsufficient transplant recipients suggested a requirement for additional genetic and/or epigenetic events to induce leukemic transformation. Therefore, we performed mutational profiling from a set of primary and secondary recipients who developed T-ALL to identify potential cooperating mutations and delineate clonal representation (Figure 2A), using a custom targeted sequencing panel querying 578 known cancer genes (MSK-Mouse IMPACT; M-IMPACT) (supplemental Table 1). This allowed us to define known oncogenic disease alleles in mice engrafted with Wt1-haploinsufficient cells, including Notch1 mutations in all secondary and tertiary recipients developing T-ALL. In 1 set of recipient mice, the T-ALL–dominant clone had Notch1, Ciita, and c-Kit mutations in concert with focal deletions in Bcl11b. In a second set of leukemias, KrasG12D mutations were identified with loss of chromosome 15/18. Of note, in 1 of these tumors, we found a subclonal Kras variant concurrent with a Pten non-sense mutation, consistent with continued clonal evolution. Strikingly, sequencing of the BM cells from the 5 primary recipients used to perform the secondary transplantation showed that no donor cells harbored the mutations detected in the leukemic mice, confirming that those mutations were acquired during disease transformation. These data demonstrate that Wt1 haploinsufficiency cooperates with known leukemia disease alleles to drive leukemogenesis (Figure 2A).
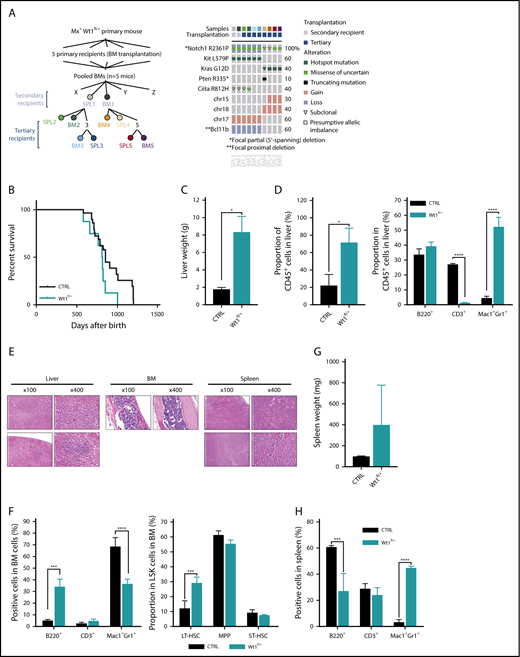
Wt1-haploinsufficient hematopoietic cells partially progress to leukemic transformation over time. (A) Detail of samples submitted to detection of somatic mutations in selected published leukemia driver genes: M-IMPACT (left panel). Detail of mutations, colored by mutation type, found in secondary and tertiary transplanted diseased mice (right panel). (B) Kaplan-Meier survival curves of primary Wt1fl/+ and control littermates (n = 7-14). Liver weights (C) and proportion of CD45+ cells and mature cells among these CD45+ cells (D) from livers of control and diseased Wt1fl/+ mice (n = 4). (E) Histology of liver, BM, and SPL sections of aged primary heterozygous depleted mice (hematoxylin and eosin stain). (F) Quantification of mature and stem cells in the BM of control and diseased mice (n = 4). SPL weights (G) and quantification of mature cells (H) in the SPL of control and diseased mice (n = 4). Data are mean ± standard error of the mean (C-D,F-H). *P < .05, ***P < .001, ****P < .0001, Mantel-Cox test (B) or 2-way analysis of variance (C-D,F-H).
Wt1-haploinsufficient hematopoietic cells partially progress to leukemic transformation over time. (A) Detail of samples submitted to detection of somatic mutations in selected published leukemia driver genes: M-IMPACT (left panel). Detail of mutations, colored by mutation type, found in secondary and tertiary transplanted diseased mice (right panel). (B) Kaplan-Meier survival curves of primary Wt1fl/+ and control littermates (n = 7-14). Liver weights (C) and proportion of CD45+ cells and mature cells among these CD45+ cells (D) from livers of control and diseased Wt1fl/+ mice (n = 4). (E) Histology of liver, BM, and SPL sections of aged primary heterozygous depleted mice (hematoxylin and eosin stain). (F) Quantification of mature and stem cells in the BM of control and diseased mice (n = 4). SPL weights (G) and quantification of mature cells (H) in the SPL of control and diseased mice (n = 4). Data are mean ± standard error of the mean (C-D,F-H). *P < .05, ***P < .001, ****P < .0001, Mantel-Cox test (B) or 2-way analysis of variance (C-D,F-H).
Wt1 heterozygous loss induces age-dependent myeloid transformation
We followed primary Wt1-haploinsufficient mice over time for evidence of hematopoietic alterations (Figure 2B). A subset of aged primary Wt1-haploinsufficient mice (n = 8/20, 18-22 months postdepletion) developed a myeloid malignancy with features of myeloproliferative neoplasms and myelodysplastic syndrome (Figure 2B-H; supplemental Figure 1J-K) associated with distended abdomens and marked hepatomegaly (Figure 2C) due to an infiltration of hematopoietic cells (CD45+) (mean, 71.2%; WT, 21.7%; P < .05) with a significant expansion of myeloid cells (mean, 52% of CD45+ cells; WT, 4.3%; P < .005) compared with age-matched controls (Figure 2D). Histopathologic review of livers of diseased mice exhibited infiltration by a monotonous population of small to medium hematopoietic cells with a spindled morphology and abundant eosinophilic cytoplasm (Figure 2E). BM cytopathology revealed a monocellular marrow with trilineage hematopoiesis with a left-shifted myeloid lineage and megakaryocyte clustering, a topographical feature of dysplasia (Figure 2E). Flow analysis of their BM uncovered a decreased percentage of myeloid cells (mean, 43.7% of total BM cells; WT, 68.2%; P < .0001) and an amplified proportion of long-term hematopoietic stem cells (mean, 29% of LSK cells; WT, 12%; P < .0001) compared with age-matched control mice (Figure 2F; supplemental Figure 1J-K). In addition, we observed mild splenomegaly associated with significant expansion of myeloid cells in these animals compared with controls (Figure 2G-H). Altogether, these data suggest that Wt1 haploinsufficiency induces time-dependent alterations in hematopoiesis, including myeloid transformation.
Aging of Wt1-depleted mice influences stem cell renewal in vitro and in vivo
Given the age-dependent development of hematologic malignancies in Wt1-haploinsufficient mice, we hypothesized that Wt1 single copy loss requires age-dependent genetic/epigenetic alterations to extend stem/progenitor cell function and promote transformation. Therefore, we evaluated hematopoietic stem/progenitor function in mice in which we deleted Wt1 at different time points (Figure 3A). Heterozygous, homozygous, or control animals were injected with poly(I:C) at 1 or 6 to 8 months of age, followed by detailed hematopoietic assessment at early and late time points. In addition to the dose-dependent reduction in Wt1 expression seen with haploinsufficiency or complete Wt1 loss, we observed a decrease in Wt1 expression with increased age in LSK cells, megakaryocyte/erythrocyte progenitors (MEPs), GMPs, and CMPs when analyzed by quantitative polymerase chain reaction (supplemental Figures 1C and 2A). To evaluate the impact of aging on the competitive repopulating potential of Wt1-depleted cells, we performed competitive transplantation at different time points in vivo. We discovered that Wt1-deficient cells transplanted from mice 6 to 8 months (young chronic) after initial deletion displayed a competitive advantage in vivo, as determined by increased peripheral blood and BM chimerism (mean, 72.9% CD45.2+; Wt1fl/fl, 65.2%; WT, 44%; P < .05) (Figure 3B; supplemental Figure 2B). However, heterozygous or homozygous loss of Wt1 in young mice transplanted 1 month postdeletion (young acute) did not manifest a similar increase in competitive repopulating capacities (Figure 3B). This suggested that either aging alone or progressive alterations induced by chronic Wt1 loss were responsible for the noted enhancement of self-renewal capacity. Notably, when we acutely deleted Wt1 at 6 to 8 months of age (old acute), followed by competitive transplant, we did not observe an increase in self-renewal; instead, we found a competitive disadvantage (Figure 3B).
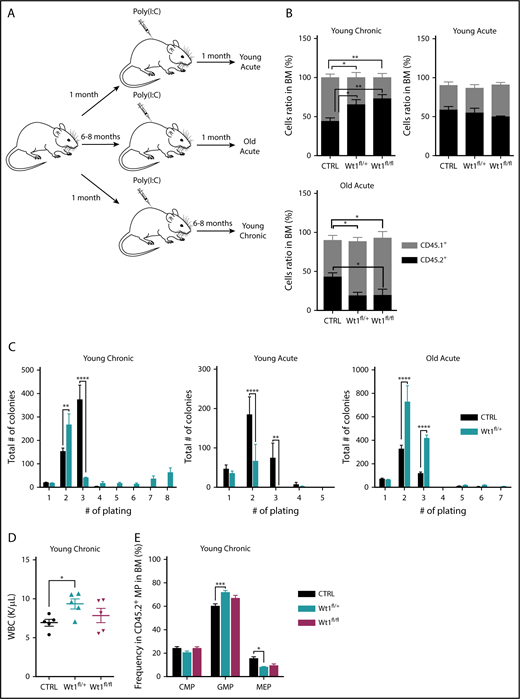
Wt1 haploinsufficiency induces age-dependent changes in hematopoietic stem cell function. (A) Schematic model used to study effect of Wt1 depletion on hematopoiesis among aging. Control, Wt1fl/+, and Wt1fl/fl mice were injected with poly(I:C) at 1 month of age (young) or at 6-8 months of age (old), followed by detailed hematopoietic assessment at early (acute) and late (chronic) time points. (B) Proportion of recipient cells (CD45.1+) or donor cells (CD45.2+) in the BM compartment of control, Wt1fl/+, and Wt1fl/fl animals from young chronic, young acute, and old acute cohorts (n = 5). (C) Methylcellulose assays on total BM cells from control or Wt1fl/+ mice from young chronic, young acute, and old acute subgroups (n = 5 independent experiments per arm, in triplicate). (D) WBC counts of control, Wt1fl/+, and Wt1fl/fl animals from secondary recipients transplanted with total BM cells of each genotype from the young chronic cohort (n = 5). (E) Quantification of progenitor cells among donor cells (CD45.2+) in the BM compartment of secondary recipient mice transplanted with control, Wt1fl/+, or Wt1fl/fl cells from the young chronic subgroup (n = 5). Data are mean ± standard error of the mean (B-E). *P < .05, **P < .01, ***P < .001, ****P < .0001, 2-way analysis of variance.
Wt1 haploinsufficiency induces age-dependent changes in hematopoietic stem cell function. (A) Schematic model used to study effect of Wt1 depletion on hematopoiesis among aging. Control, Wt1fl/+, and Wt1fl/fl mice were injected with poly(I:C) at 1 month of age (young) or at 6-8 months of age (old), followed by detailed hematopoietic assessment at early (acute) and late (chronic) time points. (B) Proportion of recipient cells (CD45.1+) or donor cells (CD45.2+) in the BM compartment of control, Wt1fl/+, and Wt1fl/fl animals from young chronic, young acute, and old acute cohorts (n = 5). (C) Methylcellulose assays on total BM cells from control or Wt1fl/+ mice from young chronic, young acute, and old acute subgroups (n = 5 independent experiments per arm, in triplicate). (D) WBC counts of control, Wt1fl/+, and Wt1fl/fl animals from secondary recipients transplanted with total BM cells of each genotype from the young chronic cohort (n = 5). (E) Quantification of progenitor cells among donor cells (CD45.2+) in the BM compartment of secondary recipient mice transplanted with control, Wt1fl/+, or Wt1fl/fl cells from the young chronic subgroup (n = 5). Data are mean ± standard error of the mean (B-E). *P < .05, **P < .01, ***P < .001, ****P < .0001, 2-way analysis of variance.
Consistent with these data, we noted that Wt1fl/+ cells from mice deleted soon after birth and then aged for 6 months (young chronic) showed the ability to serially replate, which was not present in young mice analyzed following Wt1 deletion (young acute) or in aged mice who had Wt1 deleted acutely (old acute) (Figure 3C). To further characterize the consequences of Wt1 haploinsufficiency over time, we measured the repopulating capacity of aged donor cells (CD45.2+) by performing in vivo primary transplantation of Wt1fl/+, Wt1fl/fl, and control cells 6 months after Wt1 deletion (young chronic) into lethally irradiated recipients. At the time of euthanasia, mice transplanted with Wt1fl/+ BM cells from aged donor mice had elevated white blood cell (WBC) counts compared with controls and Wt1fl/fl counterparts (P < .05) (Figure 3D). We also detected an increase in the proportion of GMPs (mean, 71.8% of MP cells; Wt1fl/fl, 66.9%; WT, 60.2%; P < .001) at the expense of the MEP population (mean, 8% of MP cells; Wt1fl/fl, 9.4%; WT, 15.4%; P < .05) in the BM of mice engrafted with Wt1fl/+ donor cells (Figure 3E). Taken together, these data suggest that Wt1 haploinsufficiency can induce a progressive increase in self-renewal capacity consistent with gradual remodeling of the Wt1-depleted clone over time.
Wt1 heterozygous loss of expression has a time-dependent impact on 5-hmC levels
We and other investigators have recently established that WT1 binds TET2/3, demonstrating a role for WT1 in modulating TET-mediated 5-hmC production.27,28 To appraise how Wt1 depletion impacts 5-hmC levels within hematopoietic cells in vivo, we performed dot blot assays on DNA isolated from splenocytes from young chronic, young acute, and old acute animals of each arm (Figure 4A-B). Wt1 depletion was associated with lessened 5-hmC levels, most significantly in Wt1-depleted cells from primary elderly animals. A similar decrement in 5-hmC was also discovered in primary Wt1fl/+ animals that developed myeloid malignancies (elderly mice in Figure 4A-B), confirming the age-dependent impact of Wt1 on epigenetic changes. Recent studies36,37 demonstrated that vitamin C treatment of Tet2-haploinsufficient mice could restore 5-hmC formation through increased function of Tet1/3. To assess whether vitamin C treatment restores impaired 5-hmC levels in Wt1-depleted cells, we exposed total BM cells isolated from Wt1fl/+ mice from the young chronic cohort to increasing vitamin C concentrations (0-1 µM). We found that vitamin C exposure increased 5-hmC expression in Wt1-depleted cells (Figure 4C). We then overexpressed human WT1 cDNA, using a Migr–IRES–GFP retrovirus, in c-Kit+ cells isolated from Tet2fl/fl animals. We observed that WT1 overexpression disrupted the capacities of Tet2-deficient cells to engraft and induce leukemia, with a reduced proportion of engrafted GFP+ cells, decreased WBC counts, and increased survival rate of Tet2fl/fl animals transplanted with WT1-expressing cells compared with controls (Figure 4D). These results demonstrate that Wt1 haploinsufficiency impairs Tet2 function and 5-hmC expression.
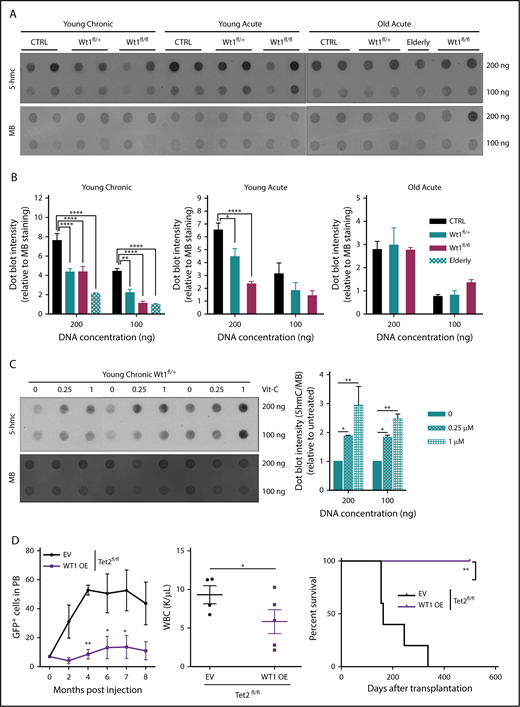
Wt1 heterozygous loss of expression has a time-dependent impact on 5-hmC levels. (A) DNA 5-hmC content of splenocytes from control, Wt1fl/+, and Wt1fl/fl mice from young chronic, young acute, and old acute cohorts and from 1 Wt1fl/+ aged primary mice (elderly) was established by dot blots. Data are representative of 3 experiments, with 7 animals per arm in total. Methylene blue (MB) was used as a loading control for all experiments. (B) Ratio of 5-hmC/MB spot intensities from 3 experiments. (C) DNA dot blots for 5-hmC in genomic DNA from splenocytes from Wt1fl/+ mice in the young chronic cohort treated with increasing vitamin C (Vit-C) concentrations (0-1 µM) for 6 days. Data are representative of 3 experiments, in triplicate. (D) WT1 overexpression in Tet2-knockdown c-Kit+ cells delayed Tet2-associated leukemia, as reflected by the percentage of circulating GFP+ cells, WBC counts, and survival curves of Tet2fl/fl cells infected with WT1-expressing (WT1 OE) viruses compared with controls (EV). Data are mean ± standard error of the mean (B-E). *P < .05, **P < .01, ****P < .0001, 2-way analysis of variance (B-D) or Mantel-Cox test (D).
Wt1 heterozygous loss of expression has a time-dependent impact on 5-hmC levels. (A) DNA 5-hmC content of splenocytes from control, Wt1fl/+, and Wt1fl/fl mice from young chronic, young acute, and old acute cohorts and from 1 Wt1fl/+ aged primary mice (elderly) was established by dot blots. Data are representative of 3 experiments, with 7 animals per arm in total. Methylene blue (MB) was used as a loading control for all experiments. (B) Ratio of 5-hmC/MB spot intensities from 3 experiments. (C) DNA dot blots for 5-hmC in genomic DNA from splenocytes from Wt1fl/+ mice in the young chronic cohort treated with increasing vitamin C (Vit-C) concentrations (0-1 µM) for 6 days. Data are representative of 3 experiments, in triplicate. (D) WT1 overexpression in Tet2-knockdown c-Kit+ cells delayed Tet2-associated leukemia, as reflected by the percentage of circulating GFP+ cells, WBC counts, and survival curves of Tet2fl/fl cells infected with WT1-expressing (WT1 OE) viruses compared with controls (EV). Data are mean ± standard error of the mean (B-E). *P < .05, **P < .01, ****P < .0001, 2-way analysis of variance (B-D) or Mantel-Cox test (D).
Wt1 heterozygous loss of expression has a time-dependent impact on gene expression
To gain insight into the mechanisms underlying the progressive role of Wt1 haploinsufficiency on gene regulation, we performed RNA-seq analysis on sorted MPs from Wt1fl/+ mice of different ages compared with their age-matched control counterparts (n = 3 mice per group). Gene-set enrichment analysis (normalized enrichment score threshold, 1.4; false discovery rate <0.2) of Wt1-haploinsufficient cells compared with age-matched controls displayed significant differential enhancement of specific genes in Wt1-heterozygous cells, including gene sets engaged in hematopoietic stem cells and genes silenced by methylation (Figure 5A). We also identified significant alterations in distinct gene signatures that were only altered by Wt1 haploinsufficiency after an extended duration. Genes implicated in IL-12 and LIF signaling pathways were reduced in MPs isolated from older Wt1fl/+ mice (Figure 5A), whereas gene signatures involved in RNA splicing and histone H3K4 methylation were downregulated in MP-sorted cells from younger Wt1fl/+ mice (Figure 5A, upper panel; supplemental Figure 2C). Genes involved in signaling pathways and chromatin remodeling, including Nfat5 and Brd2 were down regulated in Wt1-depleted cells, regardless of aging. In contrast, Srsf4, a regulator of RNA splicing, was downregulated in young Wt1fl/+-sorted MPs but upregulated in sorted MP cells from aged Wt1fl/+ mice (Figure 5A, lower panels).
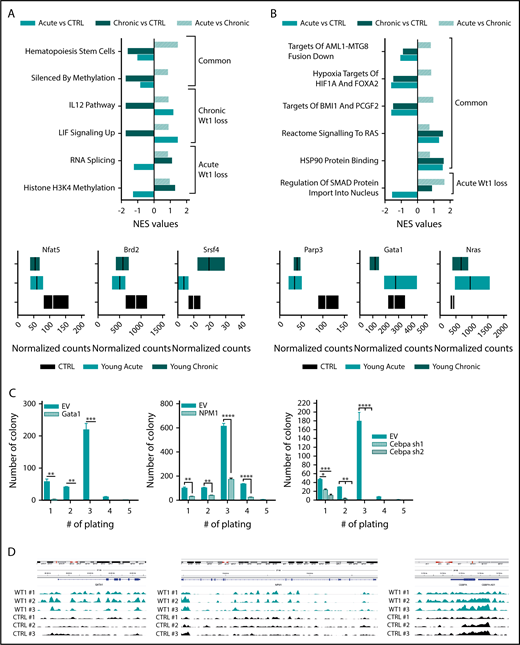
Wt1 heterozygous loss has an age-dependent impact on genetic/epigenetic landscape. Normalized enrichment scores of gene signatures defined by RNA-seq performed in MPs from young chronic and young acute heterozygous mice compared with age-matched controls (A) or young controls (B) and between heterozygous mice from each subgroup (young vs old) (upper panel). (A-B) Normalized counts of a subset of genes differentially expressed in Wt1-heterozygote sorted MPs compared with controls (lower panel). (C) Serial replating assay of control (EV) or ectopic Gata1-, Npm1-, or shCebpa-expressing Wt1fl/+ BM cells from the young chronic cohort. Representative results of 3 independent experiments, each performed in triplicate. Data are mean ± standard error of the mean. (D) CHIP-seq signals for Wt1 at Gata1, Npm1, and Cebpa loci. *P < .05, **P < .01, ***P < .001, ****P < .0001, 2-way analysis of variance.
Wt1 heterozygous loss has an age-dependent impact on genetic/epigenetic landscape. Normalized enrichment scores of gene signatures defined by RNA-seq performed in MPs from young chronic and young acute heterozygous mice compared with age-matched controls (A) or young controls (B) and between heterozygous mice from each subgroup (young vs old) (upper panel). (A-B) Normalized counts of a subset of genes differentially expressed in Wt1-heterozygote sorted MPs compared with controls (lower panel). (C) Serial replating assay of control (EV) or ectopic Gata1-, Npm1-, or shCebpa-expressing Wt1fl/+ BM cells from the young chronic cohort. Representative results of 3 independent experiments, each performed in triplicate. Data are mean ± standard error of the mean. (D) CHIP-seq signals for Wt1 at Gata1, Npm1, and Cebpa loci. *P < .05, **P < .01, ***P < .001, ****P < .0001, 2-way analysis of variance.
We next sought to delineate the cumulative impact of Wt1 heterozygote depletion and aging on gene expression and focused on pathways differentially expressed in young chronic mice or young acute animals compared with young controls. This analysis highlighted that gene signatures involved in leukemogenesis (AML1-MTG8 fusion down), signaling pathways (RAS signaling and HSP90 protein binding), hypoxia (targets of HIF1A and FOXA2), and polycomb complexes were significantly altered by Wt1 depletion, independent of aging (Figure 5B). We also discerned a subset of gene signatures significantly downregulated in young Wt1fl/+ mice, including genes implicated in SMAD protein nuclear import (Figure 5B, upper panel; supplemental Figure 2D). Further examination of the genes driving significant enrichment in gene signatures revealed that the transcription regulators Parp3 and Gata1 were downregulated in MP-Wt1fl/+ mice, whereas genes engaged in the Ras signaling pathway were enriched in Wt1-haploinsufficient mice compared with controls (Figure 5B, lower panels). These results demonstrated that Wt1 haploinsufficiency induces age- and time-dependent changes in 5-hmC levels and in gene expression that correlate with the elevated self-renewal and myeloid transformation that was observed over time.
We also assessed whether a subset of the candidate target genes, defined by our RNA-seq analysis, would restore the serial replating capacities of Wt1fl/+ cells in methylcellulose assays. We expressed Gata1 and Npm1 using retroviral cDNAs or silenced Cebpa using 2 short hairpin RNA vectors in c-Kit+ BM cells isolated from Wt1fl/+ animals from the young chronic cohort (supplemental Figure 2A-C). Of note, these cells showed similar Gata1, Npm1, and Cebpa messenger RNA expression as WT BM cells (supplemental Figure 3A). Wt1fl/+ cells expressing control vectors showed serial replating capacities, whereas Gata1, Npm1, or Cebpa-depleted cells lost this capacity (Figure 5C). These data demonstrate that restoring Gata1, Npm1, or Cebpa expression attenuates Wt1-depletion effects on hematopoietic self-renewal. To further characterize the impact of Wt1 on target gene regulation, we integrated our results with recently reported WT1 chromatin immunoprecipitation (CHIP) sequencing (CHIP-seq) data38 and found peaks among the gene body and around the transcription start site/promoter regions of Gata1, Npm1, and Cebpa and other candidate target genes nominated from our RNA-seq analysis (Parp3 and Notch4) (Figure 5D; supplemental Figure 3B). Altogether, these results demonstrate that Wt1 modulates target genes involved in myeloid differentiation/self-renewal.
Wt1 haploinsufficiency cooperates with Flt3-ITD to induce leukemogenesis in vivo
Analysis of AML patients harboring WT1 mutations indicated that activating mutations in the FLT3 gene are one of the most commonly co-occurring variants in WT1-mutant AML.27 Moreover, a subset of AML patients with FLT3-ITD mutations undergoes copy-neutral loss of heterozygosity at the FLT3 locus, which results in FLT3-ITD homozygosity and adverse clinical outcomes.39-41 To assess whether these genes cooperate in leukemogenesis, we crossed Wt1fl/+ mice with Flt3m/+ and Flt3m/m mice35 and induced Wt1 deletion. Wt1fl/+Flt3m/+ animals did not develop hematopoietic malignancies, although all Wt1fl/+Flt3m/m mice developed a lethal fully penetrant AML, with a median survival of 32.5 days (P < .00001) (Figure 6A). As expected, a subset of control mice (Wt1+/+Flt3m/m) developed a long-latency MPN35 (Figure 6A and data not shown). We noted spontaneous recombination in these diseased animals (supplemental Figure 4A), which is most likely due to spontaneous Mx1-Cre–driven recombination of floxed genes and the strong selective advantage of double-mutant cells.42 Wt1fl/+Flt3m/m mice were characterized by leukocytosis, anemia, and thrombocytopenia compared with littermates (Figure 6B; supplemental Figure 4B). Histopathological examination of the BM of Wt1fl/+Flt3m/m mice revealed a hypercellular marrow with a monotonous population of medium to large blasts (supplemental Figure 4C) associated with marked splenomegaly (Figure 6C).

Wt1 loss cooperates with Flt3-ITD mutations to induce leukemogenesis in vivo. (A) Kaplan-Meier survival curves for Wt1fl/+Flt3m/m animals compared with Wt1+/+Flt3m/m, Wt1fl/+Flt3m/+, and Wt1+/+Flt3m/+ animals (n = 15-20). WBC (K/µL) (B) counts and SPL weights (C) for primary Wt1fl/+Flt3m/m mice at the time of euthanasia compared with littermates (n = 7). Proportion of mature (D) and stem/progenitors (E) cells in the BM compartment of primary Wt1+/+ Flt3m/+, Wt1fl/+ Flt3m/+, Wt1+/+ Flt3m/m, and Wt1fl/+ Flt3m/m mice at disease onset (n = 7). (F) Volcano plot with the log2 fold changes in gene expression in MPs isolated from Wt1fl/+Flt3m/m mice compared with Wt1+/+Flt3m/m (CTRL) mice on the x-axis and the statistical significance (−log10 P value) on the y-axis. (G) Heat map of overlapping genes from RNA-seq expression data set from MP cells isolated from Wt1fl/+ mice from the young chronic cohort compared with the data set from Wt1fl/+Flt3m/m MP cells. (H) CHIP-seq signals for Wt1 at Ciita and CD74 loci. Data are mean ± standard error of the mean (B-E). *P < .05, **P < .01, ***P < .001, ****P < .001, Mantel-Cox test (A) or 2-way analysis of variance (B-E).
Wt1 loss cooperates with Flt3-ITD mutations to induce leukemogenesis in vivo. (A) Kaplan-Meier survival curves for Wt1fl/+Flt3m/m animals compared with Wt1+/+Flt3m/m, Wt1fl/+Flt3m/+, and Wt1+/+Flt3m/+ animals (n = 15-20). WBC (K/µL) (B) counts and SPL weights (C) for primary Wt1fl/+Flt3m/m mice at the time of euthanasia compared with littermates (n = 7). Proportion of mature (D) and stem/progenitors (E) cells in the BM compartment of primary Wt1+/+ Flt3m/+, Wt1fl/+ Flt3m/+, Wt1+/+ Flt3m/m, and Wt1fl/+ Flt3m/m mice at disease onset (n = 7). (F) Volcano plot with the log2 fold changes in gene expression in MPs isolated from Wt1fl/+Flt3m/m mice compared with Wt1+/+Flt3m/m (CTRL) mice on the x-axis and the statistical significance (−log10 P value) on the y-axis. (G) Heat map of overlapping genes from RNA-seq expression data set from MP cells isolated from Wt1fl/+ mice from the young chronic cohort compared with the data set from Wt1fl/+Flt3m/m MP cells. (H) CHIP-seq signals for Wt1 at Ciita and CD74 loci. Data are mean ± standard error of the mean (B-E). *P < .05, **P < .01, ***P < .001, ****P < .001, Mantel-Cox test (A) or 2-way analysis of variance (B-E).
Flow analysis indicated a reduction in the proportion of Mac1+Gr1+ (Figure 6D), Lin− (mean, 14% of total BM cells; Wt1+/+Flt3m/m, 61.4%; Wt1fl/+Flt3m/+, 17.4%; Wt1+/+Flt3m/+, 22.1%; P < .05), and short-term hematopoietic stem cells (mean, 47.2% of LSK cells; Wt1+/+Flt3m/m, 86.4%; Wt1fl/+Flt3m/+, 74%; Wt1+/+Flt3m/+, 78%; P < .05) in the BM of Wt1fl/+Flt3m/m mice compared with controls (Figure 6E). Nonetheless, these animals were characterized by an expansion of BM MPPs (mean, 79.1% of Lin− cells; Wt1+/+Flt3m/m, 6.2%; Wt1fl/+Flt3m/+, 5.3%; Wt1+/+Flt3m/+, 10.1%; P < .0001) and MPs (mean, 52.5% of Lin− cells; Wt1+/+Flt3m/m, 13.3%; Wt1fl/+Flt3m/+, 12.3%; Wt1+/+Flt3m/+, 24.1%; P < .005) (Figure 6E). We saw a similar expansion of MPs and GMPs associated with a reduction in the fraction of splenic Lin− cells and MEPs in Wt1fl/+Flt3m/m mice (supplemental Figure 4D). The AML observed in these animals was transplantable to lethally and sublethally irradiated secondary recipients (median survival 121 days, 3/6 animals developed AML) (supplemental Figure 4E). Recipients engrafted with Wt1fl/+Flt3m/m AML developed anemia, leukopenia (supplemental Figure 4F), and more significant splenomegaly than did primary leukemic mice (supplemental Figure 4G). Flow analysis revealed findings similar to what was seen in primary mice, with increased fractions of MPPs and GMPs, as well as a smaller percentage of short-term hematopoietic stem cells and Mac1+Gr1+ cells (supplemental Figure 4H). These data demonstrate that Wt1 haploinsufficiency cooperates with homozygosity for Flt3-ITD to induce AML in vivo.
We next sought to delineate the cooperative effect of Wt1 haploinsufficiency and Flt3 mutation on gene regulation. As such, we performed RNA-seq analysis of sorted MPs from Wt1fl/+Flt3m/m diseased mice compared with age-matched Flt3m/m mice. Gene-set enrichment analysis and gene expression signature demonstrated that Wt1fl/+Flt3m/m MPs were characterized by dysregulated expression of genes involved in hematopoietic differentiation (Erg1, Lrf2, and S100a8), within the major histocompatibility complex (Ciita, CD74, and CD86), in cytokine signaling/inflammatory response (Chi313, Lrf7, and Lrf4), and in cell/cell junction formation (L1cam and Itgae). In addition, genes involved in glucose metabolism and the tricarboxylic acid cycle, including Pdk3 and Retsat, were overexpressed in MPs isolated from diseased mice compared with controls (Figure 6F; supplemental Figure 5A). We next assessed whether Wt1 haploinsufficiency regulates a similar set of targets in the context of Flt3 mutations compared with Wt1 haploinsufficiency alone. We found a subset of genes that were downregulated in both data sets, including genes involved in major histocompatibility complex class II, such as CD74 and Ciita (Figure 6G). Notably, integration of CHIP-seq data38 shows that these genes are putative direct Wt1 targets, as reflected by WT1 CHIP-seq enrichment at transcription start site/gene bodies within these loci (Figure 6H). These data demonstrate that Wt1-heterozygous loss cooperates with Flt3 mutations to alter gene-regulatory networks and to promote leukemogenesis.
Wt1 cooperation with Flt3-ITD is influenced by the mice genetic background
Given the known role of genetic background on nonmalignant phenotypes in Wt1-deficient mice,21,24 we also generated Wt1fl/+Flt3m/+ 129S1/SvImJ mice. Similar to the C57BL/6 context, Wt1fl/+Flt3m/m mice with a 129S1/SvImJ genetic background (Figure 7A). In contrast, Wt1fl/+Flt3m/+ 129S1/SvImJ mice also developed a fully penetrant lethal AML with a median survival of 278 days (Figure 7B). The survival of Wt1fl/+Flt3m/+ mice was significantly worse compared with Wt1+/+Flt3m/+ 129S1/SvImJ mice (Figure 7B). The AML occurring in Wt1fl/+Flt3m/+ 129S1/SvlmJ mice was similar to AML in Wt1fl/+Flt3m/m mice, with elevated WBC counts, marked splenomegaly, an enlarged GMP population, and propagation of the leukemic clone to secondary recipients (Figure 7C; supplemental Figure 5B-E). Of note, these diseased animals also had a significant increased proportion of splenic Lin− cells and thymomegaly (P < .01) (Figure 7D; supplemental Figure 5F). These results illustrate the importance of genetic background on Wt1-mutant leukemia predisposition and suggest ≤1 genetic modifier(s) contributes to the leukemogenesis induced by Wt1 haploinsufficiency in concert with Flt3 mutations.

Wt1 loss phenotype is influenced by the genetic background and rescues Flt3-ITD mutation impact on stem cell population. (A) Kaplan-Meier survival curves of Wt1fl/+Flt3m/m animals with a C57BL/6 (Bl6) or 129S1/SvImJ (129S) genetic background compared with Wt1+/+Flt3m/m (Bl6) controls (n = 5-7). (B) Kaplan-Meier survival curves of Wt1fl/+Flt3m/+ (129S1/SvImJ) mice compared with control littermates (n = 10). WBC (K/µL) counts (C) and proportion of Lin− cells (D) in the SPL of Wt1fl/+Flt3m/+ (129S1/SvImJ) mice compared with control littermates (n = 10). (E) Percentages of LSK cells in the BM and the SPL of primary recipients transplanted with total BM cells from Wt1+/+Flt3m/+, Wt1fl/+Flt3m/+, or Wt1fl/flFlt3m/+ mice (n = 5). (F) Ratios of donor (CD45.2+) mature cells in the BM and SPL compartments of recipient mice transplanted with cells from control, Wt1fl/+Flt3m/+, or Wt1fl/flFlt3m/+ mice (n = 5). Data are mean ± standard error of the mean (C-F). *P < .05, **P < .01, ****P < .0001, Mantel-Cox test (A-B) or 2-way analysis of variance (C-F).
Wt1 loss phenotype is influenced by the genetic background and rescues Flt3-ITD mutation impact on stem cell population. (A) Kaplan-Meier survival curves of Wt1fl/+Flt3m/m animals with a C57BL/6 (Bl6) or 129S1/SvImJ (129S) genetic background compared with Wt1+/+Flt3m/m (Bl6) controls (n = 5-7). (B) Kaplan-Meier survival curves of Wt1fl/+Flt3m/+ (129S1/SvImJ) mice compared with control littermates (n = 10). WBC (K/µL) counts (C) and proportion of Lin− cells (D) in the SPL of Wt1fl/+Flt3m/+ (129S1/SvImJ) mice compared with control littermates (n = 10). (E) Percentages of LSK cells in the BM and the SPL of primary recipients transplanted with total BM cells from Wt1+/+Flt3m/+, Wt1fl/+Flt3m/+, or Wt1fl/flFlt3m/+ mice (n = 5). (F) Ratios of donor (CD45.2+) mature cells in the BM and SPL compartments of recipient mice transplanted with cells from control, Wt1fl/+Flt3m/+, or Wt1fl/flFlt3m/+ mice (n = 5). Data are mean ± standard error of the mean (C-F). *P < .05, **P < .01, ****P < .0001, Mantel-Cox test (A-B) or 2-way analysis of variance (C-F).
Wt1 loss of expression rescues Flt3-ITD mutation impact on stem cell population and repopulating capacities
Previous studies have proven that Flt3-ITD mice have a reduced number of functional HSCs and demonstrate a disadvantage in competitive transplantation studies.43,44 Therefore, we assessed whether Wt1 haploinsufficiency/loss could enhance the self-renewal capacities of Flt3-ITD+ stem/progenitor cells and rescue the stem cell defect induced by Flt3-ITD. Wt1 loss or heterozygosity resulted in a higher percentage of Flt3-ITD+ LSK cells in the BM (mean, 1.3% of Lin− cells; Wt1fl/+Flt3m/+, 2.6%; Wt1+/+Flt3m/+, 0.9%) and the SPL (mean, 0.9% of Lin− cells; Wt1fl/+Flt3m/+, 1.3%; Wt1+/+Flt3m/,+ 0.2%) in a transplantation setting (Figure 7E). Importantly, competitive transplants showed that Wt1fl/+Flt3m/+ and Wt1fl/flFlt3m/+ cells were able to outcompete WT cells, whereas Flt3m/+ cells presented a marked competitive disadvantage in vivo (Figure 7F; supplemental Figure 5G). These data demonstrate that Wt1 loss/heterozygosity can rescue the stem cell defect detected in Flt3-ITD hematopoietic cells and promote the self-renewal of Flt3-ITD stem/progenitor cells in vivo.
Discussion
WT1 was among the first tumor suppressors identified in heritable and sporadic cancers, and it has been proven to have critical roles in normal developmental or pathologic processes in different tissue types, although the mechanisms by which WT1 alterations contribute to malignant transformation have remained elusive. This is a particular challenge in AML, in which WT1 has been shown to function as an oncogene and a tumor suppressor.8,12,20,24,25
Using a conditional knockout mouse model, we show that Wt1 depletion has an age- dependent impact on hematopoiesis and stem cell function, which leads to enhanced self-renewal and progression to hematopoietic transformation. Our data suggest that Wt1 haploinsufficiency allows for hematopoietic stem/progenitor cells to accumulate epigenetic aberrations and somatic mutations (such as Flt3-ITD or Notch1), which then promote leukemic transformation. Our model provides a system to further investigate the role of Wt1 in leukemic transformation and other oncologic contexts.
WT1 functions as a critical transcription factor in the context of renal cell carcinogenesis. However, the precise mechanisms by which WT1 alterations drive leukemogenesis remain unclear. We previously demonstrated that WT1 mutations attenuate TET2 function, and here we confirmed that Wt1-mutant leukemias are characterized by diminished 5-hmC and disruption of gene-regulatory networks required for normal hematopoiesis.26,27 The relative contribution of altered Wt1 transcription factor function and reduced Tet enzymatic function in these modified gene-regulatory processes remain to be delineated, which will be informed by detailed site-specific studies of the WT1 cistrome and of 5-hmC deposition in Wt1-mutant leukemia at different stages of disease.
Given the adverse prognostic significance of WT1 mutations19,20,45 in AML and the link between WT1 mutations and chemoresistance in AML/acute lymphoblastic leukemias,16,34 there is a need for genetically accurate models of WT1-mutant leukemogenesis to inform mechanisms of transformation/therapeutic resistance and to test novel therapies in this high-risk AML subtype. Our work sheds novel insight into mechanisms of hematopoietic transformation, by which mutations in epigenetic modifiers can induce age-dependent progressive alterations in hematopoiesis that contribute to transformation. We would expect that studies with other mutations in epigenetic pathways will establish a similar evolutionary trajectory and that detailed serial studies of the genomic/epigenomic alterations in primary samples and model systems will uncover novel regulatory networks that are progressively altered to overcome barriers to transformation and to promote leukemogenesis.
The online version of this article contains a data supplement.
The publication costs of this article were defrayed in part by page charge payment. Therefore, and solely to indicate this fact, this article is hereby marked “advertisement” in accordance with 18 USC section 1734.
Acknowledgments
This work was supported by National Institutes of Health (NIH), National Cancer Institute grant R35 CA197594-01A1 and NIH, Office of the Director grant U54 OD020355 (both to R.L.L.), a Specialized Center of Research grant from the Leukemia and Lymphoma Society (R.L.L., A.M.), a grant from Cycle for Survival (R.L.L.), Memorial Sloan Kettering Cancer Center Support Grant (NIH, National Cancer Institute P30 CA008748), and a Francois Wallace Monahan Fellowship (E.P.). The authors acknowledge the use of the Integrated Genomics Operation Core, funded by Memorial Sloan Kettering Cancer Center Support Grant (NIH, National Cancer Institute P30 CA008748), and the Marie-Josée and Henry R. Kravis Center for Molecular Oncology.
Authorship
Contribution: Conceived and designed by E.P. and R.L.L. with J.G., R.R., and R.P.K. contributing to the design and the interpretation of the experiments; experiments in mice were performed by E.P., J.A, J.T.W., A.V.H.S., and T.R.M.; sequencing and sample preparation for enhanced reduced representation bisulfite sequencing and RNA-seq were performed by A.G. and analyzed by R.P.K., R.L.B., and J.G.; M-IMPACT computational results were analyzed by C.K. and B.S.T.; pathology slides were interpreted by B.H.D.; E.P. drafted the manuscript with subsequent help from R.L.B., R.L.L., J.G., R.P.K., A.M., and B.S.T.
Conflict-of-interest disclosure: The authors declare no competing financial interests.
Correspondence: Ross L. Levine, Human Oncology and Pathogenesis Program, Memorial Sloan Kettering Cancer Center, New York, NY 10065; e-mail: leviner@mskcc.org.

This feature is available to Subscribers Only
Sign In or Create an Account Close Modal