

Key Points
Notch1 cofactor Zmiz1 induces a subset of Notch target genes and drives pre–T-cell proliferation during normal and stress thymopoiesis.
Disrupting the Zmiz1-Notch1 protein-protein interaction impairs Myc induction, pre–T-cell expansion, and leukemic proliferation.

Abstract
Notch1 signaling must elevate to high levels in order to drive the proliferation of CD4−CD8− double-negative (DN) thymocytes and progression to the CD4+CD8+ double-positive (DP) stage through β-selection. During this critical phase of pre–T-cell development, which is also known as the DN-DP transition, it is unclear whether the Notch1 transcriptional complex strengthens its signal output as a discrete unit or through cofactors. We previously showed that the protein inhibitor of activated STAT–like coactivator Zmiz1 is a context-dependent cofactor of Notch1 in T-cell leukemia. We also showed that withdrawal of Zmiz1 generated an early T-lineage progenitor (ETP) defect. Here, we show that this early defect seems inconsistent with loss-of-Notch1 function. In contrast, at the later pre–T-cell stage, withdrawal of Zmiz1 impaired the DN-DP transition by inhibiting proliferation, like withdrawal of Notch. In pre–T cells, but not ETPs, Zmiz1 cooperatively regulated Notch1 target genes Hes1, Lef1, and Myc. Enforced expression of either activated Notch1 or Myc partially rescued the Zmiz1-deficient DN-DP defect. We identified residues in the tetratricopeptide repeat (TPR) domain of Zmiz1 that bind Notch1. Mutating only a single residue impaired the Zmiz1-Notch1 interaction, Myc induction, the DN-DP transition, and leukemic proliferation. Similar effects were seen using a dominant-negative TPR protein. Our studies identify stage-specific roles of Zmiz1. Zmiz1 is a context-specific cofactor for Notch1 during Notch/Myc-dependent thymocyte proliferation, whether normal or malignant. Finally, we highlight a vulnerability in leukemic cells that originated from a developmentally important Zmiz1-Notch1 interaction that is hijacked during transformation from normal pre–T cells.
Introduction
The 4 Notch receptors (Notch1-Notch4) are activated by ligands or additionally by mutations in cancer cells. Subsequently, γ-secretase cleaves the Notch receptors, which releases the IntraCellular domain of Notch (ICN). ICN then translocates to the nucleus where it binds cofactors to activate transcription. The oncogene MYC is a critical direct Notch1 target gene in T-cell acute lymphoblastic leukemia (T-ALL).1 In T cells, a Notch-dependent 3′ Myc enhancer amplifies Myc transcription.2,3 We discovered that the protein inhibitor of activated STAT (PIAS)-like cofactor Zmiz1 directly interacts with Notch1 and recruits it to the 3′ Myc enhancer in T-ALL cells through an N-terminal tetratricopeptide repeat (TPR) domain.4
To investigate this more thoroughly, we sought to understand the role of Zmiz1 in normal pre–T cells from which T-ALL often originates. T-cell development progresses in the thymus through a series of stages from the early T-lineage progenitor (ETP), through the double-negative (DN) stages (DN2-DN4) to the immature single-positive (ISP) and CD4+CD8+ double-positive (DP) stages, and then to the single-positive (SP) CD4+ or CD8+ stages. Notch1 target gene expression rises to very high levels in DN3 cells in order to drive proliferation and progression to the DP stage5-12 (reviewed in Rothenberg et al13 ). After the DN3 stage, Notch1 signaling drops. This critical phase of T-cell development is here described as the DN-DP transition. Because Zmiz1 expression is highest in DN3 cells, Zmiz1 is temporally well positioned to help Notch1 promote the DN-DP transition.14 Using a conditional mouse model in which Zmiz1 was deleted with the Mx1Cre transgene, we previously showed that inactivation of Zmiz1 caused an ETP defect.4 However, it remained unclear whether Zmiz1 enhances Notch1 signals during T-cell development, particularly with regard to the DN3 stage, which lies well past the ETP stage.
To address a possible contribution of Zmiz1 to Notch1-dependent stages of T-cell development, we bred conditional Zmiz1 mutant mice to mice bearing the LckCre, CD4Cre, or VavCre transgenes. As observed in Notch knockout mice, deletion of Zmiz1 in DN3 cells by LckCre impaired the DN-DP transition, whereas deletion at a later stage using CD4Cre had no apparent effect. In DN3 cells, Zmiz1 coregulated ∼20% of Notch1 target genes with induction of the Myc pathway as a dominant and functional contribution. In contrast, earlier deletion by VavCre generated perturbations of ETP differentiation and gene expression that seemed inconsistent with loss-of-Notch1 function. We identified mutations in Zmiz1 that impaired binding to Notch1, Myc induction, the DN-DP transition, and T-ALL proliferation. Our data suggest that Zmiz1 does not aberrantly regulate Notch in leukemia. Rather, Zmiz1 is a stage and context-specific Notch cofactor that promotes normal Myc-driven pre–T-cell proliferation and whose activity is hijacked during leukemogenesis.
Methods
Mice
Zmiz1f/f, Zmiz1ΔMx1Cre (ΔMx1Cre), and Zmiz1ΔRosa26CreERT2 (ΔTamCre) mice were previously described.4 Notch1f/f mice15 and VavCre (also known as “Vav1-icre”) mice were obtained from The Jackson Laboratory. LckCre and CD4Cre mice were obtained from Taconic Biosciences. Experiments were performed according to National Institutes of Health guidelines with an approved protocol from the institutional animal care and use committee at the University of Michigan (PRO00007831).
Antibodies
Antibodies used were as follows: ICN1 (Val1744 epitope, D3B8; Cell Signaling Technology), Rbpj (5313; Cell Signaling Technology), Flag (F1804; Sigma-Aldrich), hemagglutinin (HA) (3725; Cell Signaling Technology), β-actin (A5316; Sigma-Aldrich), and rabbit immunoglobulin G (IgG) isotype control (2729; Cell Signaling Technology); Notch1 (D1E11; Cell Signaling Technology) and Zmiz1 (AP6236a; R&D Systems). The anti-Notch1 NRR antibody and isotype control were kindly provided by Christian Siebel (Genentech).
Flow cytometry
Flow cytometry antibodies were obtained from Biolegend or eBioscience. Samples were analyzed on a LSR Fortessa flow cytometer or sorted using a FACSAria II (BD Biosciences). Clones are: Sca-1 (E13-161.7), CD4 (RM4-5), LNGFR (ME20.4-1.H4), c-Kit (2B8), CD28 (E18), CD45 (30-F111), CD44 (IM7), CD25 (PC61.5), CD27 (LG.3A10), and AA4.1 (AA4.1). Lineage cocktail clones were as follows: B220 (RA3-6B2), CD11b (MI/70), CD11c (HL3), CD19 (1D3), CD3ε (145-2C11), CD8a (53-6.7), CD8b.2 (53-5.8), Gr-1 (RB6-8C5), NK1.1 (PK136), T-cell receptor β (TCRβ; H57-597), TCRγδ (GL3), and Ter119 (Ly-76). Dead cells were excluded using 7-aminoactinomycin D (7-AAD) or 4′,6-diamidino-2-phenylindole (DAPI). Cell cycle analysis was performed by staining with 7-AAD solution/anti-5-bromo-2′-deoxyuridine (BrdU) antibody (APC; Becton Dickinson) or DAPI/Click-iT Plus (Alexa Fluor 647; Thermo Fisher Scientific) according to the manufacturer’s protocol. Data were analyzed using FlowJo (Tree Star).
RNA sequencing
Five- to 8-week-old Mx1Cre mice were injected intraperitoneally with 10 mg/kg anti-Notch1 NRR antibody or isotype IgG control (3 independent pools of mice). DN3 cells were sorted 24 hours postinjection. TamCre and TamCre+Zmiz1f/f mice (4 independent pools of mice) were injected intraperitoneally with 0.2 mg/g tamoxifen. ETP and DN3 cells were sorted 43 to 44 hours postinjection. Deletion efficiency was confirmed to be >99% by quantitative polymerase chain reaction (qPCR). Mx1Cre and Mx1Cre+Zmizf/f mice (3 independent pools of mice) were injected intraperitoneally with 40 μg of pI-pC every 2 days for 5 times. ETP and DN3 cells were sorted at 8 weeks postinjection. RNA samples with RNA integrity numbers of 8 or greater according to the Bioanalyzer (Agilent) were used to generate libraries by the University of Michigan Sequencing Core. The libraries were multiplexed, and the final library pools were clustered on the cBot (Illumina) and sequenced on a 50-cycle single-end run on a HiSeq 2500 (with V4 reagents) or 4000 (Illumina) in High Output mode according to the manufacturer’s protocols. The University of Michigan Bioinformatics Core used the Tuxedo Suite for alignment to the reference transcriptome (UCSC mm10), differential expression analysis, and postanalysis diagnostics.16-18
Retroviral transduction and culture of LSK and DN3 cells on OP9-DL1 feeders
Results
Deletion of Zmiz1 impairs the DN-DP transition during steady-state thymopoiesis
To investigate whether Zmiz1 is important for the DN-DP transition, we crossed our Zmiz1f/f mice with LckCre transgenic mice to generate control LckCre+ and LckCre+Zmiz1f/f mice (hereafter referred to as “Zmiz1ΔLckCre” or “ΔLckCre”). Zmiz1 deletion was >80% by the DN3b stage (supplemental Figure 1A-D, available on the Blood Web site). ΔLckCre mice showed an approximately twofold decrease in total thymocytes compared with controls, beginning at the DN4 stage (Figure 1A-B). We compared these data to 3 published mouse models of LckCre-induced Notch deficiency (LckCre+Notch1f/f6, LckCre+Rbpjf/f9, and LckCre+Rosa26-lox-stop-lox-DNMAML5 ). Similar to ΔLckCre mice, the reduction in absolute thymocyte number in LckCre+Rbpjf/f mice appears to begin at the DN4 stage. In contrast, the drop in absolute numbers seems to occur at the slightly later ISP stage in the LckCre+Notch1f/f mice. Differences among the Notch-deficient mouse models may be related to differential effects on survival and expression of Il2ra5 (also see “Zmiz1 coregulates a subset of Notch1 target genes”).
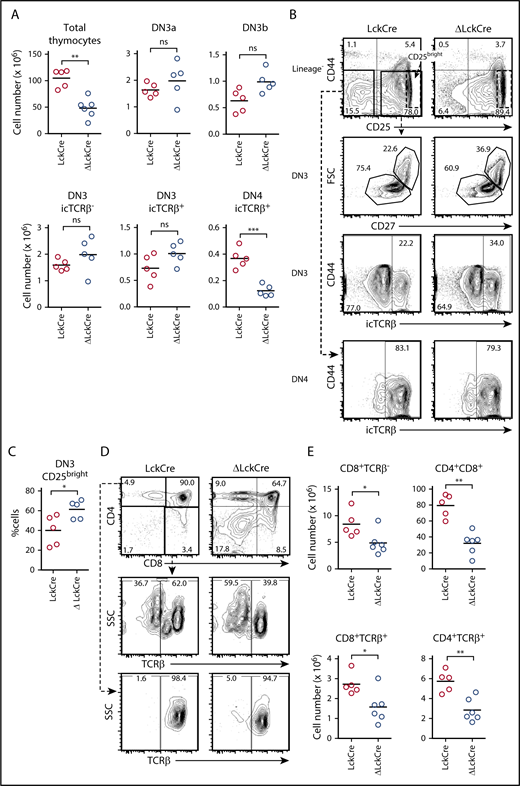
Deletion of Zmiz1 inhibits the DN-DP transition. (A-B) Absolute numbers of total thymocytes and DN thymic subsets (A) and representative flow cytometry profiles (B) of LckCre and Zmiz1ΔLckCre (ΔLckCre) mice. (C) The percentage of CD25bright cells in the DN3 compartment is indicated as outlined in the black dotted box in panel B. (D-E) Representative flow cytometry profiles (D) and absolute numbers (E) of CD4/CD8 thymic subsets. Mice were between 5 and 8 weeks of age. Horizontal lines indicate means. *P < .05; **P < .01; ***P < .001. Two sample Student t test. DN3a = lineage−CD44−CD25+FSCloCD27−; DN3b = lineage−CD44−CD25+FSChiCD27+; DN4 = lineage−CD44−CD25−icTCRβ+; immature single positive (ISP) = CD8+TCRβ−. FSC, forward scatter; ns, not significant; SSC, side scatter.
Deletion of Zmiz1 inhibits the DN-DP transition. (A-B) Absolute numbers of total thymocytes and DN thymic subsets (A) and representative flow cytometry profiles (B) of LckCre and Zmiz1ΔLckCre (ΔLckCre) mice. (C) The percentage of CD25bright cells in the DN3 compartment is indicated as outlined in the black dotted box in panel B. (D-E) Representative flow cytometry profiles (D) and absolute numbers (E) of CD4/CD8 thymic subsets. Mice were between 5 and 8 weeks of age. Horizontal lines indicate means. *P < .05; **P < .01; ***P < .001. Two sample Student t test. DN3a = lineage−CD44−CD25+FSCloCD27−; DN3b = lineage−CD44−CD25+FSChiCD27+; DN4 = lineage−CD44−CD25−icTCRβ+; immature single positive (ISP) = CD8+TCRβ−. FSC, forward scatter; ns, not significant; SSC, side scatter.
Similar to Notch-deficient mice, ΔLckCre mice showed an increased CD25bright DN3 population (Figure 1B-C dotted box). This phenotype was shown to be non-cell autonomous.5 High CD25 expression has also been associated with impaired pre–TCR signaling leading to expression of multiple TCRβ chains in a single cell.21,22 However, we did not detect expression of multiple TCRβ chains in Zmiz1-deficient mice (supplemental Figure 1A,E-F). The DN3 cells in LckCre+Rosa26-lox-stop-lox-DNMAML mice5 and LckCre+Rbpjf/f mice9 show impaired transition into S-phase. We observed a similar defect in DN3b cells of ΔLckCre mice (supplemental Figure 1G-H). Similar to Notch-deficient mice,5 we did not observe any effects on AnnexinV+ cells (Q. Wang and M.Y.C., unpublished flow cytometric data of DN3 cells).
As also observed in Notch-deficient mice, the ΔLckCre mice showed reduced percent and absolute numbers of DP cells, indicating a defect in the DN-DP transition (Figure 1D-E). Similar to the Notch-deficient mice, there was no effect on γδ T-cell numbers (supplemental Figure 1I-J). In contrast to Notch1-deficient mice,6 Zmiz1 loss did not clearly reduce V-to-DJβ rearrangement (supplemental Figure 2). Loss of Zmiz1 caused an approximately twofold reduction in splenic T cells (supplemental Figure 3A-B). Finally, similar to experiments using Notch-deficient mice,9,23,24 we did not observe any obvious defects when we crossed our Zmiz1f/f mice with the CD4Cre transgene (supplemental Figure 4). Altogether, Notch-deficient and Zmiz1-deficient mice show several similarities.
Zmiz1 promotes thymic regeneration after irradiation
To test the importance of Zmiz1 during stress thymopoiesis, we sublethally irradiated ΔLckCre mice (Figure 2A-B). ΔLckCre mice showed approximately sixfold reduction in total thymocytes compared with control mice (Figure 2C-E). The difference between absolute numbers of DP cells in LckCre and ΔLckCre mice was much larger (approximately eightfold; Figure 2F-G) than during steady state (approximately twofold; Figure 1D-E). ΔLckCre DN3b cells showed significantly impaired transition into S-phase (Figure 2H-I). Further, DN3 cells upregulate Zmiz1 and Myc expression after sublethal irradiation (Figure 2J). Thus, Zmiz1 might be recruited when urgently needed to help drive T-cell recovery.
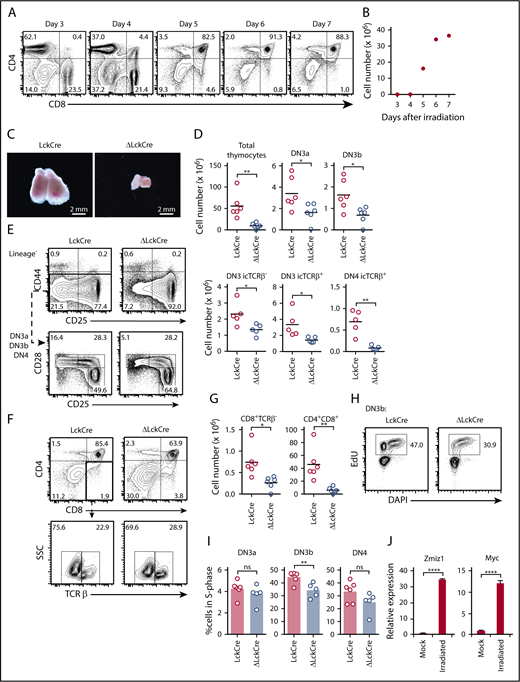
Deletion of Zmiz1 inhibits thymocyte recovery after sublethal irradiation. (A-B) Flow cytometric profiles of CD4/CD8 thymic subsets (A) and absolute number of thymocytes (B) on the indicated days after sublethal irradiation (450 rad). (C-G) Representative images of thymuses (C); absolute numbers of total thymocytes and DN thymic subsets (D); representative flow cytometry profiles of DN subsets (E); representative flow cytometry profiles of CD4/CD8 thymic subsets (F); and absolute numbers of CD4/CD8 thymic subsets (G) of LckCre and Zmiz1ΔLckCre (ΔLckCre) mice at 6 days after sublethal irradiation. (H-I) Representative flow cytometric plots of DN3b cells (H) and scatterplots of DN3a, DN3b, and DN4 (I) analyzed for 5-ethynyl-2'-deoxyuridine (EdU) vs DAPI in LckCre and ΔLckCre mice. Mice were injected with EdU at 3 hours prior to analysis. (J) qPCR showing Zmiz1 and Myc transcripts in sorted DN3 cells on day 6 after sublethal irradiation relative to mock irradiation (N = 3). Mice were irradiated at 5 to 8 weeks of age. *P < .05; **P < .01; ****P < .0001. Two sample Student t test. DN3a = lineage−CD44−CD25+CD28−; DN3b = lineage−CD44−CD25+CD28+; DN4 = lineage−CD44−CD25−CD28+icTCRβ+; ISP = CD8+TCRβ−. FC, fold change; FDR, false discovery rate; NES, normalized enrichment score; RNA-Seq, RNA sequencing.
Deletion of Zmiz1 inhibits thymocyte recovery after sublethal irradiation. (A-B) Flow cytometric profiles of CD4/CD8 thymic subsets (A) and absolute number of thymocytes (B) on the indicated days after sublethal irradiation (450 rad). (C-G) Representative images of thymuses (C); absolute numbers of total thymocytes and DN thymic subsets (D); representative flow cytometry profiles of DN subsets (E); representative flow cytometry profiles of CD4/CD8 thymic subsets (F); and absolute numbers of CD4/CD8 thymic subsets (G) of LckCre and Zmiz1ΔLckCre (ΔLckCre) mice at 6 days after sublethal irradiation. (H-I) Representative flow cytometric plots of DN3b cells (H) and scatterplots of DN3a, DN3b, and DN4 (I) analyzed for 5-ethynyl-2'-deoxyuridine (EdU) vs DAPI in LckCre and ΔLckCre mice. Mice were injected with EdU at 3 hours prior to analysis. (J) qPCR showing Zmiz1 and Myc transcripts in sorted DN3 cells on day 6 after sublethal irradiation relative to mock irradiation (N = 3). Mice were irradiated at 5 to 8 weeks of age. *P < .05; **P < .01; ****P < .0001. Two sample Student t test. DN3a = lineage−CD44−CD25+CD28−; DN3b = lineage−CD44−CD25+CD28+; DN4 = lineage−CD44−CD25−CD28+icTCRβ+; ISP = CD8+TCRβ−. FC, fold change; FDR, false discovery rate; NES, normalized enrichment score; RNA-Seq, RNA sequencing.
Zmiz1 coregulates a subset of Notch1 target genes
To identify mechanisms, we performed RNA-Seq on DN3 cells from ΔMx1Cre mice and Rosa26CreERT2+Zmiz1f/f (“ΔTamCre”) mice (Figure 3A). We used Mx1Cre and TamCre deletion to assess the effects of Zmiz1 deletion on both DN3 cells and ETP cells harvested from the same mice at the same time at both late and early time points upon Zmiz1 withdrawal. This strategy has a distinct advantage for deleting Zmiz1 with high efficiency and for assessing stage-specific functions of Zmiz1. Because the DN3 stage is when Zmiz1 expression first falls (supplemental Figure 1D) and when proliferation is inhibited (supplemental Figure 1G-H) upon Zmiz1 deletion by LckCre, the gene expression changes in DN3 cells would be expected to include changes that inhibit DN3 proliferation. To distinguish Notch1-dependent from Notch1-independent target genes of Zmiz1, we performed RNA-Seq on DN3 cells from mice injected with an inhibitory Notch1 antibody (“Anti-Notch1”, Figure 3A).25 This antibody is similarly potent as genetic deletion of Notch126 or Rbpj27 (supplemental Figure 5). Zmiz1 regulated 20% or 18% of Notch1 target genes in the ΔTamCre or ΔMx1Cre data sets respectively (supplemental Figure 6A). Conversely, Notch1 regulated 24% or 26% of Zmiz1 target genes in the ΔTamCre or ΔMx1Cre data sets respectively (supplemental Figure 6B). Zmiz1 cooperatively regulated 84% or 69% of shared Notch1 target genes in the ΔTamCre or ΔMx1Cre data sets respectively (supplemental Figure 6C). Analysis of 3 × 3 tables showed fourfold to sevenfold higher-than-expected regulation in the same direction in both data sets (supplemental Figure 6D-E). We noted smaller but significant overlaps with γ-secretase inhibitor (GSI)-regulated target genes after performing similar analyses with published data (supplemental Figures 7 and 8).28 Zmiz1 regulated the majority of shared Notch1 target genes in the same (cooperative) direction, but regulated a small number in the opposite direction. These data indicate that Zmiz1 has context-specific roles and does not enhance Notch effects generally.
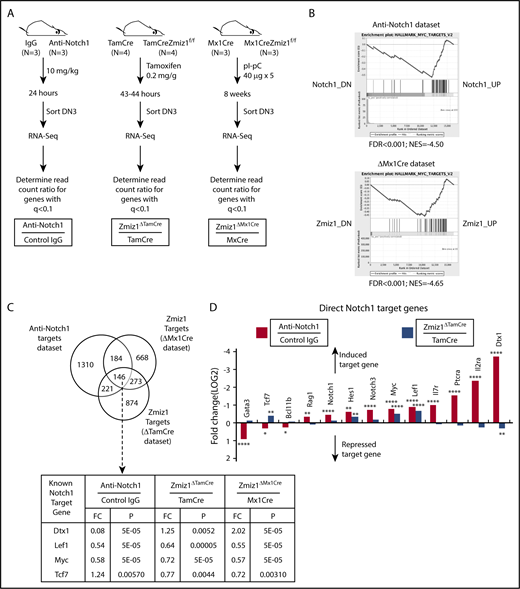
Zmiz1 and Notch1 coregulate a subset of target genes. (A) Schematic of the strategy used to harvest DN3 cells deprived of Notch1 or Zmiz1 signals. Notch1 target genes were defined as q < 0.1 for the comparison of fragments per kilobase of transcript per million mapped (FPKM) read counts at 24 hours after injection between 10 mg/kg anti-Notch1 antibody (Genentech) and isotype control IgG (“Notch1 data set”). Zmiz1 target genes were defined as q < 0.1 for the comparison of read counts at 43 to 44 hours after injection of 0.2 mg/g tamoxifen between Zmiz1ΔTamCre mice and TamCre mice (“ΔTamCre data set”). Zmiz1 target genes were also defined as q < 0.1 for the comparison of read counts at 8 weeks after pI-pC injection (40 μg × 5 doses) between Zmiz1ΔMx1Cre mice and Mx1Cre mice (“ΔMx1Cre data set”). (B) Gene set enrichment analysis (GSEA) analysis plots of genes enriched in the class H MSigDB data set HALLMARK_MYC_TARGETS_V2 (Myc-induced genes) for the Notch1 data set or the ΔMx1Cre data set. The genes are ranked from highest fold change on the left (Notch1_DN or Zmiz1_DN) to lowest fold change on the right (Notch1_UP or Zmiz1_UP). (C) Venn diagram of differentially expressed genes resulting from Notch1 inhibition or Zmiz1 deletion in panel A. Known Notch1 direct target genes in the intersection with known importance for the DN-DP transition are shown. (D) Fold change of known direct Notch1 target genes in the Notch1 data set (red columns) and the ΔTamCre data set (blue columns). The y-axis (fold change) is inverted so that target genes that are induced by Notch1 or Zmiz1 go up from the horizontal axis and target genes that are repressed go down from the horizontal axis. *P < .05; **P < .01; ****P < .0001. TamCre = Rosa26CreERT2.
Zmiz1 and Notch1 coregulate a subset of target genes. (A) Schematic of the strategy used to harvest DN3 cells deprived of Notch1 or Zmiz1 signals. Notch1 target genes were defined as q < 0.1 for the comparison of fragments per kilobase of transcript per million mapped (FPKM) read counts at 24 hours after injection between 10 mg/kg anti-Notch1 antibody (Genentech) and isotype control IgG (“Notch1 data set”). Zmiz1 target genes were defined as q < 0.1 for the comparison of read counts at 43 to 44 hours after injection of 0.2 mg/g tamoxifen between Zmiz1ΔTamCre mice and TamCre mice (“ΔTamCre data set”). Zmiz1 target genes were also defined as q < 0.1 for the comparison of read counts at 8 weeks after pI-pC injection (40 μg × 5 doses) between Zmiz1ΔMx1Cre mice and Mx1Cre mice (“ΔMx1Cre data set”). (B) Gene set enrichment analysis (GSEA) analysis plots of genes enriched in the class H MSigDB data set HALLMARK_MYC_TARGETS_V2 (Myc-induced genes) for the Notch1 data set or the ΔMx1Cre data set. The genes are ranked from highest fold change on the left (Notch1_DN or Zmiz1_DN) to lowest fold change on the right (Notch1_UP or Zmiz1_UP). (C) Venn diagram of differentially expressed genes resulting from Notch1 inhibition or Zmiz1 deletion in panel A. Known Notch1 direct target genes in the intersection with known importance for the DN-DP transition are shown. (D) Fold change of known direct Notch1 target genes in the Notch1 data set (red columns) and the ΔTamCre data set (blue columns). The y-axis (fold change) is inverted so that target genes that are induced by Notch1 or Zmiz1 go up from the horizontal axis and target genes that are repressed go down from the horizontal axis. *P < .05; **P < .01; ****P < .0001. TamCre = Rosa26CreERT2.
To identify the top downstream pathways of Zmiz1, we performed MSigDB enrichment analysis. This analysis showed that the Myc-regulated gene list was the #1 or #2 most enriched list for both the ΔTamCre and ΔMx1Cre data sets of 50 (H) or 189 (C6) lists (supplemental Tables 1-4). Furthermore, enrichment analysis using the C3 database showed that the list of target genes containing at least 1 Myc-binding motif (CACGTG) was the most enriched list (#1 out of 836 lists) for both the ΔTamCre and ΔMx1Cre data sets (supplemental Tables 5-6). We confirmed Myc pathway enrichment using GSEA (Figure 3B). Three different enrichment analyses also show that Myc activation is the #1 ranked contribution of Notch1 in DN3 cells (supplemental Tables 7-9). Thus, both Notch1 and Zmiz1 appear to induce Myc in DN3 cells as a primary function.
We identified 146 differentially expressed genes that were shared among the 3 data sets (Figure 3C). We also found the classic Notch target gene Hes1 in the ΔTamCre data set (Figure 3D). Our data suggest that Tcf7 and Gata3 are repressed by Notch1 signals in DN3 cells (Figure 3D). Previous studies report that Notch seems to slightly repress Gata3 messenger RNA (mRNA) in DN3 cells, but does not seem to regulate Tcf7 mRNA in DN3 cells29 (also R.K. and M.Y.C., unpublished analysis of GSE4609128 ) as it does in earlier precursors.30,31 The differential effects of Notch1 and Zmiz1 on gene expression likely contribute to the slightly different phenotypes of the Notch-deficient and Zmiz1-deficient mice. For example, Il2ra, which encodes CD25, is a direct Notch1 target gene5 (Figure 3D). Downregulation of CD25/Il2ra expression in DN3 cells is thought to explain why LckCre+Notch1f/f23, LckCre+Rbpjf/f9, and LckCre+Rosa26-lox-stop-lox-DNMAML5 mice accumulate icTCRβ−DN3-DN4 cells, albeit to varying degrees.5 In contrast, Zmiz1 withdrawal had no effect on Il2ra (Figure 3D). This might explain why Zmiz1 withdrawal did not enrich the percentage of icTCRβ−DN3-DN4 cells (Figure 1B).
Enforced expression of activated Notch1 or Myc partially rescues the DN-DP defect
Our next goal was to identify genes/pathways that contribute to the Zmiz1-dependent DN-DP defect. Zmiz1 regulates several Notch-independent genes (supplemental Table 10). To help guide our investigation toward these genes or toward Notch-dependent genes, we attempted to overcome this defect by ectopic expression of ICN1, a very strong gain-of-function NOTCH1 allele. High concentrations of ICN1 might have reduced need for cofactors. Accordingly, ICN1 partly rescued the DN-DP defect compared with the Zmiz1-positive control (Figure 4A-D). The effect of ICN1 in promoting a CD4−CD8+ phenotype was also observed, though to lesser degree, in the controls and variably in other reports20,32 (supplemental Figure 9A-C). Based on the partial rescue by ICN1, we focused on the Notch1-regulated Zmiz1 target genes. In particular, Myc,2,33-37 Lef1,38 and Hes18,34 (Figure 3C-D) are important for the DN-DP transition. We also selected Tcf7,30,31 as it was regulated by Zmiz1 (Figure 3C-D) and known to cooperate with Lef1.39,40 The expression of Tcf7 and Lef1 rises between the ETP and DP stages and then slightly decreases.31 Hes1 expression is relatively high between the ETP and DN3a stages and then decreases.13 Myc protein expression rises from DN1 to DN3, increases with pre–TCR stimulation, and then decreases at the DP stage.35,41 Enforced expression of Myc in Zmiz1-deficient DN3 cells partially rescued DP T-cell production (Figure 4E-G; supplemental Figure 10A-C). In contrast, enforced expression of Lef1, Tcf7, or Hes1 blocked or showed only modest rescue (supplemental Figure 10A-F). Thus, our data suggest that Notch1 and Myc make major contributions to the Zmiz1-dependent DN-DP defect whereas Hes1, Lef1, and Tcf-1 do not.
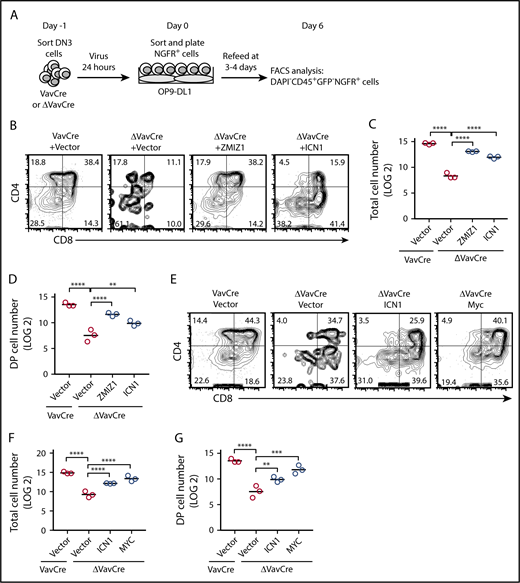
Enforced expression of activated Notch1 or Myc partially rescued the DN-DP transition defect following Zmiz1 deprivation. (A) Schematic cartoon showing the DN3 cell rescue experiments using the OP9-DL1 culture assay. Murine stem cell virus–based retroviral vectors contain complementary DNA (cDNA) of genes cloned 5′ to the internal ribosome entry site (IRES) sequence followed by the nerve growth factor receptor (NGFR) marker. OP9-DL1 cells are green fluorescent protein positive (GFP+). (B-G) Representative CD4/CD8 flow cytometry plots (B,E), absolute total cell number counts (C,F), and DP (CD4+CD8+) cell counts (D,G) of transduced cells after 6 days of culture in the OP9-DL1 assay described in panel A. Cells counts are shown for 1000 seeded NGFR+ DN3 cells. One-way analysis of variance (ANOVA) on log2-transformed values. **P < .01; ****P < .0001.
Enforced expression of activated Notch1 or Myc partially rescued the DN-DP transition defect following Zmiz1 deprivation. (A) Schematic cartoon showing the DN3 cell rescue experiments using the OP9-DL1 culture assay. Murine stem cell virus–based retroviral vectors contain complementary DNA (cDNA) of genes cloned 5′ to the internal ribosome entry site (IRES) sequence followed by the nerve growth factor receptor (NGFR) marker. OP9-DL1 cells are green fluorescent protein positive (GFP+). (B-G) Representative CD4/CD8 flow cytometry plots (B,E), absolute total cell number counts (C,F), and DP (CD4+CD8+) cell counts (D,G) of transduced cells after 6 days of culture in the OP9-DL1 assay described in panel A. Cells counts are shown for 1000 seeded NGFR+ DN3 cells. One-way analysis of variance (ANOVA) on log2-transformed values. **P < .01; ****P < .0001.
The TPR domain of Zmiz1 is important for the DN-DP transition
The main known structural domains of Zmiz1 are the TPR, which binds Notch14 ; the MIZ domain, which has protein-protein interaction and sumoylation functions42-44 ; and the transcriptional activation domain (TAD)43 (supplemental Figure 11A). Endogenous Zmiz1 and Notch1 proteins interact in forward and reverse co-IP (supplemental Figure 11B-C). It is possible that Zmiz1 might drive the DN-DP transition without needing to physically interact with Notch1. However, enforced expression of ΔTPR failed to rescue the DN-DP defect (supplemental Figure 11D-F). In contrast, enforced expression of the TPR+N2+TAD construct fully rescued the defect (supplemental Figure 11D-F). Thus, the MIZ domain is dispensable for the DN-DP transition. Importantly, Zmiz1 protein levels expressed by the ΔTPR construct were roughly similar to endogenous Zmiz1 (supplemental Figure 11G). To orthogonally validate the importance of the TPR domain, we transduced wild-type DN3 cells with the TPR–discosoma species red fluorescent protein (DsRed) construct, which can suppress Notch1 transcriptional activity.4 Coimmunoprecipitation (Co-IP) using the anti-Flag antibody showed that TPR-DsRed reduced the binding of Zmiz1 to ICN1 by ∼62% (supplemental Figure 11H). Enforced expression of TPR-DsRed impaired the DN-DP transition (supplemental Figure 11I-K). This effect was weaker than the effect of removing Notch signals (supplemental Figure 12A-C). Taken together, these data show that Zmiz1 requires its TPR domain to drive the DN-DP transition.
The Zmiz1-Notch1 interaction requires R14 and E34 on the TPR domain and enhances Myc transcription
We previously used NMR to show that W38 of the TPR lies close to the binding interface with ICN1.4 R14 lies on the surface nearby W38 (Figure 5A). Mutating R14, but not T58 or A79, impaired the ability of Zmiz1 to amplify Notch1-driven transactivation (Figure 5B). Mutating another nearby residue E34, but not M4 or D37, had similar effects (Figure 5C-E). Co-IP using the anti-Flag antibody showed that Flag-TPRR14E pulled down ∼1% of the ICN1 pulled down by Flag-TPR (wild-type) (Figure 5F). TPRR14A/E34A had an intermediate effect (∼5% ICN1). Enforced expression of wild-type TPR suppressed the ability of Zmiz1 to enhance Notch1-driven transactivation (Figure 5G). However, the TPRR14A mutant and especially the TPRR14E mutant had impaired dominant-negative effects. We also observed similar co-IP results as in Figure 5F when using the full length R14E construct (Figure 5H). The R14A/E34A and R14E mutants were impaired in enhancing Myc expression (Figure 5I; supplemental Figures 11G and 12D-E). The reason for the variation in effect sizes between the HA and Flag constructs is unclear, but may be related to differences in expression (Pinnell et al4 and Y.L. and M.Y.C., unpublished western blot data). These data suggest that Zmiz1 must interact with Notch1 to enhance Myc transcription.
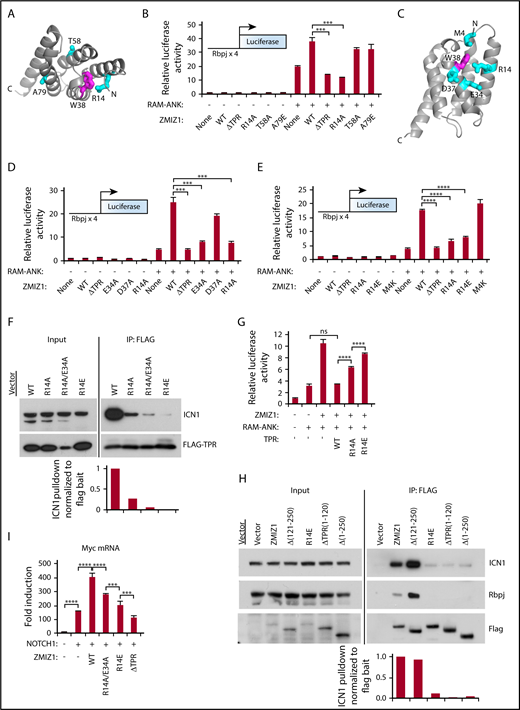
The Zmiz1-Notch1 interaction requires R14 and E34 of the TPR domain to enhance Myc transcripts. (A) Crystal structure of the TPR domain showing the locations of surface residues R14, T58, and A79 in cyan. The hydrophobic core residue W38 is colored in magenta. (B) Luciferase activity in U2OS cells transfected with 250-ng Notch-dependent (Rbpjx4) luciferase reporter, 100-ng Zmiz1 or Zmiz1 mutants, and 6-ng recombination signal binding protein for immunoglobulin kappa J region–associated module and ankyrin repeats (RAM-ANK) domains of ICN1 (N = 3). Data are relative to control cells. (C) Crystal structure of the TPR domain showing the locations of surface residues M4, R14, E34, and D37 (in cyan) that lie near the hydrophobic core residue W38 (in magenta). (D-E) Luciferase assays as in panel B (N = 3). (F) Co-IP using anti-Flag antibody in murine T-ALL 8946 cells transduced with Flag-TPR mutants (bait), and the activated NOTCH1 allele L1601PΔP64 to detect binding to the ICN1 target. Image J software was used to quantify the intensity of the ICN1 target bands divided by the bands of the Flag-TPR bait. Intensity values were normalized to the intensity of the ICN1 band in wild-type Flag-TPR–transduced cells. (G) Luciferase assay as in panel B, but including 100 ng of TPR mutants (N = 3). (H) Co-IP assay using anti-Flag antibody in #50 cells (C5, used in supplemental Figure 11G) transduced with Flag-Zmiz1 mutants (bait) to detect binding to the ICN1 and Rbpj targets. Image J software was used to quantify the intensity of the ICN1 target bands divided by the bands of the Flag-Zmiz1 bait. Intensity values were normalized to the intensity of the ICN1 band in wild-type Flag-Zmiz1–transduced cells. (I) qPCR for Myc transcripts in sorted 8946 cells transduced with L1601PΔP and indicated C-terminal HA-tagged Zmiz1 constructs. One-way ANOVA. *P < .05; **P < .01; ****P < .0001.
The Zmiz1-Notch1 interaction requires R14 and E34 of the TPR domain to enhance Myc transcripts. (A) Crystal structure of the TPR domain showing the locations of surface residues R14, T58, and A79 in cyan. The hydrophobic core residue W38 is colored in magenta. (B) Luciferase activity in U2OS cells transfected with 250-ng Notch-dependent (Rbpjx4) luciferase reporter, 100-ng Zmiz1 or Zmiz1 mutants, and 6-ng recombination signal binding protein for immunoglobulin kappa J region–associated module and ankyrin repeats (RAM-ANK) domains of ICN1 (N = 3). Data are relative to control cells. (C) Crystal structure of the TPR domain showing the locations of surface residues M4, R14, E34, and D37 (in cyan) that lie near the hydrophobic core residue W38 (in magenta). (D-E) Luciferase assays as in panel B (N = 3). (F) Co-IP using anti-Flag antibody in murine T-ALL 8946 cells transduced with Flag-TPR mutants (bait), and the activated NOTCH1 allele L1601PΔP64 to detect binding to the ICN1 target. Image J software was used to quantify the intensity of the ICN1 target bands divided by the bands of the Flag-TPR bait. Intensity values were normalized to the intensity of the ICN1 band in wild-type Flag-TPR–transduced cells. (G) Luciferase assay as in panel B, but including 100 ng of TPR mutants (N = 3). (H) Co-IP assay using anti-Flag antibody in #50 cells (C5, used in supplemental Figure 11G) transduced with Flag-Zmiz1 mutants (bait) to detect binding to the ICN1 and Rbpj targets. Image J software was used to quantify the intensity of the ICN1 target bands divided by the bands of the Flag-Zmiz1 bait. Intensity values were normalized to the intensity of the ICN1 band in wild-type Flag-Zmiz1–transduced cells. (I) qPCR for Myc transcripts in sorted 8946 cells transduced with L1601PΔP and indicated C-terminal HA-tagged Zmiz1 constructs. One-way ANOVA. *P < .05; **P < .01; ****P < .0001.
Disrupting the Zmiz1-Notch1 interaction impairs the DN-DP transition and T-ALL proliferation
To test whether Zmiz1 acts through its physical interaction with Notch1, we tested the effect of the R14E and R14A/E34A mutants in OP9-DL1 cultures. Initially, we avoided using the LckCre transgene as this transgene alone can significantly delay and impair generation of DP T cells both ex vivo and in mice45 (and Q.W. and M.Y.C, unpublished observations). We later used the LckCre transgene because enforced expression of wild-type Zmiz1 could robustly generate DP T cells (Figure 6A-C; supplemental Figure 10D-F). In contrast, mutant Zmiz1 could not (Figure 6A-C). Enforced expression of TPR-DsRed, but not TPRR14E-DsRed, impaired the DN-DP transition (Figure 6D-F). Further, R14E-transduced DN3 cells generated ∼12-fold fewer DP cells than wild-type Zmiz1-transduced DN3 cells after intrathymic injection (Figure 6G-H).
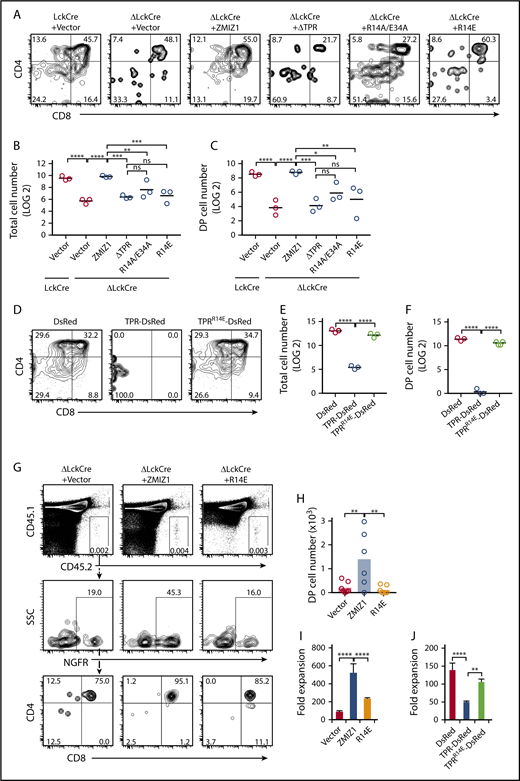
Disrupting the Zmiz1-Notch1 interaction impairs the DN-DP transition and T-ALL proliferation. (A-F) Representative CD4/CD8 flow cytometry plots (A,D), absolute total cell number counts (B,E), and DP (CD4+CD8+) cell counts (C,F) of transduced ΔLckCre cells after 6 days of culture in the OP9-DL1 assay described in Figure 4A. Cells counts are shown for 1000 seeded NGFR+ (A-C) or DsRed+ (D-F) DN3 cells. One-way ANOVA on log2-transformed values. (G-H) 20 000 transduced CD45.2+ DN3 cells were injected intrathymically into sublethally irradiated congenic CD45.1+ mice. After 10 days, the Dapi−CD45.2+CD45.1−NGFR+CD4+CD8+ (DP) cells were analyzed by flow cytometry (G) and shown as absolute numbers in scatterplot format (H). (I) Rosa26CreERT2+Zmiz1f/f T-ALL cells (#50 cells) were transduced with indicated Flag-tagged Zmiz1 mutants, sorted, and then cultured for with 6 nM 4-hydroxytamoxifen (OHT) for 6 days. Fold expansion represents the cell count on day 6 divided by day 0. (J) Rosa26CreERT2+Zmiz1f/f T-ALL cells (#50 cells, C5) were transduced with TPR-DsRed and cultured as in panel I. One-way ANOVA. *P < .05; **P < .01; ***P < .001; ****P < .0001.
Disrupting the Zmiz1-Notch1 interaction impairs the DN-DP transition and T-ALL proliferation. (A-F) Representative CD4/CD8 flow cytometry plots (A,D), absolute total cell number counts (B,E), and DP (CD4+CD8+) cell counts (C,F) of transduced ΔLckCre cells after 6 days of culture in the OP9-DL1 assay described in Figure 4A. Cells counts are shown for 1000 seeded NGFR+ (A-C) or DsRed+ (D-F) DN3 cells. One-way ANOVA on log2-transformed values. (G-H) 20 000 transduced CD45.2+ DN3 cells were injected intrathymically into sublethally irradiated congenic CD45.1+ mice. After 10 days, the Dapi−CD45.2+CD45.1−NGFR+CD4+CD8+ (DP) cells were analyzed by flow cytometry (G) and shown as absolute numbers in scatterplot format (H). (I) Rosa26CreERT2+Zmiz1f/f T-ALL cells (#50 cells) were transduced with indicated Flag-tagged Zmiz1 mutants, sorted, and then cultured for with 6 nM 4-hydroxytamoxifen (OHT) for 6 days. Fold expansion represents the cell count on day 6 divided by day 0. (J) Rosa26CreERT2+Zmiz1f/f T-ALL cells (#50 cells, C5) were transduced with TPR-DsRed and cultured as in panel I. One-way ANOVA. *P < .05; **P < .01; ***P < .001; ****P < .0001.
To test whether Zmiz1 drives leukemic proliferation through its physical interaction with Notch1, we transduced the R14E mutant into Rosa26CreERT2+Zmiz1f/f T-ALL cells. Enforced expression of R14E showed impaired rescue of leukemic proliferation (Figure 6I; supplemental Figure 12F). For orthogonal validation, we observed that enforced expression of TPR-DsRed also impaired proliferation (Figure 6J). In contrast, TPRR14E-DsRed had weaker anti-proliferative effects. Given that high levels of ICN1 can partially rescue the Zmiz1-deficient DN-DP defect (Figure 4B-G; supplemental Figure 10A-C), we wondered whether Zmiz1 inhibition might have greater antileukemic effects in the context of partial Notch inhibition. Accordingly, combining Zmiz1 deletion with reduced-dose GSIs had significant inhibitory effects on T-ALL proliferation in vitro (supplemental Figure 13A-C) and in vivo (supplemental Figure 13D-F). Further, enforced expression of R14E more significantly impaired leukemic proliferation compared with wild-type Zmiz1 in the context of GSI than dimethyl sulfoxide (DMSO) in vitro (supplemental Figure 13G-H) and in vivo (supplemental Figure 13I-J) by ANOVA (supplemental Figure 13K). Thus, ICN1 might depend more on Zmiz1 when its concentrations are limiting.
Early deletion of Zmiz1 generates an ETP defect that seems inconsistent with Notch1 loss of function
One of the major limitations of our previous analysis of Mx1Cre+Zmiz1f/f mice4 was the lack of evidence that Zmiz1 was enhancing Notch1 signals during T-cell development. To perform a more careful analysis of the Zmiz1-deficient ETP defect observed this study, we switched from Mx1Cre+Zmiz1f/f mice to VavCre+Zmiz1f/f mice because of the similar phenotype, but much more reliable and complete deletion of Zmiz1 (Figure 7A-B; supplemental Figures 1A and 14-15). Deletion of Zmiz1 seemed to drive loss of ETPs and commitment to the T-lineage in vivo and in vitro, with no ectopic B-cell development (supplemental Figure 15), which resembles the differentiation effects of Notch1 gain of function rather than loss of function26 (Figure 7A-E; supplemental Figure 14A-B). RNA-Seq analysis using a similar experimental design as depicted in Figures 3 and supplemental Figure 6 showed fewer overlapping Notch1 and Zmiz1 target genes in ETPs than in DN3 cells (Figure 7F-H). Further, chronic deletion of Zmiz1, but not acute deletion, led to upregulation of several Notch1 target genes (Figure 7I-J). This upregulation is consistent with the Notch1 gain-of-function differentiation phenotype observed by flow cytometry (Figure 7B-E). Notably, Zmiz1 might not regulate Myc in ETPs as it does in DN3 cells (red arrows, Figure 7J). Instead, Zmiz1 might restrain ETP differentiation. These data suggest a stage-specific role of Zmiz1 in ETPs that contrasts with its role in DN3 cells.
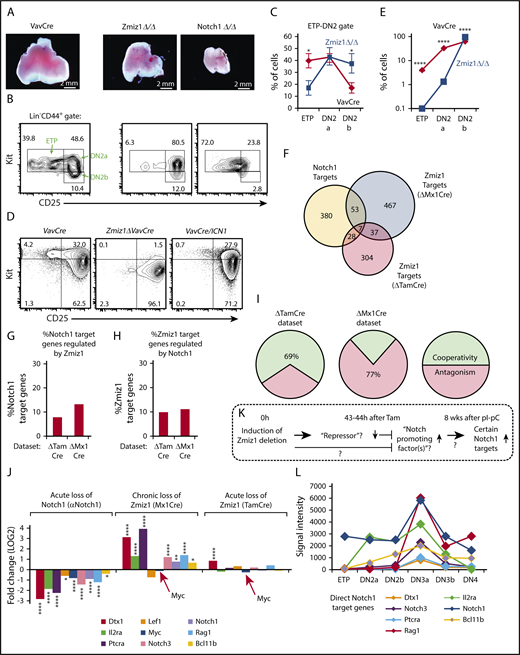
Effects of Zmiz1 deletion in ETPs were inconsistent with Notch1 loss of function. (A) Representative thymuses of VavCre control, Zmiz1ΔVavCre, and Notch1ΔVavCre mice. (B-C) Representative FACS plots of the ETP-DN2 transition (CD44+Lin−) (B) and relative cell numbers (C) showing shift to DN2 cells (red line) (N = 11 per group). (D-E) LSK BM precursors from VavCre or Zmiz1ΔVavCre mice were transduced with vector control or ICN1 and cultured on OP9-DL1 cells for 7 days. Representative fluorescence-activated cell sorting (FACS) plots (D) and relative cell numbers (E) of transduced DAPI−CD45+GFP−CD44+Lin− cells showing shift to DN2 cells (red line) similar to Notch1 gain of function (panel D rightmost FACS plot) (N = 3 per group). (F-J) RNA-Seq analysis on sorted ETPs was performed using similar strategy and analysis as described in Figure 3 and supplemental Figure 6. Target genes were defined as FC > 1.25, P < .01. Overlaps of Notch1- and Zmiz1-regulated genes are shown in Venn (F) or column (G-H) formats with cooperativity or antagonism of shared genes shown in panel I. (J) Fold change of known direct Notch1 target genes during T-cell development. Red arrows identify Myc. (K) Working model of possible Zmiz1 functions in ETPs. (L) Microarray data (www.immgen.org)65 showing that the Notch1 target genes in panel J, except Myc and Lef1 (which are not regulated by Zmiz1 in ETPs), increase >2× at DN3a and then decrease >2× at DN3b. Two sample Student t test. *P < .05; **P < .01; ****P < .0001.
Effects of Zmiz1 deletion in ETPs were inconsistent with Notch1 loss of function. (A) Representative thymuses of VavCre control, Zmiz1ΔVavCre, and Notch1ΔVavCre mice. (B-C) Representative FACS plots of the ETP-DN2 transition (CD44+Lin−) (B) and relative cell numbers (C) showing shift to DN2 cells (red line) (N = 11 per group). (D-E) LSK BM precursors from VavCre or Zmiz1ΔVavCre mice were transduced with vector control or ICN1 and cultured on OP9-DL1 cells for 7 days. Representative fluorescence-activated cell sorting (FACS) plots (D) and relative cell numbers (E) of transduced DAPI−CD45+GFP−CD44+Lin− cells showing shift to DN2 cells (red line) similar to Notch1 gain of function (panel D rightmost FACS plot) (N = 3 per group). (F-J) RNA-Seq analysis on sorted ETPs was performed using similar strategy and analysis as described in Figure 3 and supplemental Figure 6. Target genes were defined as FC > 1.25, P < .01. Overlaps of Notch1- and Zmiz1-regulated genes are shown in Venn (F) or column (G-H) formats with cooperativity or antagonism of shared genes shown in panel I. (J) Fold change of known direct Notch1 target genes during T-cell development. Red arrows identify Myc. (K) Working model of possible Zmiz1 functions in ETPs. (L) Microarray data (www.immgen.org)65 showing that the Notch1 target genes in panel J, except Myc and Lef1 (which are not regulated by Zmiz1 in ETPs), increase >2× at DN3a and then decrease >2× at DN3b. Two sample Student t test. *P < .05; **P < .01; ****P < .0001.
Discussion
When progenitors first enter the thymus, Notch1 signal strength is relatively low. After T-cell commitment, at the DN3 stage, Notch1 signaling must rise to high levels to promote pre–T-cell proliferation. How are Notch signals amplified? One mechanism is that Notch1 directly autoinduces its transcription.11 In addition, our data suggest that cofactors like Zmiz1 might be recruited to some Notch1 response elements to amplify transcriptional output. Deletion of Zmiz1 caused defects in the DN-DP transition that resemble the defects observed in Notch-deficient mouse models. Although we previously showed that deletion of Zmiz1 caused ETP defects that also seemed to resemble the ETP defects observed in Notch-deficient mice,4 our current study shows that these defects do not resemble Notch1 loss of function upon closer examination. Rather, with regard to lineage differentiation, they resemble Notch1 gain of function. These data led us to a working model of Zmiz1 acting as an indirect repressor of certain Notch1 target genes in ETPs (Figure 7K). This might help explain why certain T-lineage–related Notch1 target genes are low in ETPs and then spike after T-cell commitment at the DN3 stage13 (Figure 7L). We are currently investigating the mechanism. Nevertheless, our data suggest that Zmiz1 has stage- and context-specific functions as a Notch cofactor. It might be required for Notch-driven proliferation events during the ETP-DN2 and β-selection stages, but is dispensable for (or might even restrain) Notch-mediated lineage decisions.
Normal DN3 cells and their human equivalents are particularly susceptible to transformation based on mouse models46 and observations in human T-ALL.47 Interestingly, the role of Zmiz1 seems to acquire complexity after transformation of DN3 cells to T-ALL. In T-ALL, we found that Zmiz1 target genes were highly enriched but not the most enriched for Myc target genes.14 Further, Myc activity was required for proliferation, but enforced Myc expression was not sufficient to rescue the antiproliferative effects upon loss of Zmiz1.14 Thus, in T-ALL, Zmiz1 contributes unknown factors besides Myc. In contrast, in DN3 cells, enrichment analyses suggest that Myc pathway activation is a dominant contribution of Zmiz1. Accordingly, enforced expression of Myc partially rescued the Zmiz1-deficient DN-DP defect. Three different enrichment analyses also showed that the Myc pathway was #1 ranked for Notch-induced genes, suggesting that helping restore Myc activity is one plausible explanation of how enforced expression of activated Notch1 partially rescued the Zmiz1-deficient DN-DP defect. We cannot rule out the alternative explanation that activated Notch1 “pushes” DN3 cells. We note that enforced ICN1 or Myc expression did not provide perfect phenotypic rescue. It is possible that other yet-to-be-identified pathways downstream of Zmiz1, perhaps some of the ones listed in supplemental Tables 1-6, make additional contributions, which when integrated with the contributions of Notch1-Myc, would provide perfect phenotypic rescue. Regardless, our current study, combined with our previous one,4 suggests that while not enhancing Notch functions generally, Zmiz1 has a major role as a Notch cofactor for Myc-driven thymocyte proliferation. Based on these 2 studies, we propose that the Zmiz1-Notch1 interaction for Myc induction in T-ALL did not originate during T-cell development in ETP cells. Rather, the interaction originated in pre–T cells.
Compared with normal thymopoiesis, Zmiz1 rises in importance during stress thymopoiesis. The expression of Zmiz1 and its target gene Myc surged in regenerating DN3 cells in response to irradiation. Enforced expression of Zmiz1 promoted in vitro thymopoiesis by ∼1.8-fold (supplemental Figure 9A-B). Stimulation of Notch signaling is being studied as a strategy to regenerate the T-lineage after bone marrow transplantation.48-50 We propose that controlled activation of Zmiz1 might also aid regeneration.
Although our experiments led us to investigate the role of Zmiz1 in Notch signaling, we have been mindful to consider its Notch-independent functions. We used a specific anti-Notch1 antibody25 to separate Zmiz1-regulated genes into Notch1-dependent and Notch1-independent classes. Many of the top-ranked Notch1-independent genes based on fold change (supplemental Table 10) have no role in T-cell development based on knockout mouse studies,51-61 but some do.62,63 We note that none of the top 20 Notch1-regulated genes (supplemental Table 11) have been shown to contribute to the DN-DP transition. Our previous study showed that Zmiz1 binds a subset of response elements independently of Notch1/Rbpj.4 Furthermore, our motif analysis4 suggested that other transcriptional regulators cobind Zmiz1-regulated response elements. For these reasons, there are likely yet-to-be-identified Notch-independent factors that influence the magnitude and directionality of Zmiz1 transcriptional function for any given gene. These factors might explain the context-dependence of Zmiz1 function.
Our data show that mutating only 1 residue on the TPR disrupted the Zmiz1-Notch1 interaction. Thus, it might be possible to design small molecules that inhibit this interaction. However, because our previous study suggests that the TPR might interact with other proteins besides Notch1,4 we caution that such inhibitors might have unexpected toxicities. In summary, our studies point to a potential vulnerability in T-ALL cells that originated from a developmentally important protein-protein interaction in normal thymocytes.
The high-throughput sequencing data reported in this article have been deposited in the Gene Expression Omnibus database (accession number GSE116125).
The online version of this article contains a data supplement.
The publication costs of this article were defrayed in part by page charge payment. Therefore, and solely to indicate this fact, this article is hereby marked “advertisement” in accordance with 18 USC section 1734.
Acknowledgments
The authors thank Christelle Harly and Avinash Bhandoola for scientific advice and for teaching them how to perform intrathymic injections in their laboratory. The authors are grateful to Christian Siebel and Genentech for comments on the manuscript and for providing the anti-NRR Notch1 antibody and the isotype control. The authors are grateful to the University of Michigan Cancer Center and the Department of Internal Medicine, Hematology-Oncology.
This work was supported by the University of Michigan Cancer Center (National Institutes of Health [NIH] National Cancer Institute grant P30CA046592) and the following University of Michigan cores: Sequencing, Bioinformatics, Mouse Husbandry, and Flow Cytometry. M.Y.C. was supported by NIH National Cancer Institute grant R01CA196604, the Alex’s Lemonade Stand Foundation, the Rally Foundation for Childhood Cancer Research, and the Bear Necessities Pediatric Cancer Foundation. T.C. is a recipient of the Leukemia & Lymphoma Society Scholar Award (1340-17). A.C.M. was supported by NIH training grants T32-GM007315 (National Institute of General Medical Sciences) and 1F30CA228228-01 (National Cancer Institute). N.P. was supported by NIH National Cancer Institute Cancer Biology training grant T32-CA009676-22.
Authorship
Contribution: Q. Wang, R.Y., and A.C.M. designed research studies, conducted experiments, acquired data, analyzed data, and wrote the manuscript; N.P., Y.O., Y.L., C.S., N.F.G., Y.C., Q. Wu, I.T., C.-J.K., and A.S.A. conducted experiments, acquired data, and analyzed data; R.K. analyzed data and wrote the manuscript; and J.D.E., I.M., T.C., and M.Y.C. designed research studies, analyzed data, and wrote the manuscript.
Conflict-of-interest disclosure: The authors declare no competing financial interests.
Correspondence: Mark Y. Chiang, Medical School, University of Michigan, Room 2043 Taubman BSRB, 109 Zina Pitcher Pl, Ann Arbor, MI 48109; e-mail: markchia@umich.edu.

This feature is available to Subscribers Only
Sign In or Create an Account Close Modal