

Key Points
Truncating PPM1D mutations confer chemotherapy resistance, leading to the selective expansion of PPM1D-mutant cells in vitro and in vivo.
PPM1D inhibitor treatment reverses the chemotherapy-resistance phenotype and selectively kills PPM1D-mutant cells.

Abstract
Truncating mutations in the terminal exon of protein phosphatase Mg2+/Mn2+ 1D (PPM1D) have been identified in clonal hematopoiesis and myeloid neoplasms, with a striking enrichment in patients previously exposed to chemotherapy. In this study, we demonstrate that truncating PPM1D mutations confer a chemoresistance phenotype, resulting in the selective expansion of PPM1D-mutant hematopoietic cells in the presence of chemotherapy in vitro and in vivo. Clustered regularly interspaced short palindromic repeats (CRISPR)–CRISPR-associated protein-9 nuclease mutational profiling of PPM1D in the presence of chemotherapy selected for the same exon 6 mutations identified in patient samples. These exon 6 mutations encode for a truncated protein that displays elevated expression and activity due to loss of a C-terminal degradation domain. Global phosphoproteomic profiling revealed altered phosphorylation of target proteins in the presence of the mutation, highlighting multiple pathways including the DNA damage response (DDR). In the presence of chemotherapy, PPM1D-mutant cells have an abrogated DDR resulting in altered cell cycle progression, decreased apoptosis, and reduced mitochondrial priming. We demonstrate that treatment with an allosteric, small molecule inhibitor of PPM1D reverts the phosphoproteomic, DDR, apoptotic, and mitochondrial priming changes observed in PPM1D-mutant cells. Finally, we show that the inhibitor preferentially kills PPM1D-mutant cells, sensitizes the cells to chemotherapy, and reverses the chemoresistance phenotype. These results provide an explanation for the enrichment of truncating PPM1D mutations in the blood of patients exposed to chemotherapy and in therapy-related myeloid neoplasms, and demonstrate that PPM1D can be a targeted in the prevention of clonal expansion of PPM1D-mutant cells and the treatment of PPM1D-mutant disease.
Introduction
The discovery of amplifications of protein phosphatase Mg2+/Mn2+ 1D (PPM1D) in epithelial cancers led to its classification as an oncogenic driver in many solid tumors.1-5 More recently, large-scale sequencing efforts in clonal hematopoiesis and myelodysplastic syndrome (MDS) have identified recurrent mutations in PPM1D.6-9 In the case of clonal hematopoiesis of indeterminate potential (CHIP),10 a phenomenon in which somatic mutations are present in blood cells of individuals without overt hematologic disease, PPM1D mutations are common and enriched in patients who have previously been exposed to chemotherapy or radiation.9,11-14 Similarly, PPM1D mutations have been identified in MDS where they are strongly enriched in therapy-related MDS, being present in up to 15% of patients.6 Strikingly, in all studies, all PPM1D mutations were found to occur in the terminal exon of the gene, leading to a truncated protein product.
PPM1D encodes a serine-threonine phosphatase that is transcriptionally upregulated in a p53-dependent manner in response to DNA damage.15 PPM1D in turn negatively regulates p53 and several proteins involved in the DNA damage response (DDR) and has been proposed to be a primary homeostatic regulator of the DDR pathway by facilitating the return to steady state after DNA damage.5
In this study, we sought to provide an explanation for the high frequency of truncating PPM1D mutations in the blood of patients previously exposed to chemotherapy and in patients with therapy-related myeloid neoplasms (t-MNs). We show that truncating mutations of PPM1D inhibit the DDR and confer a selective advantage to PPM1D-mutant hematopoietic cells in the presence of chemotherapy in vitro and in vivo. We demonstrate that these effects are reversed upon selective, small-molecule inhibition of PPM1D activity, highlighting a promising approach in the prevention of clonal expansion of PPM1D-mutant cells and in the treatment of PPM1D-mutant hematologic malignancies.
Methods
Cell lines, plasmids, and viral constructs
Molm13 and 293T cells were obtained from American Type Culture Collection (ATCC). Cells were cultured in RPMI 1640 (Mediatech) or Dulbecco modified Eagle medium (Mediatech) supplemented with 10% or 20% heat-inactivated fetal bovine serum (Omega Scientific) and 1% penicillin G, streptomycin, and l-glutamine (Mediatech).
The clustered regularly interspaced short palindromic repeats (CRISPR)-associated protein-9 nuclease (Cas9) containing pL-CRISPR.EGF.GFP vector (Addgene) was used for all CRISPR-Cas9 in vitro experiments. For in vivo experiments, guide RNA (gRNA)-only vectors based on the pLKO_TRC005 backbone were used, as previously described.16 All gRNAs used can be found in supplemental Table 3 (available on the Blood Web site). The gRNA that locates to murine Actin aligns to the last intron (5 of 5) of the gene, and was used as a targeting control guide, for in vivo experiments. A lentiviral PGK.EGFP.IRES.mCherry degradation reporter vector was used for protein degradation experiments (vector schema shown in Figure 2D).
Generation of gene-edited pooled and single-cell clones
The pL-CRISPR.EGF.GFP vector containing the gRNA of interest was transduced into Molm13 cells after which transduced cells were fluorescence-activated cell sorted (FACSAria II; BD Biosciences) based on high green fluorescent protein (GFP) expression and expanded as pools or single-cell clones. The pooled and subcloned populations were genotyped. Single-cell clones with homozygous frameshift mutations in exon 6 of PPM1D and/or homozygous frameshift mutations in TP53 were used for experiments.
Cell viability chemotherapy drug response and chemotherapy competition assay
Molm13 cells were plated at a concentration of 100 000 cells per mL in a 96-well plate. The drug was diluted at least 1/1000 in 10% RPMI 1640 and added in limiting dilutions to the cells. Seventy-two hours after initiation of treatment, cell viability was determined using the luminescent cell viability assay Cell Titer Glo (Promega).
For competition assays, a pooled population of Molm13 PPM1D-mutant cells was infected with a lentiviral vector that results in overexpression of tdTomato. Molm13 PPM1D-tdTomato+ cells were mixed in a 1:25 ratio with Molm13 control cells. Cells were analyzed using a FACSCanto II (BD Biosciences) every 96 hours. 4′,6-Diamidino-2-phenylindole (DAPI) was added to exclude dead cells. After analysis, cells were split and fresh media and chemotherapy were added.
Annexin V and BrdU staining and analysis
Annexin V staining (phycoerythrin-Cy7; eBioscience) was used to assess the presence of apoptosis in cells exposed to cytarabine or GSK2830371. DAPI or propidium iodide was used as dead cell marker. After staining, cells were analyzed by flow. Cell cycle was assessed using an allophycocyanin 5-bromo-2′-deoxyuridine (BrdU) flow kit (BD Pharmingen).
Western blot and antibodies
Protein lysates were run on Tris-HCl, 1-mm Criterion Precast gels (Bio-Rad) at a constant voltage. Proteins were transferred onto Immobilon-P transfer membranes (Millipore) at constant amperage. Blots were blocked in 5% bovine serum albumin in Tris-buffered saline with Tween 20 0.1% for 1 hour. For protein detection, primary antibodies detecting PPM1D (Santa Cruz Biotechnology), p53 phospho-S15 (Abcam), Chk1 phospho-S345 (Cell Signaling Technology), p53 (Abcam), Chk1 (Cell Signaling Technology), yH2AX (Cell Signaling Technology), H2A (Cell Signaling Technology), COXIV (Abcam), and actin (Abcam) were used. Secondary antibodies were horseradish peroxidase–conjugated donkey anti-rabbit (GE Healthcare) and sheep anti-mouse (GE Healthcare). SuperSignal (Thermo Fisher Scientific) chemiluminescent substrate was used for detection.
CRISPR screen
A pooled CRISPR-Cas9 lentivirus library was generated containing all possible gRNAs targeting PPM1D with an NGG protospacer adjacent motif (n = 256), as well as 505 nontargeting controls. Molm13 parental cells were infected at a multiplicity of infection of 0.25 and with an average representation of 1000 cells per gRNA. Cells were selected with puromycin, divided into treatment groups and exposed to 100 nM cytarabine or vehicle treatment as described in “Cell viability chemotherapy drug response and chemotherapy competition assay.” Cells were collected for sequencing analysis on days 12, 20, and 24. gRNA inserts were polymerase chain reaction amplified and sequenced as previously described.17 For analysis, the log2 fold-change of each gRNA at each time point was determined relative to the starting point (day 0).
Degradation reporter assay
Molm13 parental cells and Molm13 p53−/− were transduced with the PGK.EGFP.IRES.mCherry degradation reporter vector (Figure 2D) containing complementary DNA (cDNA) constructs for full-length PPM1D (ENSG00000170836), truncated and C-terminal PPM1D (supplemental Table 6), or the empty vector. For analyses, the enhanced GFP (EGFP)-to-mCherry ratio was normalized to the ratio of full-length PPM1D. DAPI was included to mark dead cells.
Phosphoproteomic and motif analysis
Global proteome and phosphoproteome analyses were performed as previously described.18 All mass spectra, in the original instrument vendor format, contributing to this study may be downloaded from ftp://ftp.broadinstitute.org/distribution/proteomics/public_datasets/.
All mass spectrometry data were interpreted using the Spectrum Mill software package (Agilent Technologies).18 To identify significantly different protein and phosphosite ratios of PPM1D wild-type vs mutant or drug vs no drug comparisons, we used the Limma package in the R environment to calculate moderated Student t test P values corrected by the Benjamini-Hochberg method.19
For the motif analysis, sequence logos depicting the conservation of amino acid residues around confidently localized (probability > 0.9), PPM1D-dependent phosphorylation sites were generated using the “motifStack” Bioconductor R package. Background frequencies of amino acids were calculated from the human proteome database (UniProt, downloaded 17 Oct 2014). Significance of the conserved occurrence of acidic amino acids (glutamic/aspartic acid) in a sequence window of ±5 aa around phosphorylation sites was calculated by the Fisher exact test using the sequence windows of all detected and localized phosphorylation sites as background (N = 20 247). The same strategy was used for sequence motifs with conserved glutamine at position +1.
Dynamic BH3 profiling
Dynamic BH3 profiling was performed as described previously.20,21 Briefly, cells were exposed to chemotherapy drugs or GSK2830371 for 16 hours and then resuspended in membrane extraction buffer containing 0.001% to 0.005% digitonin (Sigma-Aldrich) to allow permeabilization of mitochondrial membrane. Cells were then transferred to a 384-well plate containing dimethyl sulfoxide (DMSO) or BH3-only peptides and incubated for 60 minutes to allow peptide exposure. The sequences and method of synthesis of BH3-only peptides were described previously.22 Cells were fixed, permeabilized, and stained for cytochrome c. For each peptide treatment, the cytochrome c release of the non–drug-treated cells are subtracted from the cytochrome release value of the drug-treated samples to derive drug-induced change in priming, or δ priming.
CRISPR-Cas9 in vivo experiments
Cas9Mx1Cre1+ mice23 were treated with 3 doses of 200 mg of poly(I:C) (Invivogen HMW) at 6 to 10 weeks of age. Following poly(I:C) treatment, long bones were harvested and c-Kit+ cells isolated. A minimum of 200 000 c-Kit+ cells was injected into CD45.1, female recipient mice after same-day lethal irradiation (2× 4.5 Gy). In vivo treatment was started after hematopoietic reconstitution. The mice were randomized into treatment groups based on the percentage of cells in the peripheral blood containing the blue fluorescent protein (BFP)-tagged PPM1D gRNA or Tag red fluorescent protein (tRFP)-tagged control (Actin) gRNA. Mice were treated 1 time per day for 5 days with intraperitoneal injection of 250 mg/kg cytarabine or 200 μL of phosphate-buffered saline. Seven days after a treatment round, peripheral blood was collected, stained for CD45.1 and CD45.2, and assessed by flow cytometry. Forward scatter and side scatter were used to gate on granulocyte, monocyte, and lymphocyte cell compartments. Propidium iodide was added to exclude dead cells.
Human data
A total of 28 418 individuals with whole-exome sequencing data were used for the analysis of PPM1D mutations in people unselected for malignancy.8,24 Previously published targeted sequencing data14 from 401 chemotherapy exposed patients with non-Hodgkin lymphoma who underwent autologous stem cell transplant (SCT) for non-Hodgkin lymphoma was used for the analysis of PPM1D mutations in chemotherapy-exposed individuals. Frameshift and nonsense mutations in PPM1D were identified using MuTect25 (http://archive.broadinstitute.org/cancer/cga/mutect) and Indelocator (http://archive.broadinstitute.org/cancer/cga/indelocator). To minimize differences in the 2 datasets due to different coverage depth of PPM1D, we only included mutations with a variant allele fraction >5%.
Results
Truncating PPM1D mutations lead to the selective outgrowth of PPM1D-mutant hematopoietic cells during chemotherapy exposure in vitro and in vivo
To define the spectrum and frequency of PPM1D mutations in hematopoietic cells in the general population, we reanalyzed whole-exome sequencing data from the peripheral blood of 28 418 individuals unselected for malignancy.8,24 Somatic frameshift and nonsense mutations increased with age and localized exclusively to exon 6, producing predicted protein products truncated downstream of amino acid 400 (Figure 1A). As similar PPM1D mutations are found in myeloid malignancies and in the blood of patients treated for solid tumors,9,11,12,26 we reanalyzed a cohort of 401 patients who had previously received chemotherapy for non-Hodgkin lymphoma.14 The prevalence of PPM1D mutations in the unselected population ranged between 0.5% and 5% whereas the frequency of PPM1D mutations in patients exposed to chemotherapy was 2% to 18% (Figure 1B; supplemental Table 1). Using logistic regression analysis, we show that PPM1D mutations were 60 times more likely to be present in the chemotherapy-exposed lymphoma patients, even after adjusting for age, when compared with people unselected for malignancy (supplemental Table 2).
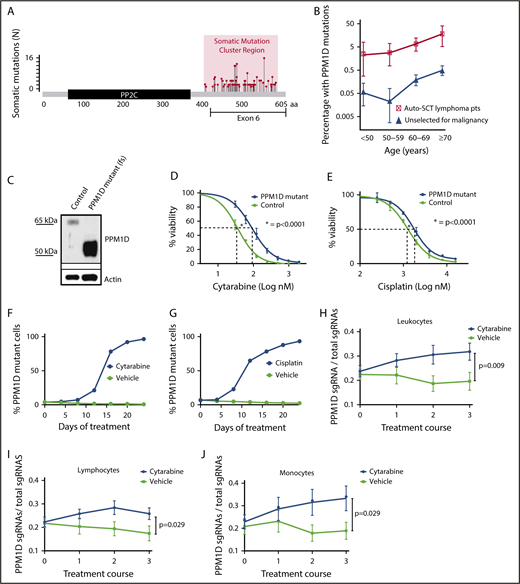
Truncating PPM1D mutations lead to the selective outgrowth of PPM1D-mutant hematopoietic cells during chemotherapy treatment in vitro and in vivo. (A) The location of the absolute number of somatic frameshift and nonsense mutations in PPM1D identified in the blood cells of a cohort of 28 418 persons is shown.24 (B) The prevalence of PPM1D mutations in 28 418 people unselected for malignancy was compared with 401 lymphoma patients who had received chemotherapy and were undergoing stem cell collection for autologous transplantation (Auto-SCT).14,24 Only PPM1D mutations with a variant allele frequency (VAF) > 0.05 are included. Error bars represent the 95% confidence intervals in each age bin. (C) Whole-cell lysates from Molm13 isogenic control cells (control) and PPM1D frameshift (fs) mutant (mut) single-cell clones probed with anti-PPM1D and anti-Actin. (D-E) Viability assays in Molm13 PPM1D-mutant or control single-cell clones that were treated with increasing concentrations of cytarabine (D) or cisplatin (E) for 72 hours. Experiments were performed in triplicate and data are shown as the mean ± standard deviation (SD). Nonlinear logistic regression analyses and a sum of squares F test was performed to compare inhibitory responses. (F-G) Flow cytometric readout of competition experiment with 5% Molm13 PPM1D-mutant cells (tdTomato+) and 95% Molm13 control cells (tdTomato−), exposed to 150 nM cytarabine (F) and vehicle or 1 μM cisplatin (G) and vehicle for 24 days. Experiments were performed with biological triplicates and data are shown as the means ± SD. (H-J) Flow cytometric analysis of the peripheral blood of chimeric mice transduced with a gRNA-targeting PPM1D (BFP+) or a control locus (tRFP+). Mice were exposed to 3 rounds of cytarabine or vehicle treatment. Data represent the mean ± standard error of the mean (SEM) of 18 mice in the vehicle and 18 mice in the treatment arm, and are shown for the leukocyte (H), lymphocyte (I), and monocyte (J) cell compartments. Peripheral expansion of Ppm1d-mutant cells was analyzed using Wilcoxon rank sum tests.
Truncating PPM1D mutations lead to the selective outgrowth of PPM1D-mutant hematopoietic cells during chemotherapy treatment in vitro and in vivo. (A) The location of the absolute number of somatic frameshift and nonsense mutations in PPM1D identified in the blood cells of a cohort of 28 418 persons is shown.24 (B) The prevalence of PPM1D mutations in 28 418 people unselected for malignancy was compared with 401 lymphoma patients who had received chemotherapy and were undergoing stem cell collection for autologous transplantation (Auto-SCT).14,24 Only PPM1D mutations with a variant allele frequency (VAF) > 0.05 are included. Error bars represent the 95% confidence intervals in each age bin. (C) Whole-cell lysates from Molm13 isogenic control cells (control) and PPM1D frameshift (fs) mutant (mut) single-cell clones probed with anti-PPM1D and anti-Actin. (D-E) Viability assays in Molm13 PPM1D-mutant or control single-cell clones that were treated with increasing concentrations of cytarabine (D) or cisplatin (E) for 72 hours. Experiments were performed in triplicate and data are shown as the mean ± standard deviation (SD). Nonlinear logistic regression analyses and a sum of squares F test was performed to compare inhibitory responses. (F-G) Flow cytometric readout of competition experiment with 5% Molm13 PPM1D-mutant cells (tdTomato+) and 95% Molm13 control cells (tdTomato−), exposed to 150 nM cytarabine (F) and vehicle or 1 μM cisplatin (G) and vehicle for 24 days. Experiments were performed with biological triplicates and data are shown as the means ± SD. (H-J) Flow cytometric analysis of the peripheral blood of chimeric mice transduced with a gRNA-targeting PPM1D (BFP+) or a control locus (tRFP+). Mice were exposed to 3 rounds of cytarabine or vehicle treatment. Data represent the mean ± standard error of the mean (SEM) of 18 mice in the vehicle and 18 mice in the treatment arm, and are shown for the leukocyte (H), lymphocyte (I), and monocyte (J) cell compartments. Peripheral expansion of Ppm1d-mutant cells was analyzed using Wilcoxon rank sum tests.
We hypothesized that the enrichment of PPM1D mutations in patients exposed to chemotherapy may be caused by positive selection for PPM1D-mutant hematopoietic cells in the presence of DNA-damaging agents. To test this hypothesis, we used the CRISPR-Cas9 system with a gRNA-targeting exon 6 to introduce frameshift mutations in PPM1D in Molm13 cells, an acute myeloid leukemia cell line that is wild type for TP53. These mutations produced a truncated protein that is expressed at higher levels than wild-type PPM1D found in cells infected with a nontargeting gRNA (isogenic control) (Figure 1C). Compared with the isogenic control, PPM1D-mutant cells had increased viability after 72 hours of exposure to cytarabine, cisplatin, doxorubicin, or etoposide, chemotherapeutics commonly used to treat solid and hematologic malignancies (Figure 1D-E; supplemental Figure 1).
To assess whether PPM1D mutations confer a selective advantage in the presence of ongoing DNA damage, we performed a competition experiment in which PPM1D-mutant Molm13 cells were mixed with isogenic control cells in a 1:25 ratio and exposed to chemotherapy or vehicle for several weeks. Following 24 days of exposure to chemotherapeutic agents, the PPM1D-mutant cells had selectively expanded and comprised >95% of the total population. Exposure to vehicle had no effect on the outgrowth of PPM1D-mutant cells (Figure 1F-G; supplemental Figure 2). The degree of expansion of Molm13 PPM1D-mutant cells was similar to that seen for Molm13 cells with homozygous TP53 mutations, which are known to confer a competitive advantage during chemotherapy (supplemental Figure 3).27 These findings demonstrate that PPM1D-truncating mutations confer chemotherapy resistance, leading to a competitive advantage of PPM1D-mutant leukemia cells under the selective pressure of chemotherapy.
We next assessed the effect of Ppm1d mutations on hematopoietic cell growth in the presence of chemotherapy in vivo. We transduced c-Kit+ bone marrow cells from mice expressing Cas9 with a gRNA targeting exon 6 of mouse Ppm1d or a control gRNA and transplanted the genetically modified cells into lethally irradiated syngeneic recipients in a 1:5 ratio (supplemental Figure 4). Four weeks later, we confirmed the engraftment of a chimeric bone marrow compartment in which Ppm1d-mutant cells were present as a minority population. We then treated the mice with 3 cycles of either cytarabine or vehicle control and serially monitored the genetic composition of different hematopoietic populations in the peripheral blood. Compared with vehicle treatment, we observed a significant, selective increase of Ppm1d-mutant cells in the peripheral blood of the chimeric mice treated with cytarabine (Figure 1H-J; supplemental Figure 5). Thus, our observations in several human genetic datasets, an in vitro AML cell line system, and an in vivo model of hematopoiesis, support the conclusion that PPM1D mutations confer a selective advantage to hematopoietic cells in the presence of chemotherapy.
In vitro chemotherapy treatment selects for the same PPM1D mutations identified in patient samples
We next performed a CRISPR-Cas9 mutagenesis screen to functionally characterize the range of PPM1D mutations that confer a fitness advantage to hematopoietic cells undergoing DNA damage.28 Using Molm13 cells, we introduced frameshift mutations across PPM1D by transducing a library of 265 different gRNAs tiling the protein-coding region of PPM1D (supplemental Table 4). After treating the transduced cells for 24 days with cytarabine, we observed a selective outgrowth of cells carrying gRNAs targeting amino acids 400 to 585 (supplemental Figure 6; supplemental Table 5). This region tightly overlaps with the region of PPM1D that is mutated in CHIP and t-MNs (Figure 2A), implying that the PPM1D mutations identified in patients result in a chemotherapy-resistance phenotype.6,8,9,14,24 We did not find an enrichment of gRNAs located in the very C-terminal domain of the protein (amino acid 585-605) in either our functional screen or in the human datasets.1,9,20 This finding suggests the presence of a C-terminal regulatory domain of PPM1D, which, when lost, leads to chemotherapy resistance.
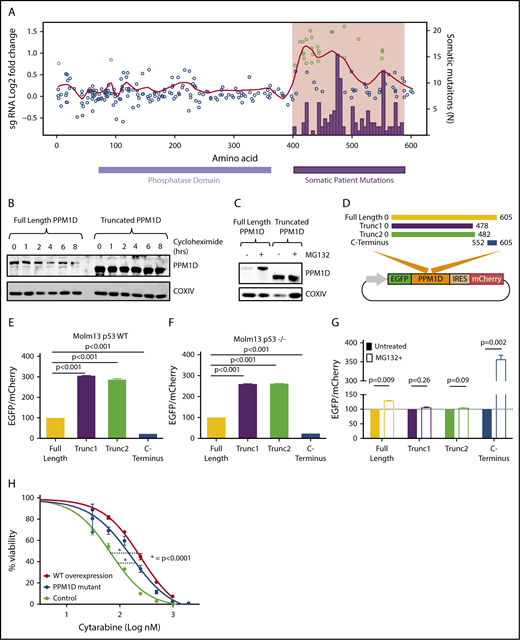
Truncating PPM1D mutations lead to decreased degradation of PPM1D. (A) Log2-fold enrichment of gRNAs (black dots) in Molm13 cells exposed to cytarabine treatment versus vehicle treatment of 12 days. The experiment was performed with biological triplicates, and the red line represents the locally weighted scatterplot smoothing (LOESS) of 0.1. gRNAs with a z score ≥ 3 are shown in green. Overlaid are the absolute number of somatic PPM1D frameshift and nonsense mutations (black bars) identified in the blood cells of 28 418 individuals as described in Figure 1A. (B) Whole-cell lysates from Molm13 cells overexpressing full -length PPM1D (Full-Length PPM1D) or truncated PPM1D (Truncated PPM1D) were collected at different time points following cycloheximide (50 μg/mL) treatment. Blots were probed with anti-PPM1D and anti-COXIV. (C) Whole-cell lysates before and after 4 hours of 10 μM MG132 treatment from Molm13 cells overexpressing full-length PPM1D (Full-Length PPM1D) or truncated PPM1D (Truncated PPM1D) cDNA. (D) Vector map of the degradation reporter vector. Different PPM1D cDNA constructs are cloned in-frame with EGFP, allowing for monitoring of PPM1D expression levels through EGFP expression. mCherry is expressed following an IRES sequence and provides an internal control for vector expression in each cell. (E) EGFP-to-mCherry ratio in Molm13 cells with overexpression of full-length PPM1D, truncated PPM1D or the C-terminal end of PPM1D. The EGFP-to-mCherry ratios are normalized to the expression level of full-length PPM1D, and provide an estimate for the level of degradation. Experiments were done using biological triplicates and data are shown as the means ± SD. Unpaired Student t tests were used to calculate the association between the different vectors and P values were corrected for multiple hypothesis testing. (F) EGFP-to-mCherry ratio in Molm13 p53−/− cells with overexpression of full-length PPM1D, truncated PPM1D or the C-terminal end of PPM1D. The EGFP-to-mCherry ratios are normalized to the expression level of full-length PPM1D. Unpaired Student t tests were used to calculate the association between the different vectors and P values were corrected for multiple hypothesis testing. (G) EGFP-to-mCherry ratio in Molm13 cells before and after exposure to MG132 (10 μM, 6 hours), normalized to pretreatment values. Paired Student t tests were used to compare between treatment groups. Values represent means ± SD of biological replicates. (H) Cell viability analysis in Molm13 control cells (control), Molm13 PPM1D-truncating mutant cells (PPM1D-mutant) and Molm13 cells with overexpression of wild-type PPM1D (WT overexpression). Cells were exposed to increasing concentrations of cytarabine for 72 hours. Experiments were performed with biological replicates and data are shown as the means ± SD. Nonlinear logistic regression analyses and a sum of squares F test were performed to compare the inhibitory response to cytarabine in Molm13 WT overexpression cells and Molm13 PPM1D-truncating mutant cells to the inhibitory response in Molm13 control cells.
Truncating PPM1D mutations lead to decreased degradation of PPM1D. (A) Log2-fold enrichment of gRNAs (black dots) in Molm13 cells exposed to cytarabine treatment versus vehicle treatment of 12 days. The experiment was performed with biological triplicates, and the red line represents the locally weighted scatterplot smoothing (LOESS) of 0.1. gRNAs with a z score ≥ 3 are shown in green. Overlaid are the absolute number of somatic PPM1D frameshift and nonsense mutations (black bars) identified in the blood cells of 28 418 individuals as described in Figure 1A. (B) Whole-cell lysates from Molm13 cells overexpressing full -length PPM1D (Full-Length PPM1D) or truncated PPM1D (Truncated PPM1D) were collected at different time points following cycloheximide (50 μg/mL) treatment. Blots were probed with anti-PPM1D and anti-COXIV. (C) Whole-cell lysates before and after 4 hours of 10 μM MG132 treatment from Molm13 cells overexpressing full-length PPM1D (Full-Length PPM1D) or truncated PPM1D (Truncated PPM1D) cDNA. (D) Vector map of the degradation reporter vector. Different PPM1D cDNA constructs are cloned in-frame with EGFP, allowing for monitoring of PPM1D expression levels through EGFP expression. mCherry is expressed following an IRES sequence and provides an internal control for vector expression in each cell. (E) EGFP-to-mCherry ratio in Molm13 cells with overexpression of full-length PPM1D, truncated PPM1D or the C-terminal end of PPM1D. The EGFP-to-mCherry ratios are normalized to the expression level of full-length PPM1D, and provide an estimate for the level of degradation. Experiments were done using biological triplicates and data are shown as the means ± SD. Unpaired Student t tests were used to calculate the association between the different vectors and P values were corrected for multiple hypothesis testing. (F) EGFP-to-mCherry ratio in Molm13 p53−/− cells with overexpression of full-length PPM1D, truncated PPM1D or the C-terminal end of PPM1D. The EGFP-to-mCherry ratios are normalized to the expression level of full-length PPM1D. Unpaired Student t tests were used to calculate the association between the different vectors and P values were corrected for multiple hypothesis testing. (G) EGFP-to-mCherry ratio in Molm13 cells before and after exposure to MG132 (10 μM, 6 hours), normalized to pretreatment values. Paired Student t tests were used to compare between treatment groups. Values represent means ± SD of biological replicates. (H) Cell viability analysis in Molm13 control cells (control), Molm13 PPM1D-truncating mutant cells (PPM1D-mutant) and Molm13 cells with overexpression of wild-type PPM1D (WT overexpression). Cells were exposed to increasing concentrations of cytarabine for 72 hours. Experiments were performed with biological replicates and data are shown as the means ± SD. Nonlinear logistic regression analyses and a sum of squares F test were performed to compare the inhibitory response to cytarabine in Molm13 WT overexpression cells and Molm13 PPM1D-truncating mutant cells to the inhibitory response in Molm13 control cells.
Truncating mutations in PPM1D lead to decreased protein degradation
Previous reports have demonstrated that PPM1D may be degraded by the proteasome and that truncation of PPM1D may lead to decreased degradation of the protein and increased expression of the active enzyme.29 We performed protein half-life experiments using the protein synthesis inhibitor cycloheximide to study the protein stability of PPM1D-mutant hematopoietic cells. We observed more rapid degradation of full-length PPM1D compared with truncated PPM1D in an overexpression system in Molm13 cells (Figure 2B), and found that treatment with the proteasomal inhibitor MG132 led to an increase in protein levels of full-length, but not truncated PPM1D (Figure 2C).
To study the role of the C-terminal domain of PPM1D in the degradation of PPM1D in more detail, we generated reporter vectors in which full-length PPM1D cDNA, PPM1D truncation mutants, or the region encoding the C-terminal 60 aa were cloned in-frame with GFP, enabling quantification of the level of expression of each PPM1D sequence using GFP expression (Figure 2D; supplemental Table 6). Using this system, we found that PPM1D truncation mutations increased the reporter signal (Figure 2E); in contrast, the reporter signal in cells expressing the C-terminal region of PPM1D was decreased, suggesting the presence of a degradation signal in this region. The reporter signal did not differ between TP53 wild-type and TP53-null cells (Figure 2F), signifying that, in contrast to PPM1D transcription,15 PPM1D degradation appears p53 independent. Furthermore, treatment with the proteasome-inhibitor MG132 impaired degradation of full-length and C-terminal PPM1D, but not of the truncating mutants (Figure 2G). Thus, 1 consequence of PPM1D exon 6 mutations is reduced proteasomal degradation due to the loss of a C-terminal degradation signal, and subsequent overexpression of PPM1D.
We next examined whether overexpression of wild-type PPM1D is sufficient to induce chemotherapy resistance, or whether a novel function of the truncated protein is required for this phenotype. We observed a similar degree of chemotherapy resistance in Molm13 cells that overexpress wild-type PPM1D as in cells with PPM1D-truncating mutations (Figure 2H; supplemental Figure 7), suggesting that a major consequence of the truncating mutations is increased protein stability, leading to chemotherapy resistance.
PPM1D plays a central role in the DDR pathway
As PPM1D negatively regulates the DDR via dephosphorylation of multiple target proteins including p53,5,15 we assessed the levels of p53 Ser15 and CHEK1 Ser345 in PPM1D-mutant and isogenic control Molm13 cells after exposure to cytarabine. Compared with control, PPM1D-mutant cells treated with cytarabine had significantly lower levels of phosphorylation of p53 (serine 15) and CHEK1 (serine 345), confirming the gain-of-function phenotype of truncating PPM1D mutations (Figure 3A).5
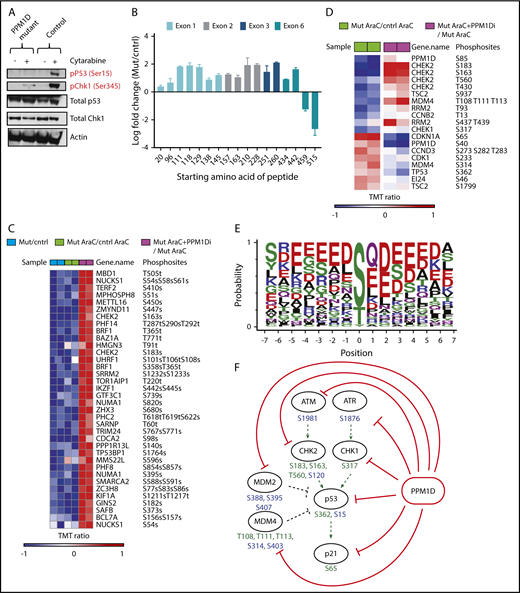
PPM1D plays a central role in the DDR pathway. (A) Whole-cell lysates of Molm13 PPM1D-mutant and Molm13 isogenic control single-cell clones exposed to 400 nM cytarabine for 4 hours were probed with anti-p53 Ser15 and anti-CHEK1 Ser345. (B) The log fold-change of different peptides for Molm13 PPM1D-mutant cells compared with Molm13 control cells. The starting amino acid for each peptide is shown. The peptides range from 8 to 22 aa in length. (C) Heatmap of phosphosites that are significantly downregulated with an FDR < 0.05 in Molm13 PPM1D-mutant/control at baseline (Mut/cntrl) or after cytarabine (AraC) treatment (Mut AraC/cntrl AraC), and upregulated (FDR < 0.05) after 4 hours of treatment with 400 nM cytarabine and GSK2830371 (PPM1D inhibitor) (Mut AraC + PPM1Di/Mut AraC). Results shown are for biological replicates. (D) Heatmap of phosphosites belonging to the KEGG_P53 pathway that are significantly regulated (FDR < 0.1) in Molm13 PPM1D-mutant/control after 4-hour treatment with 400 nM cytarabine (AraC) (Mut AraC/cntrl AraC) or in Molm13 PPM1D-mutant cells treated with 400 nM AraC + 1 μM PPM1D inhibitor GSK2830371 compared with Molm13 PPM1D mut cells treated with 400nM AraC (Mut AraC + iPPM1D/Mut AraC) for 4 hours. Results shown are for biological replicates. (E) Conserved amino acid residues flanking PPM1D-dependent phosphorylation sites based on 43 substrate candidates that are downregulated (FDR < 0.1) in Molm13 PPM1D-mutant/cntrl for either the baseline or the AraC-treated comparisons and at the same time upregulated (FDR < 0.1) after PPM1D inhibitor GSK2830371 treatment. The combined occurrence of glutamine at +1 and ≥2 acidic residues in the flanking region is statistically significant (P = 3.595e-13, Fisher exact test). (F) Schema illustrating the components of the DDR pathway that are targeted by PPM1D in leukemia cells, based on the results from the phosphoproteomic analysis. Phosphorylation targets of PPM1D identified by mass spectrometry (FDR < 0.1) are shown in green. Predicted PPM1D target sites that were based on the identified consensus sequence with a glutamine at +1 and ≥2 acidic residues are shown in blue.
PPM1D plays a central role in the DDR pathway. (A) Whole-cell lysates of Molm13 PPM1D-mutant and Molm13 isogenic control single-cell clones exposed to 400 nM cytarabine for 4 hours were probed with anti-p53 Ser15 and anti-CHEK1 Ser345. (B) The log fold-change of different peptides for Molm13 PPM1D-mutant cells compared with Molm13 control cells. The starting amino acid for each peptide is shown. The peptides range from 8 to 22 aa in length. (C) Heatmap of phosphosites that are significantly downregulated with an FDR < 0.05 in Molm13 PPM1D-mutant/control at baseline (Mut/cntrl) or after cytarabine (AraC) treatment (Mut AraC/cntrl AraC), and upregulated (FDR < 0.05) after 4 hours of treatment with 400 nM cytarabine and GSK2830371 (PPM1D inhibitor) (Mut AraC + PPM1Di/Mut AraC). Results shown are for biological replicates. (D) Heatmap of phosphosites belonging to the KEGG_P53 pathway that are significantly regulated (FDR < 0.1) in Molm13 PPM1D-mutant/control after 4-hour treatment with 400 nM cytarabine (AraC) (Mut AraC/cntrl AraC) or in Molm13 PPM1D-mutant cells treated with 400 nM AraC + 1 μM PPM1D inhibitor GSK2830371 compared with Molm13 PPM1D mut cells treated with 400nM AraC (Mut AraC + iPPM1D/Mut AraC) for 4 hours. Results shown are for biological replicates. (E) Conserved amino acid residues flanking PPM1D-dependent phosphorylation sites based on 43 substrate candidates that are downregulated (FDR < 0.1) in Molm13 PPM1D-mutant/cntrl for either the baseline or the AraC-treated comparisons and at the same time upregulated (FDR < 0.1) after PPM1D inhibitor GSK2830371 treatment. The combined occurrence of glutamine at +1 and ≥2 acidic residues in the flanking region is statistically significant (P = 3.595e-13, Fisher exact test). (F) Schema illustrating the components of the DDR pathway that are targeted by PPM1D in leukemia cells, based on the results from the phosphoproteomic analysis. Phosphorylation targets of PPM1D identified by mass spectrometry (FDR < 0.1) are shown in green. Predicted PPM1D target sites that were based on the identified consensus sequence with a glutamine at +1 and ≥2 acidic residues are shown in blue.
Next, we sought to define more broadly the spectrum of PPM1D targets in hematopoietic cells in an unbiased manner. To this end, we performed quantitative phosphoproteomic mass spectroscopy on lysates from PPM1D-mutant and isogenic control Molm13 cells at baseline and after exposure to cytarabine. In addition, we made use of a selective, allosteric inhibitor of PPM1D, GSK2830371,30 to study the phosphoproteomic effect of inhibition of PPM1D. We confirmed that truncating PPM1D mutations lead to truncation of PPM1D, as evidenced by a selective, decreased abundance of the most C-terminal PPM1D peptides in PPM1D-mutant cells (Figure 3B). We then defined all significantly altered (false discovery rate [FDR] < 0.05) phosphoproteins as those with both lower phosphorylation in mutant compared with control cells at baseline and after cytarabine treatment, and with increased phosphorylation in mutant cells after treatment with GSK2830371 (Figure 3C). Overall, there was enrichment for proteins in the DDR pathway, including differential phosphorylation (FDR < 0.1) of p53, PPM1D, CHEK1, CHEK2, and MDM4 (Figure 3D; supplemental Table 7).
Comparison of the residues of the differentially phosphorylated peptides revealed an overrepresentation of 2 or more acidic residues in a 5-aa window surrounding the regulated phosphosites, likely representing the consensus sequence for the serine-threonine phosphatase activity of PPM1D (Figure 3E). Using this sequence, we were able to predict known and novel phosphorylation targets of PPM1D, including additional DDR pathway members that were not identified in the initial mass spectroscopy analysis (Figure 3F).
PPM1D-mutant cells have an abrogated apoptotic and cell-cycle response to chemotherapy
Having demonstrated differential activation of the DDR in PPM1D-mutant compared with isogenic control cells, we next assessed the effect of truncating PPM1D mutations on apoptosis and cell-cycle progression. PPM1D-mutant cells exhibited decreased apoptosis as assessed by Annexin V staining (Figure 4A) and an increased progression to G2/M phase following exposure to chemotherapy (Figure 4B).
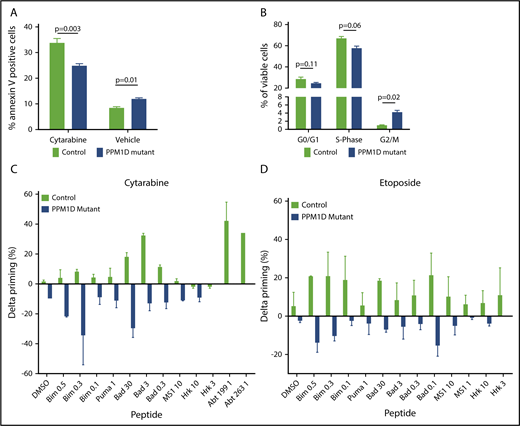
PPM1D-mutant cells have an abrogated apoptotic and cell-cycle response to chemotherapy. (A) Annexin V staining and flow cytometric analysis of Molm13 PPM1D-mutant and control single-cell clones exposed to 400 nM cytarabine or vehicle treatment of 24 hours. Data are shown as the means ± SD for biological replicates, and unpaired Student t tests were used for statistical analyses. (B) BrdU staining and flow cytometric analysis of Molm13 PPM1D-mutant and control single-cell clones after 24 hours of exposure to 100 nM cytarabine. Data are shown as the means ± SD for biological replicates and unpaired Student t tests were used to compare the cell-cycle progression in Molm13 PPM1D-mutant and control cells. (C-D) Molm13 PPM1D-mutant and control cells were exposed to cytarabine (0.25 µM) (C) or etoposide (0.5 µM) (D) for 16 hours. For each peptide, the cytochrome c release of the no-drug (DMSO)-treated cells are subtracted from the drug-treated samples to derive the drug-induced change in priming (percent δ priming).
PPM1D-mutant cells have an abrogated apoptotic and cell-cycle response to chemotherapy. (A) Annexin V staining and flow cytometric analysis of Molm13 PPM1D-mutant and control single-cell clones exposed to 400 nM cytarabine or vehicle treatment of 24 hours. Data are shown as the means ± SD for biological replicates, and unpaired Student t tests were used for statistical analyses. (B) BrdU staining and flow cytometric analysis of Molm13 PPM1D-mutant and control single-cell clones after 24 hours of exposure to 100 nM cytarabine. Data are shown as the means ± SD for biological replicates and unpaired Student t tests were used to compare the cell-cycle progression in Molm13 PPM1D-mutant and control cells. (C-D) Molm13 PPM1D-mutant and control cells were exposed to cytarabine (0.25 µM) (C) or etoposide (0.5 µM) (D) for 16 hours. For each peptide, the cytochrome c release of the no-drug (DMSO)-treated cells are subtracted from the drug-treated samples to derive the drug-induced change in priming (percent δ priming).
We next used dynamic BH3 profiling to study mitochondrial priming of PPM1D-mutant cells. Dynamic BH3 profiling is a technique that assesses early changes in death signaling by measuring mitochondrial priming of tumor cells at baseline and after treatment. Decreased mitochondrial priming following treatment has been shown to be highly predictive of chemotherapy resistance in vitro and in vivo.20 Although there was no difference in mitochondrial priming of PPM1D-mutant and control cells at baseline (supplemental Figure 8A), PPM1D-mutant cells exhibited significantly decreased priming in response to treatment with both cytarabine and etoposide (Figure 4C-D), consistent with the diminished apoptotic response and chemotherapy resistance phenotype. In line with this, we found that peptide levels of the proapoptotic protein BAX were significantly decreased in PPM1D-mutant cells compared with control cells at baseline and in response to cytarabine treatment (supplemental Table 8). These data suggest that in the presence of chemotherapeutic agents, PPM1D-truncating mutations lead to a blunted DDR, resulting in a reduction in apoptosis, altered cell-cycle progression, and decreased mitochondrial priming.
PPM1D inhibition reverses PPM1D-induced chemotherapy resistance
We next used the allosteric PPM1D inhibitor GSK2830371 to determine whether selective PPM1D inhibition reversed the gain-of-function effects of PPM1D mutations. Having already established that GSK2830371 reverses the differential phosphoproteome of PPM1D-mutant cells by mass spectroscopy (Figure 3A,D), we confirmed by western blot that the addition of GSK2830371 restored the abrogated phosphorylation of p53 Ser15 in response to cytarabine (Figure 5A). In addition, although yH2AX levels were decreased in PPM1D-mutant cells compared with control cells at baseline and in response to cytarabine treatment, the addition of GSK2830371 to cytarabine treatment, or when used as a single agent, led to a strong increase of yH2AX levels in PPM1D-mutant cells (supplemental Figure 9). Exposure of cells to GSK2830371 also resulted in elevated levels of apoptosis in PPM1D-mutant cells as assessed by Annexin V staining (Figure 5B).
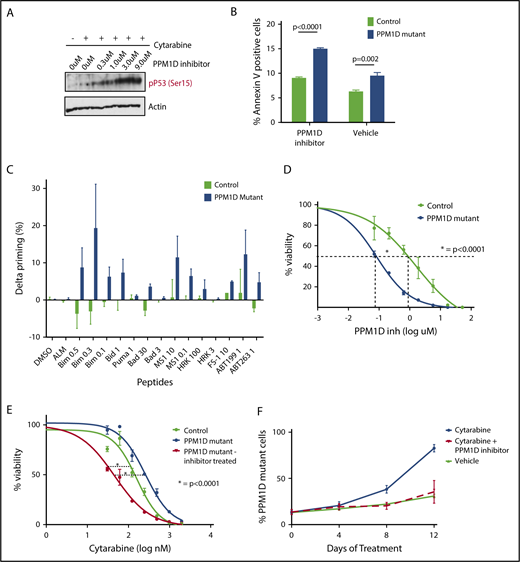
PPM1D inhibition with GSK2830371 reverses chemotherapy resistance and selectively targets PPM1D-mutant cells. (A) Whole-cell lysate of Molm13 PPM1D-mutant single-cell clones 1 hour pretreated with the indicated concentrations of GSK2830371 and exposed to 400 nM cytarabine or vehicle were probed for p53 Ser15 and Actin as a loading control (B) Annexin V staining and flow cytometric analysis of Molm13 PPM1D-mutant and control single-cell clones exposed to 3 μM GSK2830371. Experiments were performed in triplicate and data are shown as the means ± SD unpaired Student t tests were used to compare means. (C) Molm13 PPM1D-mutant and control cells were exposed to GSK2830371 0.25 µM for 16 hours. δ priming (%) consists of the cytochrome c release of the no-drug (DMSO)-treated cells subtracted from the drug-treated samples for each peptide. (D) Seventy-two-hour cell viability analysis in Molm13 PPM1D-mutant and control single-cell clones after exposure to increasing doses of GSK2830371. Data are shown as the means ± SD for biological triplicates and nonlinear logistic regression analyses and a sum of squares F test were performed for statistical analysis. (E) Viability analysis of Molm13 PPM1D-mutant cells and Molm13 control single-cell clones pretreated for 1 hour with 3 μM GSK2830371 or vehicle and exposed to increasing doses of 72-hour cytarabine treatment. Data are shown as the means ± SD for biological replicates. Nonlinear logistic regression analyses and a sum of squares F test were performed to compare the inhibitory response to cytarabine between Molm13 PPM1D-truncating mutant cells pretreated with GSK2830371 and Molm13 control cells, and Molm13 PPM1D-mutant cells. (F) Competition experiment with Molm13 PPM1D-mutant pooled cells and isogenic control pooled cells mixed in respectively a 1:9 ratio and exposed to 100 nM cytarabine, 100 nM cytarabine plus 100 nM GSK2830371, or vehicle treatment. Data are shown as the means ± SD for biological triplicates.
PPM1D inhibition with GSK2830371 reverses chemotherapy resistance and selectively targets PPM1D-mutant cells. (A) Whole-cell lysate of Molm13 PPM1D-mutant single-cell clones 1 hour pretreated with the indicated concentrations of GSK2830371 and exposed to 400 nM cytarabine or vehicle were probed for p53 Ser15 and Actin as a loading control (B) Annexin V staining and flow cytometric analysis of Molm13 PPM1D-mutant and control single-cell clones exposed to 3 μM GSK2830371. Experiments were performed in triplicate and data are shown as the means ± SD unpaired Student t tests were used to compare means. (C) Molm13 PPM1D-mutant and control cells were exposed to GSK2830371 0.25 µM for 16 hours. δ priming (%) consists of the cytochrome c release of the no-drug (DMSO)-treated cells subtracted from the drug-treated samples for each peptide. (D) Seventy-two-hour cell viability analysis in Molm13 PPM1D-mutant and control single-cell clones after exposure to increasing doses of GSK2830371. Data are shown as the means ± SD for biological triplicates and nonlinear logistic regression analyses and a sum of squares F test were performed for statistical analysis. (E) Viability analysis of Molm13 PPM1D-mutant cells and Molm13 control single-cell clones pretreated for 1 hour with 3 μM GSK2830371 or vehicle and exposed to increasing doses of 72-hour cytarabine treatment. Data are shown as the means ± SD for biological replicates. Nonlinear logistic regression analyses and a sum of squares F test were performed to compare the inhibitory response to cytarabine between Molm13 PPM1D-truncating mutant cells pretreated with GSK2830371 and Molm13 control cells, and Molm13 PPM1D-mutant cells. (F) Competition experiment with Molm13 PPM1D-mutant pooled cells and isogenic control pooled cells mixed in respectively a 1:9 ratio and exposed to 100 nM cytarabine, 100 nM cytarabine plus 100 nM GSK2830371, or vehicle treatment. Data are shown as the means ± SD for biological triplicates.
Similarly, dynamic BH3 profiling revealed that GSK2830371 induced significantly higher levels of mitochondrial priming in the PPM1D-mutant cells as compared with control cells (Figure 5C; supplemental Figure 8B-D), and we observed that PPM1D-mutant cells were more sensitive to GSK2830371 monotherapy (Figure 5D). Moreover, concurrent exposure with GSK2830371 increased the sensitivity of PPM1D-mutant cells to cytarabine in a 72-hour viability assay (Figure 5E).
Finally, to assess the effect of PPM1D inhibition on the competitive advantage of PPM1D-mutant cells during ongoing DNA damage, we repeated the competition assay in which PPM1D-mutant and control Molm13 cells were mixed at a 1:9 ratio and grown in the presence of cytarabine, cytarabine and GSK2830371, or vehicle. Whereas PPM1D-mutant cells outcompeted isogenic control cells in the presence of cytarabine, concurrent treatment with GSK2830371 completely reversed this effect (Figure 5F). This result was p53 dependent, as PPM1D-mutant Molm13 cells that also carried homozygous loss-of-function TP53 mutations did not respond to treatment with GSK2830371 (supplemental Figure 10A-B). In line with this, loss of TP53 in PPM1D-mutant cells led to decreased apoptotic priming (supplemental Figure 11) in response to GSK2830371 treatment and reversed the sensitizing effect of GSK2830371 treatment in PPM1D-mutant cells exposed to cytarabine (supplemental Figure 10C).
Discussion
The enrichment of PPM1D-truncating mutations in the blood of patients that have previously been exposed to chemotherapy, including patients with t-MNs, led us to hypothesize that these mutations confer a selective advantage to hematopoietic cells in the presence of DNA-damaging agents.6,9,11,13,14 After identifying this enrichment in multiple human datasets, we generated in vitro and in vivo models and confirmed that PPM1D mutations confer chemoresistance and a selective advantage to hematopoietic cells in the presence of chemotherapy. Using CRISPR-Cas9 mutational profiling spanning PPM1D, we demonstrated that chemotherapy selected for the same exon 6 mutations identified in patient samples.
Based on these findings, we propose a model wherein hematopoietic stem cells carrying PPM1D mutations expand under the selective pressure of chemotherapy and potentially lead to the initiating lesion in t-MDS. Our data suggest that this is mediated by suppression of DDR generally, and p53 specifically. Notably, TP53 mutations are also associated with t-MNs and expand during chemotherapy treatment.27 Although TP53 mutations are associated with a complex karyotype and poorer prognosis, PPM1D mutations are not, demonstrating that the biology and clinical phenotype associated with PPM1D mutations are distinct from p53 inactivation.6 The phosphoproteomic data described in this report support this rationale, as PPM1D mutations were found to alter phosphorylation of many components of the DDR pathway, not only p53. The distinct and overlapping effects of PPM1D and TP53 mutations in clonal expansion and myeloid malignancies will be an important area for future investigation.
In contrast to many previously identified mutations in clonal hematopoiesis and myeloid neoplasms, PPM1D mutations resulted in increased levels and activity of the protein product. Phosphoproteomic analysis identified a consensus PPM1D target sequence and highlighted phosphorylation changes of many target proteins, including those in the DDR pathway. The cellular consequences of the dampened DDR were decreased apoptosis, altered cell-cycle kinetics, and impaired mitochondrial priming, which likely drive the chemoresistance phenotype. We show that selective inhibition of PPM1D using a small molecule reversed the phosphoproteomic, apoptotic, mitochondrial priming, and chemoresistance phenotype. Finally, PPM1D-mutant cells were hypersensitive to PPM1D inhibition, likely reflecting a rewiring of the pathway and relative dependence on the elevated PPM1D activity.
These results highlight potential new therapeutic opportunities. For example, a PPM1D inhibitor might be used to prevent chemotherapy-induced outgrowth of PPM1D-mutant hematopoietic stem cells in patients undergoing cytotoxic chemotherapy, potentially decreasing the risk of t-MN development. PPM1D inhibitors may also be used in patients with PPM1D-mutant myeloid neoplasms, particularly in therapy-related diseases, which continue to be highly lethal, chemotherapy-resistant cancers in great need of new treatment options.
The online version of this article contains a data supplement.
The publication costs of this article were defrayed in part by page charge payment. Therefore, and solely to indicate this fact, this article is hereby marked “advertisement” in accordance with 18 USC section 1734.
Acknowledgments
Many thanks to Quinlan Sievers for providing the degradation reporter vector and to Adam Sperling for his valuable guidance with the project.
This work was supported by the National Institutes of Health (National Heart, Lung, and Blood Institute R01HL082945 and National Cancer Institute P01CA108631), the Howard Hughes Medical Institute, the Edward P. Evans Foundation, and the Leukemia & Lymphoma Society. S.J. was supported by a Burroughs Welcome Career Award for Medical Sciences. J.D.K. was supported by the Nederlandse Organisatie voor Wetenschappelijk Onderzoek (NWO) Diamond Fellowship. R.S.S. was supported by the Kay Kendall Leukaemia Fund.
Authorship
Contribution: J.D.K., P.G.M., S.J., and B.L.E. designed the study, performed experiments and wrote the paper; A.J.S., R.S.S., M.M., D.A., S.B., H.Z., P.M., S.F., and K.K. performed research and analyzed experiments; C.G. provided experimental data; B.M. assisted in experimental design; and A.L., S.A.C., and J.D. oversaw experiments, analyzed data, and helped write the manuscript.
Conflict-of-interest disclosure: A.L. is a cofounder, paid consultant, and paid equity holder in Vivid Bioscience. The remaining authors declare no competing financial interests.
Correspondence: Benjamin L. Ebert, Department of Medical Oncology, Dana-Farber Cancer Institute, 4 Blackfan Circle, Harvard Institute of Medicine 743, Boston, MA 02115; e-mail: benjamin_ebert@dfci.harvard.edu.

This feature is available to Subscribers Only
Sign In or Create an Account Close Modal