Key Points
The coagulation protease aPC compensates for defective insulin signaling through ER reprogramming.
PI3Kinase p85α, p85β, and the ER transcription factor XBP1 mechanistically link aPC signaling to ER homeostasis in diabetic nephropathy.
Abstract
Coagulation proteases have increasingly recognized functions beyond hemostasis and thrombosis. Disruption of activated protein C (aPC) or insulin signaling impair function of podocytes and ultimately cause dysfunction of the glomerular filtration barrier and diabetic kidney disease (DKD). We here show that insulin and aPC converge on a common spliced-X-box binding protein-1 (sXBP1) signaling pathway to maintain endoplasmic reticulum (ER) homeostasis. Analogous to insulin, physiological levels of aPC maintain ER proteostasis in DKD. Accordingly, genetically impaired protein C activation exacerbates maladaptive ER response, whereas genetic or pharmacological restoration of aPC maintains ER proteostasis in DKD models. Importantly, in mice with podocyte-specific deficiency of insulin receptor (INSR), aPC selectively restores the activity of the cytoprotective ER-transcription factor sXBP1 by temporally targeting INSR downstream signaling intermediates, the regulatory subunits of PI3Kinase, p85α and p85β. Genome-wide mapping of condition-specific XBP1-transcriptional regulatory patterns confirmed that concordant unfolded protein response target genes are involved in maintenance of ER proteostasis by both insulin and aPC. Thus, aPC efficiently employs disengaged insulin signaling components to reconfigure ER signaling and restore proteostasis. These results identify ER reprogramming as a novel hormonelike function of coagulation proteases and demonstrate that targeting insulin signaling intermediates may be a feasible therapeutic approach ameliorating defective insulin signaling.
Introduction
Diabetic kidney disease (DKD), a leading diabetic complication, causes end-stage renal failure and is the strongest predictor of mortality in diabetic patients. Efficient therapies arresting or even reversing DKD progression are lacking.1 One of the earliest lesions of DKD is loss of podocytes (specialized glomerular epithelial cells).1,2 Podocyte function is regulated by insulin and coagulation proteases.3,4 Genetic or diabetes-associated impaired insulin signaling in podocytes promotes maladaptive endoplasmic reticulum (ER) signaling, which is mechanistically linked to DKD.5,6 Whether coagulation proteases interact with insulin and ER signaling remains unknown.
Activation of the ER–stress response by accumulation of unfolded proteins is a multistep process involving 3 major pathways. These canonical unfolded protein response (UPR) signaling pathways include ER-stress sensor proteins IRE1 (inositol requiring enzyme 1), PERK (double-stranded RNA-activated protein kinase–like ER kinase), and ATF6 (activating transcription factor 6).6,7 IRE1 has endoribonuclease activity–mediating splicing of X-box binding protein precursor messenger RNA yielding the active transcription factor spliced XBP1 (sXBP1). A pivotal function of XBP1 in coordinating the UPR is evolutionary conserved, and XBP1 regulates essential functions, including metabolism.8,9 In insulin-sensitive tissues, XBP1 mediates essential functions, endowing XBP1 with an important function in metabolism.10-13 In podocytes, ER homeostasis is regulated by insulin signaling through insulin receptor (INSR) and regulation of the UPR via sXBP1.5 Defective insulin signaling in type 1 and type 2 experimental models of DKD impairs nuclear translocation of sXBP1, triggering an ATF6-CHOP (C/EBP homologous protein)–dependent maladaptive ER response. Analysis of renal biopsies demonstrates impaired nuclear sXBP1 translocation in patients with DKD, suggesting that the maladaptive ER response is a conserved pathogenetic pathway in human DKD.5
Improving blood glucose control partially restores renal function at early, but not at advanced, stages of DKD, illustrating the need for new therapeutic approaches.14 So-called insulin-sensitizing glitazones can provide renal protection through an unknown mechanism, but their use is severely limited due to side effects.15 The renoprotective effect of glitazones suggests that targeting the insulin-dependent homeostatic pathway may constitute a new therapeutic target in DKD. However, pathways allowing rescue of renal insulin signaling remain unknown.
Coagulation proteases have been proposed to convey hormonelike activities.16 Intriguingly, DKD is associated with activation of the coagulation system, in part due to impaired thrombomodulin (Thbd) dependent–protein C (PC) activation.5,17 The serine-protease activated protein C (aPC) conveys nephroprotective effects in animal models of acute and chronic kidney diseases.5,17,18 In diabetic animals, aPC protects podocytes and glomerular endothelial cells from glucose-induced dysfunction, thus protecting insulinopenic mice from DKD.17 To investigate whether the coagulation protease aPC rescues defective insulin signaling, we first characterized the impact of Thbd-dependent PC activation on the regulation of UPR in DKD. After establishing a function of aPC in maintaining ER homeostasis, we analyzed the effect of aPC in mice with podocyte-specific INSR deletion.
Methods
Animals
ThbdPro/Pro, INSRflox/flox, XBP1flox/flox, and PI3KR1flox/flox (p85α) mice (obtained from The Jackson Laboratory) were crossed with PodCre mice (provided by Marcus J. Moeller) to generate mice with podocyte-specific deletion of XBP1 and INSR.5 PI3KR2 (p85β) knockout mice were obtained from The Jackson Laboratory. APChigh mice have been previously described.17 These mice express a transgene in the liver-inducing expression of a human PC variant (D167F/D172K). The D167F/D172K PC variant can be efficiently activated in the absence of Thbd, resulting in high plasma concentrations of aPC. All mice were backcrossed onto the C57BL/6J background for at least 8 generations and were routinely maintained on the C57BL/6J background. Only littermates were used as controls in the current study. The presence of targeted genes and transgenes was routinely determined by polymerase chain reaction (PCR) analyses of tail DNA. Wild-type C57BL/6J and db/db (C57BL/KSJRj-db) mice were obtained from Janvier Labs (France). Animal experiments were conducted following standards and procedures approved by the local animal care and use committee (Landesverwaltungsamt, Halle, Germany).
DKD model in mice
Insulinopenia and persistent hyperglycemia were induced in experimental mice using low-dose streptozotocin (STZ, 60 mg/kg, freshly dissolved in 0.05 M sterile sodium citrate, pH 4.5) on 5 successive days in 8-week-old mice as described.5,17,19 To study the consequences of insulin resistance, db/db mice were used. For further details, see supplemental Methods, available on the Blood Web site.
A subgroup of mice received various interventions. We intraperitoneally (IP) injected either tauroursodeoxycholic acid (TUDCA; 150 mg/kg body weight, dissolved in saline) or saline once daily starting 18 weeks after the last STZ injection until 1 day before analyses (week 26) in some mice.5 In other mice, we IP injected aPC (1 mg/kg body weight, every alternate day) or an equal volume of saline. In addition, in a subgroup of mice, aPC was preincubated before injection with the HAPC1573 antibody at a 1:1 ratio for 10 minutes under gentle agitation to block its anticoagulant activity.20,21 Human aPC was used throughout the study, which was generated following an established protocol.22
Determination of albuminuria
The day before blood sample collection and tissue preparation, mice were individually placed in metabolic cages for 24 hours, and urine samples were collected. We determined urine albumin using a mouse albumin enzyme-linked immunosorbent assay kit, according to the manufacturer's instructions, and urine creatinine, with a modified version of the Jaffe method using a commercially available assay (Xpand automated platform; Siemens, Eschborn, Germany).5,17
Determination of blood urea nitrogen (BUN)
Mice were anesthetized with sodium ketamine (100 mg/kg body weight, IP) and xylazine (10 mg/kg body weight, IP) and euthanized. Blood samples were obtained from the inferior vena cava and collected into tubes prefilled with sodium citrate (final concentration 0.38%). Plasma was obtained by centrifugation at 200g for 10 minutes. BUN was measured using a kinetic test kit with urease (Cobas c501 module; Roche Diagnostics).22
Cell culture
Conditionally immortalized mouse podocytes and human podocytes were cultured as described elsewhere.5 In brief, podocytes were routinely grown on plates coated with collagen type 1 at 33°C in the presence of interferon γ (10 U/mL) to enhance expression of a thermosensitive T antigen. Under these conditions, cells proliferate and remain undifferentiated. To induce differentiation, podocytes were grown at 37°C in the absence of interferon γ for 14 days. Experiments were performed after 14 days of differentiation. Differentiation was confirmed by determining expression of synaptopodin and Wilms tumor-1 protein. At desired time points post aPC or insulin treatment in serum-free medium, cytosolic and nuclear lysates were prepared for immunoblot analysis. Likewise, 3 hours post aPC, insulin or concomitant aPC and insulin treatment, RNA was isolated,5 and subsequently, complementary DNA was synthesized for gene expression analysis. UPR-specific 96-well-format PCR arrays were obtained from SABiosciences QIAGEN, and gene expression analysis was performed in real-time PCR (Bio-Rad-CFX Connect) according to the manufacturer’s instructions. For a selective set of UPR genes, quantitative PCR was performed using SYBR Green (Thermo Scientific, Germany). Primers and further details are given in supplemental Table 1. The messenger RNA levels of the genes tested were normalized to β-actin as an internal control.
In situ proximity-ligation assay
A Duolink in situ proximity ligation assay (PLA) kit was used according to the manufacturer’s instructions (Olink Biosciences, Sigma Aldrich).5 Briefly, differentiated mouse podocytes were plated on collagen-coated glass coverslips and fixed in 3.7% paraformaldehyde only or additionally in methanol. Coverslips were washed (3× phosphate-buffered saline or phosphate-buffered saline + 0.2% Triton X-100, each 10 minutes) and blocked in the blocking buffer provided (DuoLink in situ PLA kit) for 1 hour. Sections were then incubated (overnight, 4°C) with 2 primary antibodies raised in different species and recognizing the target antigens of interest used. After washing (2× buffers A and B provided in the kit, each 10 minutes), sections were incubated with species-specific secondary antibodies with a unique short DNA strand attached (PLA probes). Antibody-attached oligonucleotides were linked by enzymatic ligation and amplified via rolling circle amplification using a polymerase, and amplified DNA was detected by fluorescent-labeled complementary oligonucleotide probes. For quantification of PLA, data images were taken using an Olympus microscope (BX43; Germany). The exposure settings and gain of laser were kept the same for each condition. Thirty fields were acquired per condition, a single focal plane by field. Before beginning analysis, images were converted to 8-bit images on ImageJ-Fiji. A threshold range was set to distinguish the objects of interest from the background. Automated particle analysis was used to detect the nuclei count. To exclude “noise,” the size of particles was defined to be larger than 150 pixels2, and roundness values were limited to 0.00 to 1.00. The accumulative counts for each cell type appeared in the Counters menu. After counting the cells within the region of interest, the size of the region of interest was calculated and used to identify the number of cells labeled per image. To count the PLA-positive signals, Point Picker plugin was used. The Point List dialog enabled the calculation of PLA-positive signals in the nucleus and cytoplasm.
Cell fractionation
For isolation of cytosolic and nuclear fractions, renal cortex samples were lysed using tissue homogenizer in buffer A containing 10 mM N-2-hydroxyethylpiperazine-N′-2-ethanesulfonic acid–potassium hydroxide (HEPES-KOH; pH 7.9), 10 mM KCl, 1.5 mM MgCl2, 1 mM EDTA, 0.6% nonyl phenoxypolyethoxylethanol type 40, 0.5 mM dithiothreitol (DTT), and protease inhibitor cocktail (Roche), and lysates were incubated for 10 minutes on ice. After brief vortexing, the lysates were centrifuged for 30 seconds at 13 000g at 4°C. Supernatants were collected as cytosolic fractions, and the pellets were resuspended in 100 µL of buffer B containing 10 mM HEPES-KOH (pH 7.9), 25% glycerol, 420 mM NaCl, 1.5 mM MgCl2, 0.2 mM EDTA, 0.5 mM DTT, and protease inhibitors. Lysates were incubated for 20 minutes on ice followed by centrifugation at 13 000g at 4°C for 5 minutes. Supernatants containing the nuclear extracts were collected and stored at −80°C.5 A similar procedure was used for isolation of cytosolic and nuclear fractions of cells where buffer A contains 10 mM HEPES-KOH (pH 7.9), 10 mM KCl, 1.5 mM MgCl2, 0.5 mM DTT, and protease inhibitors.5 Protein concentration was measured using Bradford reagent, and purity of nuclear and cytoplasmic fractions was determined by lamin A/C and actin western blots, respectively.
Chromatin immunoprecipitation assay
Chromatin immunoprecipitation (ChIP) assay was performed with Enzymatic Chromatin IP kit (magnetic beads; Cell Signaling Technology) according to the manufacturer’s instructions. Briefly, unstressed podocytes on day 14 after complete differentiation were treated with low-dose insulin (20 nM) or aPC (20 nM). Three hours posttreatment with insulin or aPC, cells were fixed with paraformaldehyde and lysed. Chromatin was fragmented by partial digestion with micrococcal nuclease to obtain chromatin fragments of 1 to 5 nucleosomes. ChIP assays were performed using antibody against spliced-XBP1 (MAB4257; R&D Biosystems) and ChIP-grade Protein G magnetic beads. After reversal of protein-DNA crosslinks, the DNA was purified using DNA purification spin columns, allowing for efficient recovery of DNA and removal of protein contaminants. The enrichment of specific XBP1 target genes was validated using quantitative real-time PCR. The sequence libraries were generated, and sequencing was performed on a Hisequation 2000 Illumina (core facility, Helmholtz Centre for Infection Research, Braunschweig, Germany).
CHIP and whole genome sequencing dataset analysis
Sequence reads were mapped to the mouse genome database mm10 reference genome assembly with Bowtie2.0, and the latest version of samtool was used to obtain the BAM file from SAM file.23,24 To identify significantly enriched transcription factor binding sites, MATLAB was used. Peak enrichment for each gene covering ±500 bases was determined, and binning algorithm was applied to explore the coverage for the whole range of the genome. Finally, we identified and filtered the regions with artifacts before generating the files with gene names, number of peaks, and gene coordinates for the respective experiments.
Statistical analysis
Data are summarized as the mean ± standard error of the mean (SEM). The Kolmogorov-Smirnov test was used to determine whether the data are consistent with a Gaussian distribution. Statistical analyses were performed with the Student t test or analysis of variance (ANOVA) as appropriate. Post hoc comparisons of ANOVA were corrected with the method of Tukey. StatistiXL software (http://www.statistixl.com) and Prism 7 (www.graphpad.com) software were used for statistical analyses. Statistical significance was accepted at values of P < .05.
Results
aPC regulates ER-homeostasis in DKD
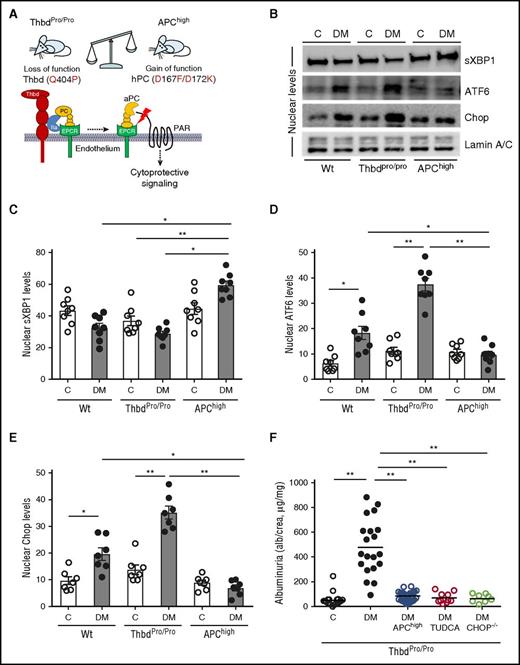
Considering the nephroprotective effects of aPC and the role of the UPR in DKD, we speculated that aPC modulates the renal ER response in DKD. To ascertain the function of endogenous PC activation in UPR regulation in DKD, we analyzed mice with STZ-induced persistent hyperglycemia and either loss (secondary to impaired PC activation, ThbdPro/Pro) or gain (transgenic mice expressing a hyperactivatable PC variant, APChigh) of function within the Thbd-PC system (Figure 1A).17 Compared with wild-type mice, impaired PC activation in ThbdPro/Pro mice aggravated the maladaptive renal UPR, characterized by impaired nuclear translocation of sXBP1 and heightened nuclear ATF6 and CHOP levels (Figure 1B-E; supplemental Figure 1A-C). These changes were associated with aggravated DKD (Figure 1F; supplemental Figure 1D-G). Conversely, in APChigh mice, nuclear levels of sXBP1 were normal, expression of ATF6 and CHOP was reduced, and mice were protected from DKD despite persistent hyperglycemia (Figure 1B-E; supplemental Figure 1). Restoring aPC levels in ThbdPro/Pro mice by crossing ThbdPro/Pro with APChigh mice or relieving ER stress in ThbdPro/Pro mice using TUDCA reduced albuminuria and the maladaptive ER response (Figure 1F; supplemental Figure 1C). These effects were comparable to that of superimposed CHOP−/− deficiency in ThbdPro/Pro mice (Figure 1F). These data identify a function of Thbd-dependent PC activation in controlling ER response patterns and suggest that aPC, similar to insulin,5 can reprogram the UPR in DKD.
UPR regulation by the Thbd-PC system. (A) Schematic illustration of Thbd-dependent PC activation on endothelial cells and of molecular defects in employed mouse models with altered Thbd-dependent PC activation. (B-E) Representative immunoblots (B) and bar graphs (C-E) showing nuclear levels of ER transcription factors in renal cortex samples 26 weeks post STZ treatment. (F) Restoring aPC levels or inhibition of ER stress with the chemical chaperone TUDCA or deletion of CHOP (CHOP−/− mice) protects ThbdPro/Pro mice against DKD. Dot plot summarizing albuminuria. C, nondiabetic control mice; DM, diabetic mice; EPCR, endothelial protein C receptor. Mean ± SEM of at least 6 (C-E) or 8 (F) mice per group. *P < .05; **P < .01 (C-E: ANOVA).
UPR regulation by the Thbd-PC system. (A) Schematic illustration of Thbd-dependent PC activation on endothelial cells and of molecular defects in employed mouse models with altered Thbd-dependent PC activation. (B-E) Representative immunoblots (B) and bar graphs (C-E) showing nuclear levels of ER transcription factors in renal cortex samples 26 weeks post STZ treatment. (F) Restoring aPC levels or inhibition of ER stress with the chemical chaperone TUDCA or deletion of CHOP (CHOP−/− mice) protects ThbdPro/Pro mice against DKD. Dot plot summarizing albuminuria. C, nondiabetic control mice; DM, diabetic mice; EPCR, endothelial protein C receptor. Mean ± SEM of at least 6 (C-E) or 8 (F) mice per group. *P < .05; **P < .01 (C-E: ANOVA).
aPC maintains ER-homeostasis despite defective insulin signaling
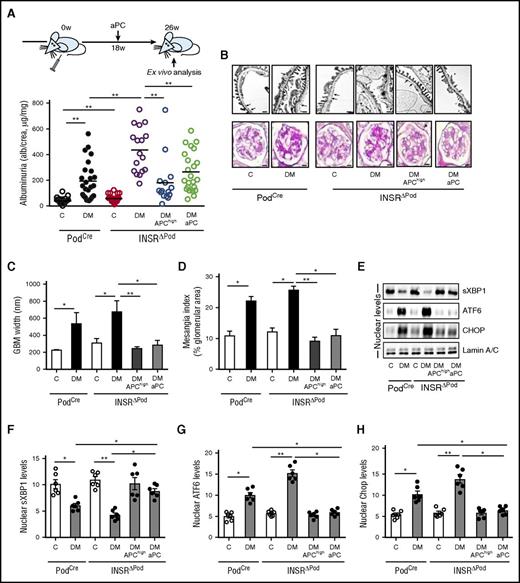
To determine the effect of aPC on DKD in mice lacking the INSR in podocytes, we analyzed INSRΔPod mice (INSRLoxP/LoxP × PodCre) without and with aPC interventions. Upon induction of diabetes with STZ, INSRΔPod mice developed exacerbated DKD, characterized by increased albuminuria, plasma BUN, glomerular basement membrane thickness, tight-slit pore density, and fraction mesangial area in comparison with control (INSRwt × PodCre) mice (Figure 2A-D; supplemental Figure 2). These changes were associated with impaired nuclear translocation of sXBP1 and heightened ATF6-CHOP–dependent maladaptive ER response (Figure 2E-H). Remarkably, transgenic overexpression of aPC (APChigh mice) or treatment with aPC after the disease onset (18 weeks post STZ; Figure 2A) protected INSRΔPod mice against DKD (Figure 2A-D; supplemental Figure 2). Importantly, both interventions restored nuclear sXBP1 levels and prevented the ATF6- and CHOP-dependent maladaptive ER response observed in diabetic INSRΔPod mice (Figure 2E-H).
Activated PC rescues defective insulin signaling in DKD. (A-D) Schematic illustration of interventional studies in mice with STZ-induced hyperglycemia (A, top). Dot plot summarizing albuminuria (A, bottom); representative images and bar graph of the glomerular filtration barrier (B, upper panel; C, transmission electron microscopy; GBM, glomerular basement membrane, arrows; scale bar: 2 µm). Representative images and bar graph showing extracellular matrix deposition (B, lower panel; D, PAS staining; scale bar: 20 µm). (E-H) Representative immunoblots (E) and bar graphs (F-H) showing nuclear levels of ER transcription factors in renal cortex samples. C, control mice without diabetes; DM, diabetic mice. Mean ± SEM of at least 15 (A), 10 (C-D), or 6 (F-H) mice per group. *P < .05; **P < .01 (C-D, F-H: ANOVA).
Activated PC rescues defective insulin signaling in DKD. (A-D) Schematic illustration of interventional studies in mice with STZ-induced hyperglycemia (A, top). Dot plot summarizing albuminuria (A, bottom); representative images and bar graph of the glomerular filtration barrier (B, upper panel; C, transmission electron microscopy; GBM, glomerular basement membrane, arrows; scale bar: 2 µm). Representative images and bar graph showing extracellular matrix deposition (B, lower panel; D, PAS staining; scale bar: 20 µm). (E-H) Representative immunoblots (E) and bar graphs (F-H) showing nuclear levels of ER transcription factors in renal cortex samples. C, control mice without diabetes; DM, diabetic mice. Mean ± SEM of at least 15 (A), 10 (C-D), or 6 (F-H) mice per group. *P < .05; **P < .01 (C-D, F-H: ANOVA).
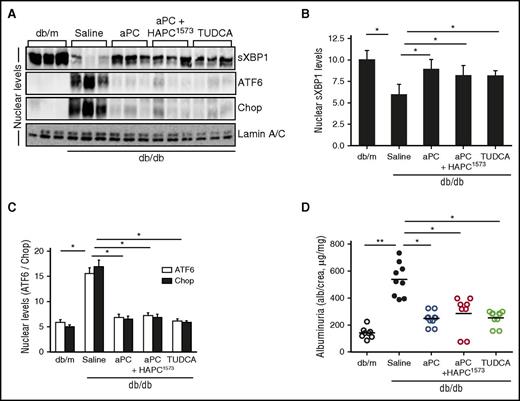
Next, we evaluated the UPR-modulating effect of aPC in mice with obesity-induced insulin resistance (db/db mice), resembling type 2 diabetes mellitus.25 Treatment of db/db mice with aPC after disease onset (from age 16 weeks) reduced DKD and, importantly, restored nuclear sXBP1 levels while averting the ATF6-CHOP–dependent maladaptive ER response (Figure 3A-D; supplemental Figure 3). The signaling properties of aPC are sufficient for its nephroprotective and UPR-reprogramming effect, because preincubation of aPC with the monoclonal antibody (HAPC1573), which specifically blocks aPC’s anticoagulant function, did not impede aPC’s effect.20 The chemical chaperone TUDCA, known to stabilize ER function,5 likewise restored nuclear sXBP1 while averting the ATF6-CHOP–mediated maladaptive UPR and protected from DKD in db/db mice (Figure 3A-C; supplemental Figure 3), demonstrating that stabilizing ER function is sufficient to avert DKD. Taken together, in mouse models with genetically superimposed podocyte-specific insulin signaling deficiency (INSRΔPod mice) or insulin resistance (db/db mice), aPC reprograms the UPR and conveys strong nephroprotection independent of blood glucose and body weight reduction.
Activated PC rescues defective insulin signaling in DKD. (A-D) DKD in insulin-resistant db/db mice without (saline) or with various interventions. Representative immunoblots (A) and bar graphs (B-C) showing nuclear levels of ER transcription factors in renal cortex samples. Dot plot summarizing albuminuria (D). db/m, control mice without diabetes; aPC+HAPC1573, aPC preincubated with the monoclonal HAPC1573 antibody. Mean ± SEM of at least 6 (B-C) or 8 (D) mice per group. *P < .05; **P < .01 (B-D: ANOVA).
Activated PC rescues defective insulin signaling in DKD. (A-D) DKD in insulin-resistant db/db mice without (saline) or with various interventions. Representative immunoblots (A) and bar graphs (B-C) showing nuclear levels of ER transcription factors in renal cortex samples. Dot plot summarizing albuminuria (D). db/m, control mice without diabetes; aPC+HAPC1573, aPC preincubated with the monoclonal HAPC1573 antibody. Mean ± SEM of at least 6 (B-C) or 8 (D) mice per group. *P < .05; **P < .01 (B-D: ANOVA).
ER homeostasis by aPC requires PI3K and XBP1
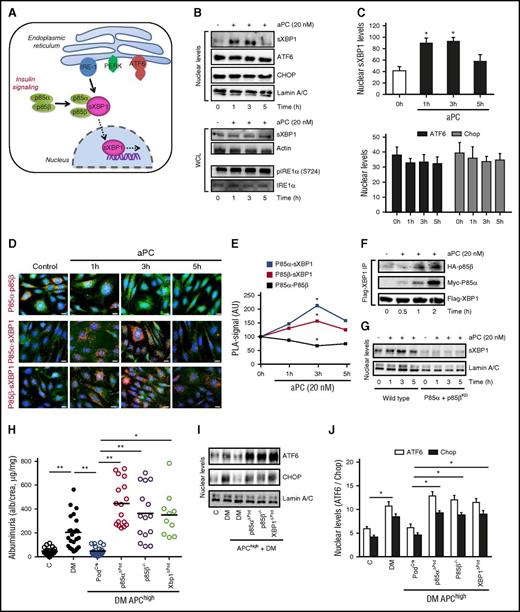
Physiological ER homeostasis relies on mechanisms maintaining adaptive UPR signaling while suppressing cell-death promoting signals.26 Given the remarkable nephroprotective and ER-homeostatic effect of aPC in diabetic INSRΔPod mice, we next investigated whether aPC, akin to insulin (Figure 4A),5 regulates stress-independent physiological UPR in podocytes. Indeed, exposure of podocytes to aPC temporally induced nuclear translocation of sXBP1 independent of IRE-1 activation, whereas the nuclear levels of ATF6 and CHOP remained unchanged (Figure 4B-C), mimicking insulin’s effect.5 Mouse aPC likewise temporally induced nuclear translocation of sXBP1 without affecting ATF6 and CHOP levels in resting podocytes (supplemental Figure 4). Insulin signaling via INSR dissociates the regulatory subunits p85α/p85β of phosphatidylinositol-4,5-bisphosphate 3-kinase (PI3Kinase), promoting their interaction with sXBP1 and thereby facilitating nuclear translocation of sXBP1 independent of IRE-1 activation (Figure 4A).5,11,13 In a similar fashion, aPC temporally induced dissociation of p85α and p85β (Figure 4D-E) and induced complex formation of p85α/p85β with sXBP1 (Figure 4D-F) in resting podocytes. Thus, akin to insulin, aPC promotes nuclear translocation of sXBP1 via heterodimerization with p85α/p85β (Figure 4G; supplemental Figure 5). Coagulation proteases signal through G protein–coupled protease activated receptors (PARs) in a cell-specific manner.4,27 In podocytes, but not in glomerular endothelial or tubular cells, aPC’s cytoprotective effect requires PAR3.5,28 Congruently, aPC failed to promote nuclear translocation of sXBP1 in PAR3 knockdown podocytes, establishing that PAR3 is required for aPC-mediated UPR reprogramming in podocytes (supplemental Figure 6A). PAR3 is generally considered to be signaling incompetent and requires PAR1 as a coreceptor on murine podocytes.20 In concordance, inhibition of PAR1 expression abolished aPC’s effect on nuclear translocation of sXBP1 (supplemental Figure 6B). Hence, the adaptive UPR induced by insulin and aPC employs the same intracellular signaling hub but structurally disjunct receptor mechanisms.
UPR-reprogramming by aPC depends on p85-sXBP1 signaling. (A) Schematic illustration of homeostatic insulin-dependent ER signaling. (B-C) Representative immunoblots (B, top) and bar graphs (C) showing nuclear levels of sXBP1, ATF6, Chop, and Lamin A/C (loading control) and total sXBP1 levels or phosphorylated IRE1α in whole cell lysates (B, bottom) without or post aPC (20 nM) treatment at indicated time points. (D-E) Treatment with aPC dissociates p85α and p85β protein complexes (D, red, top), while promoting interaction of p85α or p85β with sXBP1 (D, middle and bottom, respectively). Representative immunofluorescence images showing protein complexes (red, PLA). Corresponding line graphs (E) summarizing PLA-positive signals. AU, arbitrary units. PLA complexes (red); nuclear stain DAPI (blue); actin cytoskeleton-phalloidin staining (green). (F) Representative immunoblots showing immunoprecipitates of XBP1 bound to p85α and p85β in resting mouse podocytes without or post aPC (20 nM) treatment at indicated time points. (G) Representative immunoblots showing nuclear levels of sXBP1 in control (control, short hairpin RNA) and p85α and p85β knockdown mouse podocytes without or post aPC (20 nM) treatment at indicated time points. (H-J) DKD in APChigh mice without (PodCre) or with podocyte-specific p85α deficiency or sXBP1 deficiency or constitutive p85β deficiency. Dot plot summarizing albuminuria (H) and representative immunoblots (I) and bar graph (J) showing nuclear levels of ER transcription factors in renal cortex samples. Mean ± SEM of at least 3 independent repeat experiments (C,E) or at least 10 (H) or 8 (J) mice per group. *P < .05; **P < .01 (C,E,H,J: ANOVA). WCL, whole-cell lysates.
UPR-reprogramming by aPC depends on p85-sXBP1 signaling. (A) Schematic illustration of homeostatic insulin-dependent ER signaling. (B-C) Representative immunoblots (B, top) and bar graphs (C) showing nuclear levels of sXBP1, ATF6, Chop, and Lamin A/C (loading control) and total sXBP1 levels or phosphorylated IRE1α in whole cell lysates (B, bottom) without or post aPC (20 nM) treatment at indicated time points. (D-E) Treatment with aPC dissociates p85α and p85β protein complexes (D, red, top), while promoting interaction of p85α or p85β with sXBP1 (D, middle and bottom, respectively). Representative immunofluorescence images showing protein complexes (red, PLA). Corresponding line graphs (E) summarizing PLA-positive signals. AU, arbitrary units. PLA complexes (red); nuclear stain DAPI (blue); actin cytoskeleton-phalloidin staining (green). (F) Representative immunoblots showing immunoprecipitates of XBP1 bound to p85α and p85β in resting mouse podocytes without or post aPC (20 nM) treatment at indicated time points. (G) Representative immunoblots showing nuclear levels of sXBP1 in control (control, short hairpin RNA) and p85α and p85β knockdown mouse podocytes without or post aPC (20 nM) treatment at indicated time points. (H-J) DKD in APChigh mice without (PodCre) or with podocyte-specific p85α deficiency or sXBP1 deficiency or constitutive p85β deficiency. Dot plot summarizing albuminuria (H) and representative immunoblots (I) and bar graph (J) showing nuclear levels of ER transcription factors in renal cortex samples. Mean ± SEM of at least 3 independent repeat experiments (C,E) or at least 10 (H) or 8 (J) mice per group. *P < .05; **P < .01 (C,E,H,J: ANOVA). WCL, whole-cell lysates.
To ascertain the physiological relevance of aPC for UPR reprogramming via p85-dependent sXBP1 nuclear translocation in vivo, we generated APChigh mice with conditional podocyte-specific deletion of XBP1 (APChigh × XBP1flox/flox × PodCre) or p85α (APChigh × p85αflox/flox × PodCre) or with constitutive p85β deficiency (APChigh × p85β−/−). Deletion of XBP1, p85α, or p85β in APChigh mice had no effect on baseline albuminuria (supplemental Figure 7A) but abolished the protective effect of aPC in DKD (Figure 4H; supplemental Figure 7B-G). Failure of renal protection in XBP1-, p85α-, or p85β-deficient mice despite high aPC plasma levels was associated with an UPR maladaptive response (Figure 4I-J), mirroring the response observed in diabetic ThbdPro/Pro mice (Figure 1B-D) and diabetic INSRΔPod or db/db (Figures 2E and 3A) mice. Thus, insulin and aPC require the same signaling hub to maintain ER homeostasis and to protect from DKD.
Insulin and aPC concordantly regulate XBP1-dependent gene expression
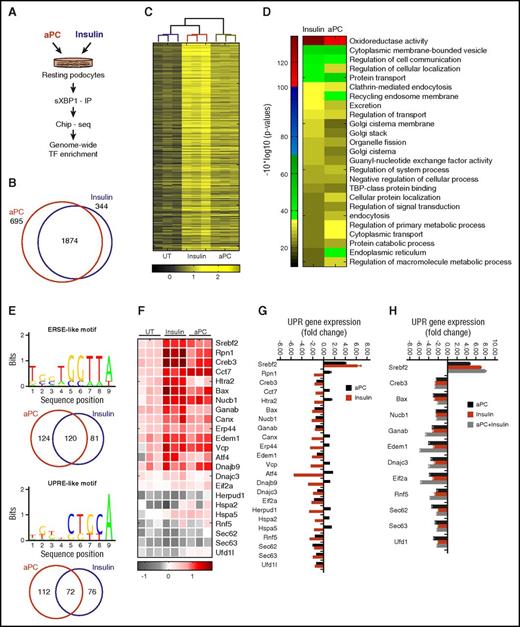
Apart from regulation of ER function in highly secretory cells, XBP1 constitutively maintains cellular homeostasis in nonsecretory cells, including podocytes.5 Considering the signaling redundancy of insulin and aPC via XBP1, we hypothesized that aPC induces XBP1 target genes and intracellular pathways similar to insulin. To this end, we determined genome-wide XBP1 targeted genes by ChIP and whole genome sequencing in unstressed podocytes exposed to insulin or aPC (Figure 5A). Analysis of sXBP1-enriched regions that cover 500 bp upstream and downstream of transcription starting sites of ∼19 000 known mouse genes revealed enrichment of condition-specific (insulin: 344; aPC: 695) and overlapping (insulin + aPC: 1874) XBP1 targets (Figure 5B-C). We identified high-confidence XBP1 targets using gene ontology and clustered them into insulin-induced, aPC-induced, and concordant (Insulin+aPC) gene ontology categories (Figure 5D; supplemental Figure 8). Importantly, both insulin and aPC regulate XBP1 enrichment in several pathways associated with protein biosynthesis, trafficking, degradation, organelle biogenesis, amino acid metabolism, and ER function (Figure 5D; supplemental Figure 8).
Insulin and aPC-dependent XBP1 regulatory networks linked to UPR regulation. (A) Schematic illustration of methodology employed to identify homeostatic condition-specific XBP1 targets. (B-C) Venn diagram (B) and heat map (C) showing common genes that were significantly enriched after treatment with insulin or aPC vs untreated (UT). (D) Heat map showing condition-specific enriched pathways highly relevant for regulation of proteostasis. (E) Candidate ERSE-like and UPRE-like regulatory motifs that are overrepresented in UPR target promoters. Venn diagrams show respective condition-specific proportions. (F-H) Heat map summarizes enrichment of condition-specific concordant UPR genes (F), their impact on regulation of UPR-gene expression (G; n = 3; mean ± SEM, untreated vs insulin or aPC treated), and the impact of concomitant insulin and aPC treatment on UPR gene expression (H; n = 3; mean ± SEM, untreated vs insulin, aPC, or insulin, and aPC treated). TBP, TATA box-binding protein.
Insulin and aPC-dependent XBP1 regulatory networks linked to UPR regulation. (A) Schematic illustration of methodology employed to identify homeostatic condition-specific XBP1 targets. (B-C) Venn diagram (B) and heat map (C) showing common genes that were significantly enriched after treatment with insulin or aPC vs untreated (UT). (D) Heat map showing condition-specific enriched pathways highly relevant for regulation of proteostasis. (E) Candidate ERSE-like and UPRE-like regulatory motifs that are overrepresented in UPR target promoters. Venn diagrams show respective condition-specific proportions. (F-H) Heat map summarizes enrichment of condition-specific concordant UPR genes (F), their impact on regulation of UPR-gene expression (G; n = 3; mean ± SEM, untreated vs insulin or aPC treated), and the impact of concomitant insulin and aPC treatment on UPR gene expression (H; n = 3; mean ± SEM, untreated vs insulin, aPC, or insulin, and aPC treated). TBP, TATA box-binding protein.
Nuclear sXBP1 alone or in conjunction with ATF6 typically targets gene promoters containing ER-stress response elements, termed ER-stress element (ERSE) I and II and unfolded protein response element (UPRE). Both ERSE-like and UPRE-like motifs regulate UPR-target promoters.27 Genome-wide interrogation of ERSE-like and UPRE-like motifs revealed that both insulin and aPC deploy ERSE- and UPRE-like motifs (Figure 5E). Importantly, filtering of concordant UPR genes revealed that both aPC and insulin typically enriched XBP1 at the proximal promoters of chaperones involved in protein binding and folding (Canx, Cct7, Edem1, Rpn1, Dnajb9, Erp44, Hspa5) components of ER-associated protein degradation (ERAD: Herpud1, Htra2, Vcp, Rfn5), transcription factors (Creb3, Srebf2, and ATF4), and the apoptotic regulator “Bax,” which in addition to mitochondrial dysfunction also modulates UPR (Figure 5F-G).29 To specifically determine the impact of sXBP1 enrichment on UPR regulation, we performed UPR pathway–specific expression analyses. Both aPC and insulin suppressed most XBP1-enriched genes while inducing Srebf2, a gene regulating cholesterol metabolism. Concomitant treatment of resting podocytes with insulin and aPC resulted in an additive induction of gene expression of only a few genes (eg, Sec63, UFD1), whereas in most cases gene expression remained the same (eg, Dnajc3, Edem1, Eif2a; Figure 5H). The highly concordant expression pattern corroborates the conclusion that aPC and insulin induce gene expression largely through the same pathway. However, in contrast to insulin, aPC selectively induced components of ERAD (Htra2, Herpud1, Vcp), protein binding and folding (Rpn1, Canx, Cct7, Hspa2, Dnajb9, Erp44), and the transcription factor ATF4 (Figure 5G), emphasizing involvement of condition-specific (aPC vs insulin) regulatory mechanisms for ER proteostasis. These data demonstrate that aPC and insulin via nuclear translocation of sXBP1 target largely overlapping genes involved in the regulation of energy expenditure, metabolism, and ER function in podocytes.
Discussion
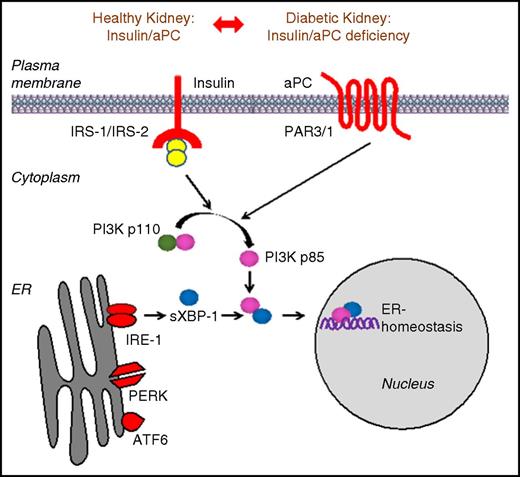
Collectively, our study establishes that the coagulation protease aPC rescues defective insulin signaling despite utilizing stimuli and receptors structurally disjunct from and hitherto not linked with INSR signaling (Figure 6). These results illustrate that targeting specific intracellular signaling hubs permits compensation for defective insulin signaling. Of note, failure of ER proteostasis is likewise linked with impaired insulin signaling in classic insulin responsive tissues, such as liver, adipose tissue, and skeletal muscle.10-13,30 We propose that impaired INSR response in these tissues may likewise be rescued by targeting specific intracellular signaling hubs.31
Signaling redundancy enables aPC to rescue defective insulin signaling. Scheme illustrating the compensatory mechanism through which coagulation protease aPC rescues defective insulin signaling in mouse models of DKD. The regulatory subunits of PI3Kinase p85α and p85β and sXBP1 protein complexes act as platforms that integrate signals downstream of INSR and GPCR-PAR-3. Treatment with aPC efficiently rescues insulin-signaling defect by activating p85-dependent sXBP1 nuclear translocation and restores adaptive UPR in podocytes, thereby protecting against DKD.
Signaling redundancy enables aPC to rescue defective insulin signaling. Scheme illustrating the compensatory mechanism through which coagulation protease aPC rescues defective insulin signaling in mouse models of DKD. The regulatory subunits of PI3Kinase p85α and p85β and sXBP1 protein complexes act as platforms that integrate signals downstream of INSR and GPCR-PAR-3. Treatment with aPC efficiently rescues insulin-signaling defect by activating p85-dependent sXBP1 nuclear translocation and restores adaptive UPR in podocytes, thereby protecting against DKD.
Although hormonelike functions of coagulation proteases have been proposed in the past, direct evidence has been lacking.16 Intriguingly, coagulation protease–dependent signaling via tissue factor and PAR2 modulates diet-induced obesity, lending further support for hormonelike activities of coagulation proteases.32 However, the current report is the first to demonstrate that coagulation protease–dependent signaling directly interferes with and rescues defective hormone signaling. These observations raise the possibility that therapeutic modulation of coagulation may convey yet unknown metabolic side effects.
An impact of aPC on ER markers and on mitochondria, which are closely linked with ER function, has been previously shown.33-36 However, the physiological and pathophysiological relevance and the mechanism of aPC-dependent regulation of ER homeostasis remained unknown. Here, we demonstrate (1) (patho-)physiological relevance of and (2) a mechanism through which aPC maintains ER homeostasis. Considering the homeostatic and cytoprotective properties of ER signaling, the current insights are expected to have broader implications for protease-dependent cellular homeostasis and metabolism.
Although demonstrating signaling redundancy and rescue of impaired insulin signaling, we also observed differences between aPC- and insulin-dependent XBP1 binding to promoter regions and gene regulation. Intriguingly, several UPR-related genes were suppressed despite XBP1 binding to their promoter under resting conditions, which is suggestive of cytoprotection via ER preconditioning.37 Further studies are needed to evaluate aPC- and insulin-specific coregulators and the involved adapter proteins that integrate aPC- and insulin-specific stimuli at the PI3K-p85-XBP1 signaling hub and the functional relevance of differential XBP1-dependent gene regulation by insulin and aPC in physiological and pathophysiological situations.
Taken together, the current results may not only spur translational studies using small molecules targeting receptors currently not linked with INSR signaling or directly interfering with integrating signaling hubs to overcome insulin resistance but also support the notion that coagulation proteases convey “metabolic” effects.
The online version of this article contains a data supplement.
The publication costs of this article were defrayed in part by page charge payment. Therefore, and solely to indicate this fact, this article is hereby marked “advertisement” in accordance with 18 USC section 1734.
Acknowledgments
The authors thank Laurie Glimcher (Weill Cornell Medical College, New York) for providing XBP1flox mice, and Kathrin Deneser, Julia Judin, Juliane Friedrich, René Rudat, and Rumiya Makarova for excellent technical support.
This work was supported by grants from the Deutsche Forschungsgemeinschaft (IS 67/5-2, IS-67/8-1, IS 67/11-1, and SFB 845 B26N) (B.I.) and SFB 854 Z01 (A.J.M.), TH 1789/1-1 (T.M.), WA 3663/2-1 (H.W.), CH279/5-1 (T.C.), and SFB 1118 (P.P.N.), the “Stiftung Pathobiochemie und Molekulare Diagnostik” (B.I. and T.M.), the European Research Council (DEMETINL) (T.C.), Federal Ministry of Education and Research (BMBF 01EO1503), Alexander von Humboldt Foundation (W.R.), and DAAD scholarships (M.M.A.-D. and A.E.).
Authorship
Contribution: T.M. together with H.W. and S.G. designed and conducted in vitro work, mouse experiments, ex vivo analysis; W.D., V.K., M.M.A.-D., J.M., S.N., A.E., F.B., S.K., I.S., A.M., A.J.M., and K.S. assisted in animal experiments and ex vivo analysis; C.T.E., P.P.N., J.R., and T.C. provided reagents and critically reviewed the manuscript; W.R. provided reagents, conceptual advice, and critically reviewed the manuscript; and T.M. and B.I. conceptually designed the study and prepared the manuscript.
Conflict-of-interest disclosure: The authors declare no competing financial interests.
Correspondence: Thati Madhusudhan, Institute of Clinical Chemistry and Pathobiochemistry, Otto-von-Guericke-University Magdeburg, Leipziger Strasse 44, D-39120 Magdeburg, Germany; e-mail: m.thati@uni-mainz.de; and Berend Isermann, Institute of Clinical Chemistry and Pathobiochemistry, Otto-von-Guericke-University Magdeburg, Leipziger Strasse 44, D-39120 Magdeburg, Germany; e-mail: berend.isermann@med.ovgu.de.
References
Author notes
T.M., H.W., and S.G. contributed equally to this study.

This feature is available to Subscribers Only
Sign In or Create an Account Close Modal