Key Points
Mutant CALR induces TPO-independent growth in the human megakaryocytic cell line UT-7/TPO.
Mutant CALR binds to the TPO receptor, inducing phosphorylation of JAK2 and activating downstream signaling.
Abstract
Recurrent somatic mutations of calreticulin (CALR) have been identified in patients harboring myeloproliferative neoplasms; however, their role in tumorigenesis remains elusive. Here, we found that the expression of mutant but not wild-type CALR induces the thrombopoietin (TPO)-independent growth of UT-7/TPO cells. We demonstrated that c-MPL, the TPO receptor, is required for this cytokine-independent growth of UT-7/TPO cells. Mutant CALR preferentially associates with c-MPL that is bound to Janus kinase 2 (JAK2) over the wild-type protein. Furthermore, we demonstrated that the mutant-specific carboxyl terminus portion of CALR interferes with the P-domain of CALR to allow the N-domain to interact with c-MPL, providing an explanation for the gain-of-function property of mutant CALR. We showed that mutant CALR induces the phosphorylation of JAK2 and its downstream signaling molecules in UT-7/TPO cells and that this induction was blocked by JAK2 inhibitor treatment. Finally, we demonstrated that c-MPL is required for TPO-independent megakaryopoiesis in induced pluripotent stem cell–derived hematopoietic stem cells harboring the CALR mutation. These findings imply that mutant CALR activates the JAK2 downstream pathway via its association with c-MPL. Considering these results, we propose that mutant CALR promotes myeloproliferative neoplasm development by activating c-MPL and its downstream pathway.
Introduction
Recurrent somatic mutations of the calreticulin (CALR) gene were previously reported in a subset of patients with essential thrombocythemia (ET) and primary myelofibrosis (PMF), a subcategory of Philadelphia chromosome-negative myeloproliferative neoplasms (MPNs); however, the mechanism by which CALR mutations promote tumorigenesis remains poorly understood.1,2 CALR mutations exclusively comprise frameshift mutations in exon 9, which result in the generation of a novel amino acid sequence at the carboxyl terminus (C terminus) of CALR mutant proteins in patients with MPNs.1-4 Because the frameshift mutations were limited to 1 of 2 alternative reading frames, CALR mutations in MPN are likely gain-of-function mutations. Furthermore, CALR mutations are not concurrently found with other driver mutations such as Janus kinase 2 V617F (JAK2V617F) and MPLW515K/L in ET and PMF patients.1-8 Because mutant JAK2 and thrombopoietin (TPO) receptor (c-MPL) proteins exhibit gain-of-function properties in patients with MPNs, mutant CALR is thought to be involved in activating the c-MPL and JAK2 pathways. Accordingly, the expression of mutant CALR activates the JAK2 signaling pathway, freeing Ba/F3 cells from interleukin-3 dependency.1 However, CALR was previously thought to function as a chaperone in the endoplasmic reticulum (ER), and its relation to the c-MPL and JAK2 pathway remains poorly understood.9
In this work, we used UT-7/TPO cells and induced pluripotent stem cell (iPS)-derived hematopoietic cells to study the mechanism(s) by which mutant calreticulin promotes development of MPNs.
Methods
Cell culture and proliferation assay
UT-7/TPO, UT-7/EPO, and HEK293T cells were cultured, as described previously.10-12 UT-7/TPO–derived cell lines expressing mutant CALR were cultured in the absence of TPO. For cell proliferation assay (Figure 1C-D), 1 × 10⁴ cells were cultured in a 96-well plate with 100 µL of medium and evaluated with Cell Count Reagent SF (Nacalai Tesque) following the manufacturer’s protocol. Cell viability (Figure 2D) was determined by Trypan blue dye exclusion assay using the TC10 Cell Counter (Bio-Rad). For the coculture experiment, UT-7/TPO cells were labeled with CellTrace Violet (Thermo Fisher) according to the manufacturer’s protocol, cultured with the same number of UT-7/TPO/CALR Ins5 cells for 3 days in the absence of TPO, and labeled cells were counted with counting beads (Thermo Fisher) using the EC800 analyzer (SONY).
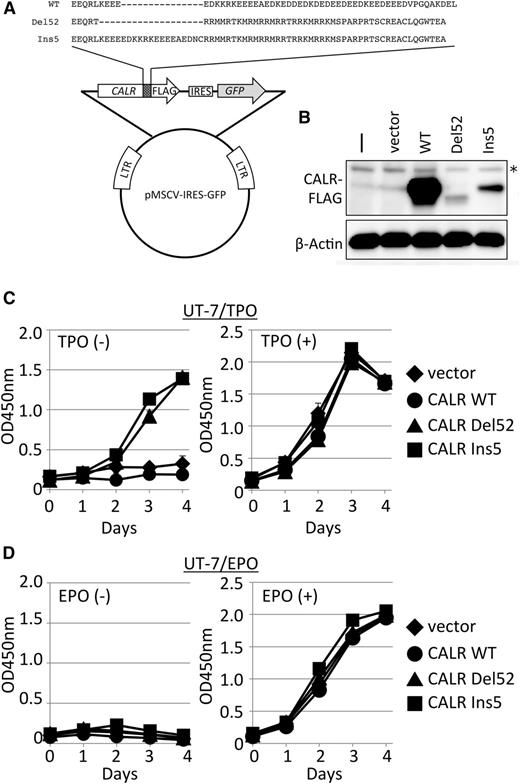
Cytokine-independent cell growth induced by mutant CALR. (A) Retroviral vector constructs for the introduction and expression of CALR genes. These constructs produce C terminus FLAG-tagged WT CALR, mutant CALR type 1 (Del52), or mutant CALR type 2 (Ins5).1 Mutant proteins share distinctive amino acid sequences generated by frameshift mutations at the C terminus end of the protein. IRES, internal ribosomal entry site; LTR, long terminal repeat. (B) Immunoblot analysis of extracts (20 µg) prepared from UT-7/TPO cells (-), UT-7/TPO cells infected with mock vector (vect), or UT-7/TPO cells infected with viruses expressing the indicated CALR proteins. β-Actin was used as a loading control. *Indicates nonspecific bands detected in uninfected cell extracts. Cell proliferation assay in the absence or presence of TPO (C) or EPO (D) for UT-7/TPO (C) or UT-7/EPO (D) cells expressing vect (diamond), CALR WT (circle), CALR Del52 (triangle), and CALR Ins5 (square). Absorbance was measured at 450 nm to detect formazan dye produced by viable cells, and the mean value ± standard deviation (SD) from 3 replicates is depicted.
Cytokine-independent cell growth induced by mutant CALR. (A) Retroviral vector constructs for the introduction and expression of CALR genes. These constructs produce C terminus FLAG-tagged WT CALR, mutant CALR type 1 (Del52), or mutant CALR type 2 (Ins5).1 Mutant proteins share distinctive amino acid sequences generated by frameshift mutations at the C terminus end of the protein. IRES, internal ribosomal entry site; LTR, long terminal repeat. (B) Immunoblot analysis of extracts (20 µg) prepared from UT-7/TPO cells (-), UT-7/TPO cells infected with mock vector (vect), or UT-7/TPO cells infected with viruses expressing the indicated CALR proteins. β-Actin was used as a loading control. *Indicates nonspecific bands detected in uninfected cell extracts. Cell proliferation assay in the absence or presence of TPO (C) or EPO (D) for UT-7/TPO (C) or UT-7/EPO (D) cells expressing vect (diamond), CALR WT (circle), CALR Del52 (triangle), and CALR Ins5 (square). Absorbance was measured at 450 nm to detect formazan dye produced by viable cells, and the mean value ± standard deviation (SD) from 3 replicates is depicted.
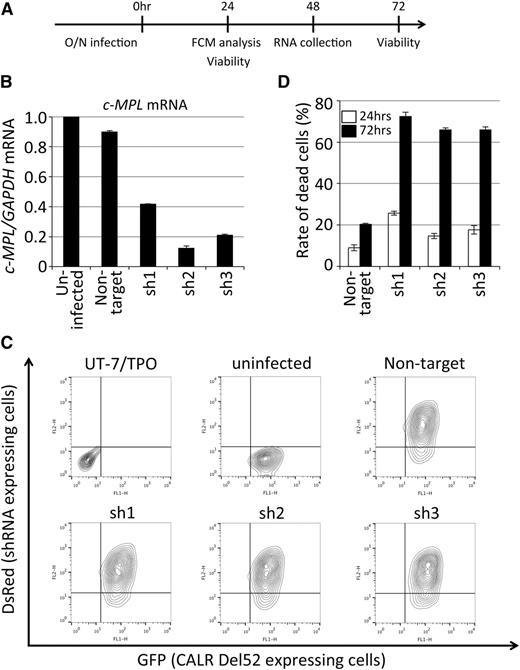
c-MPL is required for the cytokine-independent growth of UT-7/TPO CALR Del52-expressing cells. (A) A schematic representation of the c-MPL knockdown experiment for UT-7/TPO cells expressing CALR Del52. RNA was collected from a separate experiment for fluorescence-activated cell sorting analysis and viability determination. (B) Validation of c-MPL knockdown by quantitative reverse-transcription-PCR. UT-7/TPO CALR Del52-expressing cells (uninfected) and other cells infected with lentivirus expressing the indicated shRNA were analyzed. The relative expression of c-MPL normalized to GAPDH expression in total RNA purified from infected and sorted cells was determined by quantitative reverse-transcription-PCR. The mean value ± SD from 3 replicates are depicted. (C) Determination of infection efficiency by fluorescence-activated cell sorting for the detection of the surrogate marker DsRed. The original UT-7/TPO cells, UT-7/TPO CALR Del52-expressing cells (uninfected), and other cells infected with lentivirus expressing the indicated shRNA were analyzed. CALR Del52-expressing cells were marked by GFP (Figure 1); lentivirus-infected cells were marked by DsRed. (D) The viability of shRNA-expressing cells 24 (open bar) and 72 (solid bar) hours after infection was determined by dye exclusion assay; the percentages of dead cells ± SD from 3 replicates are depicted. FCM, flow cytometry; O/N, overnight.
c-MPL is required for the cytokine-independent growth of UT-7/TPO CALR Del52-expressing cells. (A) A schematic representation of the c-MPL knockdown experiment for UT-7/TPO cells expressing CALR Del52. RNA was collected from a separate experiment for fluorescence-activated cell sorting analysis and viability determination. (B) Validation of c-MPL knockdown by quantitative reverse-transcription-PCR. UT-7/TPO CALR Del52-expressing cells (uninfected) and other cells infected with lentivirus expressing the indicated shRNA were analyzed. The relative expression of c-MPL normalized to GAPDH expression in total RNA purified from infected and sorted cells was determined by quantitative reverse-transcription-PCR. The mean value ± SD from 3 replicates are depicted. (C) Determination of infection efficiency by fluorescence-activated cell sorting for the detection of the surrogate marker DsRed. The original UT-7/TPO cells, UT-7/TPO CALR Del52-expressing cells (uninfected), and other cells infected with lentivirus expressing the indicated shRNA were analyzed. CALR Del52-expressing cells were marked by GFP (Figure 1); lentivirus-infected cells were marked by DsRed. (D) The viability of shRNA-expressing cells 24 (open bar) and 72 (solid bar) hours after infection was determined by dye exclusion assay; the percentages of dead cells ± SD from 3 replicates are depicted. FCM, flow cytometry; O/N, overnight.
Plasmids
Complementary DNAs (cDNAs) encoding wild-type (WT), Del52, and Ins5 CALR with a carboxyl-terminal (C-terminal) FLAG-tags were polymerase chain reaction (PCR)-amplified and subcloned into the EcoRI site of the pMSCV-IRES-green fluorescence protein (GFP) vector (Addgene #20672) and the HindIII and EcoRI sites of the pcDNA3.1 vector (Life Technologies). To express short hairpin RNA (shRNA), we constructed the pLKO.3R vector by replacing the cDNA for GFP in pLKO.3G (Addgene #14748) with DsRed-express cDNA (Clontech). The following oligonucleotides containing shRNA sequences obtained from the RNAi consortium database (Broad Institute) were subcloned into the AgeI and EcoRI sites of pLKO.3R: Nontargeting sh: 5′-CCGGCAACAAGATGAAGAGCACCAACTCGAGTTGGTGCTCTTCATCTTGTTGTTTTTG-3′; c-MPLsh1: 5′-CCGGTCCTGCCTCTTTGAGTATATTCTCGAGAATATACTCAAAGAGGCAGGATTTTTG-3′; c-MPLsh2: 5′-CCGGGCCCAAGAGACCTGTTATCAACTCGAGTTGATAACAGGTCTCTTGGGCTTTTTG-3′; c-MPLsh3: 5′-CCGGCCTACCTACCACTAAGCTATTCTCGAGAATAGCTTAGTGGTAGGTAGGTTTTTG-3′; c-MPLsh4: 5′-CCGGCCTCTGGGTGAAGAATGTGTTCTCGAGAACACATTCTTCACCCAGAGGTTTTTG-3′. C-terminal HA- or V5-tagged c-MPL was PCR-amplified and subcloned into the EcoRI and XhoI sites of the pcDNA3.1 vector. A series of plasmids for the expression of truncated mutant of CALR Ins5 was constructed via PCR-based mutagenesis and subsequent cloning into pcDNA3.1. All plasmids constructed for this study were verified by sequencing before use.
Virus production and infection
Retrovirus vectors and MD2G were cotransfected into Platinum-GP packaging cells (Cell Biolabs). Lentiviruses were produced as previously described.12 The virus-containing medium was collected 48 and 72 hours after the cells were transfected, and pooled media were then centrifuged at 30 000g for 3 hours at 4°C. The pellet was suspended with media to obtain concentrated virus. To establish cell lines expressing various CALR constructs, cells were infected once with concentrated retroviruses at an infection efficiency of ∼30% in the presence of polybrene, and the GFP-positive infected cells were sorted using the FACSAria II (BD Biosciences). For the c-MPL knockdown experiments, cells were infected with concentrated lentiviruses in the presence of polybrene; the infection was confirmed by detecting the red fluorescent signal using the FACSCalibur (BD Biosciences).
Co-IP assay
Cells were washed with phosphate-buffered saline (PBS) containing 2 mM orthovanadate and then sonicated in coimmunoprecipitation (co-IP) buffer (PBS containing 0.1% Triton X-100, 5 mM EDTA, 2 mM orthovanadate, 10 mM β-glycerophosphate) supplemented with a protease inhibitor cocktail (1 µg/mL aprotinin, 2 µg/mL E-64, 1 µg/mL leupeptin, 0.67 µg/mL bestatin, 0.67 µg/mL pepstatin, and 43.5 µg/mL PMSF). Protein concentration was determined using a BCA protein assay kit (Thermo Fisher). For the co-IP assay, cell extracts were incubated with 1.0 µg of anti-FLAG (WAKO #018-22381) or anti-V5 (Life Technologies #46-0705) on ice for 1 hour, and subsequently mixed with Dynabeads Protein G (Life Technologies) for 30 minutes at 4°C. The beads were then washed twice with co-IP buffer. Finally, bound proteins were extracted by boiling in sodium dodecyl sulfate-polyacrylamide gel electrophoresis sample buffer and subsequently electrophoresed and blotted onto polyvinylidene fluoride membranes (Millipore) for immunoblot analysis. To adjust for the differential accumulation of endogenous c-MPL protein in UT-7/TPO-derived cells, 2.7 mg of extract was used for vector- and WT-expressing cells, whereas 2.0 mg of extract was used for Del52- and Ins5-expressing cells in the co-IP reaction. To prepare extracts for co-IP experiments with HEK293T cells, cells were cotransfected with the indicated vectors using Lipofectamine 2000 (Invitrogen) and cultured for 48 hours before harvest. One hundred micrograms of extract prepared from HEK293T cells was subjected to the co-IP assay. To adjust the expression levels of CALR protein in transfected HEK293T cells, CALR Ins5- and Del52-expressing cells were transfected with 4 and 8 times more plasmid, respectively, than CALR WT-expressing cells (Figure 3B-C). For the co-IP experiments in Figure 4, equal amounts of each construct were used. For the co-IP experiment in Figure 5A, the amount of CALR Ins5 plasmids were half of the amounts of CALR Del52 and other plasmids to lower the level of CALR Ins5 against unstable CALR Del52.
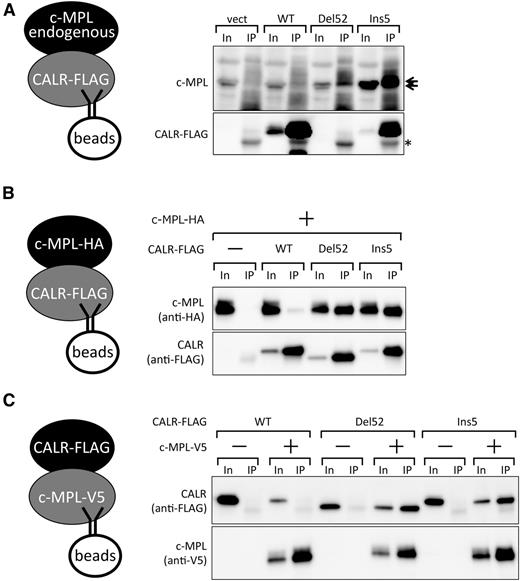
Preferential binding of c-MPL and mutant CALR proteins. (A) Co-IP assay for the detection of endogenous c-MPL and retrovirally expressed FLAG-CALR proteins in UT-7/TPO cells. Note that the FLAG-tagged CALR Del52 band overlaps with the heavy chain from IgG (*) used for immunoprecipitation. The overlapping bands for Del52 and IgG were not significantly more intense than that of IgG alone because of a lower accumulation of Del52, as shown in Figure 1B. Note that c-MPL accumulated at a higher level in CALR Del52- or Ins5-expressing cells compared with CALR WT- or vector control-expressing cells partly, if not all, owing to an increased mRNA level (data not shown). Ten percent input (In) and the IP fraction were run as a pair in panels A-C. c-MPL appears as a doublet in the blot. (B-C) Co-IP assay for the detection of coexpressed c-MPL and CALR proteins in HEK93T cells. FLAG-tagged CALR (B) or V5-tagged c-MPL (C) was used as bait.
Preferential binding of c-MPL and mutant CALR proteins. (A) Co-IP assay for the detection of endogenous c-MPL and retrovirally expressed FLAG-CALR proteins in UT-7/TPO cells. Note that the FLAG-tagged CALR Del52 band overlaps with the heavy chain from IgG (*) used for immunoprecipitation. The overlapping bands for Del52 and IgG were not significantly more intense than that of IgG alone because of a lower accumulation of Del52, as shown in Figure 1B. Note that c-MPL accumulated at a higher level in CALR Del52- or Ins5-expressing cells compared with CALR WT- or vector control-expressing cells partly, if not all, owing to an increased mRNA level (data not shown). Ten percent input (In) and the IP fraction were run as a pair in panels A-C. c-MPL appears as a doublet in the blot. (B-C) Co-IP assay for the detection of coexpressed c-MPL and CALR proteins in HEK93T cells. FLAG-tagged CALR (B) or V5-tagged c-MPL (C) was used as bait.
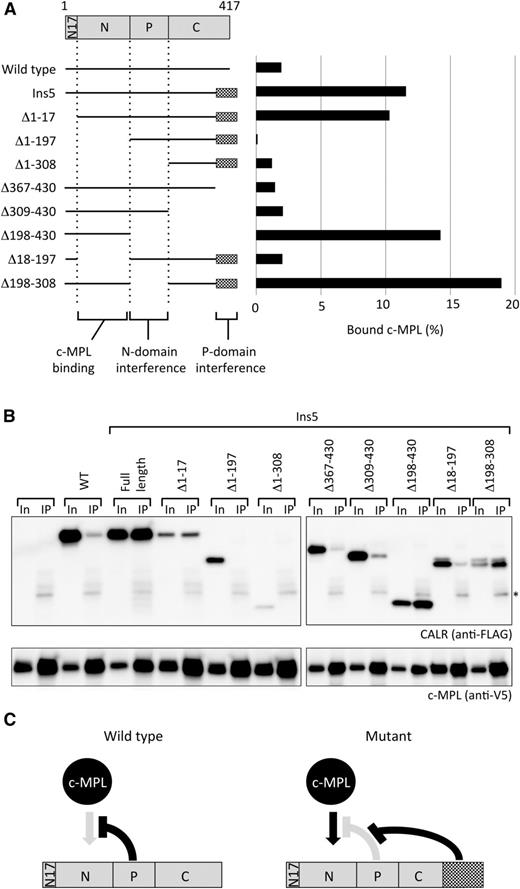
The mutant-specific C terminus extension supports the N-domain of CALR for c-MPL binding. (A) A schematic representation of truncated proteins examined in the assay and quantified results obtained from panel B. (B) Co-IP assay for a series of truncated mutant of FLAG-tagged CALR Ins5 (scheme shown in A) and V5-tagged c-MPL (bait) cotransfected into HEK293T cells. Ten percent In and the IP fraction were run as a pair. *Indicates the band from IgG used for immunoprecipitation. Representative data from multiple experiments are presented. Co-IP assays in these 2 panels were performed simultaneously and the data were obtained concurrently. (C) A hypothetical model for CALR Ins5-specific binding to c-MPL. The mutant-specific C terminus extension blocks the P-domain interference and allows the N-domain to bind to c-MPL.
The mutant-specific C terminus extension supports the N-domain of CALR for c-MPL binding. (A) A schematic representation of truncated proteins examined in the assay and quantified results obtained from panel B. (B) Co-IP assay for a series of truncated mutant of FLAG-tagged CALR Ins5 (scheme shown in A) and V5-tagged c-MPL (bait) cotransfected into HEK293T cells. Ten percent In and the IP fraction were run as a pair. *Indicates the band from IgG used for immunoprecipitation. Representative data from multiple experiments are presented. Co-IP assays in these 2 panels were performed simultaneously and the data were obtained concurrently. (C) A hypothetical model for CALR Ins5-specific binding to c-MPL. The mutant-specific C terminus extension blocks the P-domain interference and allows the N-domain to bind to c-MPL.
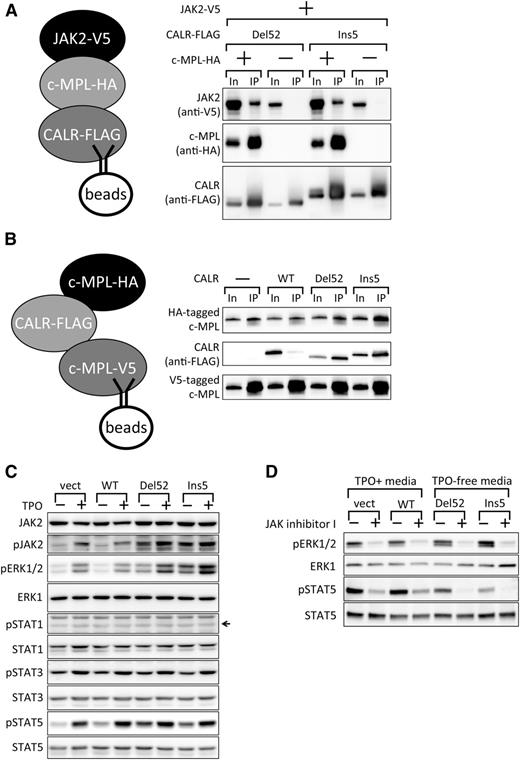
Cytokine-independent activation of STAT5 and ERK1/2 by JAK2 in UT-7/TPO CALR Del52- and Ins5-expressing cells. (A) Co-IP assay demonstrating JAK2 recruitment by c-MPL to mutant CALR. FLAG-tagged CALR Del52 or Ins5 were used as bait, and the coprecipitation of V5-tagged JAK2 in the presence or absence of c-MPL was examined. Ten percent In and the IP fraction were run as a pair. Note that the increased levels of proteins in the input when all 3 components were expressed are due to the activation of the CMV promoter in the expression vectors by the activated JAK2 pathway (Y.E., M.A., Y.H., Y.Y., S.M., Y.S., A.O., and N.K., manuscript in preparation). (B) Co-IP assay examining enhancement of c-MPL dimerization by mutant CALR proteins. V5-tagged c-MPL proteins were used as bait, and the coprecipitation of HA-tagged c-MPL was examined in the presence of CALR WT, Del52, or Ins5. (C) Immunoblot analysis of extracts (20 µg) prepared from UT-7/TPO cells infected with mock vector (vect) or UT-7/TPO cells infected with viruses expressing the indicated CALR proteins, which were cultured in the absence or presence of TPO. An arrow indicates the position of the band of the target protein based on the positive control (not shown). (D) Immunoblot analysis of extracts (20 µg) prepared from cells analyzed in (C) treated with DMSO (−) or 3 µM JAK Inhibitor I (+) for 17 hours.
Cytokine-independent activation of STAT5 and ERK1/2 by JAK2 in UT-7/TPO CALR Del52- and Ins5-expressing cells. (A) Co-IP assay demonstrating JAK2 recruitment by c-MPL to mutant CALR. FLAG-tagged CALR Del52 or Ins5 were used as bait, and the coprecipitation of V5-tagged JAK2 in the presence or absence of c-MPL was examined. Ten percent In and the IP fraction were run as a pair. Note that the increased levels of proteins in the input when all 3 components were expressed are due to the activation of the CMV promoter in the expression vectors by the activated JAK2 pathway (Y.E., M.A., Y.H., Y.Y., S.M., Y.S., A.O., and N.K., manuscript in preparation). (B) Co-IP assay examining enhancement of c-MPL dimerization by mutant CALR proteins. V5-tagged c-MPL proteins were used as bait, and the coprecipitation of HA-tagged c-MPL was examined in the presence of CALR WT, Del52, or Ins5. (C) Immunoblot analysis of extracts (20 µg) prepared from UT-7/TPO cells infected with mock vector (vect) or UT-7/TPO cells infected with viruses expressing the indicated CALR proteins, which were cultured in the absence or presence of TPO. An arrow indicates the position of the band of the target protein based on the positive control (not shown). (D) Immunoblot analysis of extracts (20 µg) prepared from cells analyzed in (C) treated with DMSO (−) or 3 µM JAK Inhibitor I (+) for 17 hours.
Immunoblot analysis
To prepare extracts, cells were washed with PBS containing 2 mM orthovanadate and then sonicated in RIPA buffer (20 mM Tris-HCl [pH 7.5], 150 mM NaCl, 1 mM EDTA, 1% NP-40, 1% sodium deoxycholate) containing 2 mM orthovanadate and a protease inhibitor cocktail. To inhibit JAK2, cells were treated with 3 µM JAK Inhibitor I (Calbiochem) for 17 hours before the preparation of cell extracts. Equal amounts of protein were denatured, electrophoresed, and blotted to polyvinylidene fluoride membranes. The following primary antibodies were used for immunoblot detection: anti-FLAG (Sigma-Aldrich #7425), anti-HA (Santa Cruz #sc-805), anti-c-MPL (IBL #18505), HRP-conjugated anti-V5 (Invitrogen #46-070; Figure 3C), anti-V5 (Invitrogen #46-0705), anti-extracellular signal-regulated kinase (ERK1; BD Biosciences #610030), and the following antibodies from Cell Signaling: anti-β-Actin (#4967), anti-phospho-ERK1/2 (#9101), anti-STAT1 (#9172), anti-phospho-STAT1 (#7649), anti-STAT3 (#4904), anti-phospho-STAT3 (#9134), anti-STAT5 (#9363), anti-phospho-STAT5 (#9359), anti-JAK2 (#3230), and anti-phospho-JAK2 (#3771). The following horseradish peroxidase–conjugated secondary antibodies (Santa Cruz) were used: goat anti-mouse immunoglobulin G (IgG; #sc-2005) or anti-rabbit IgG (#sc-2004). TrueBlot secondary antibodies (Rocklan) against mouse (#18-8817-31) and rabbit (#18-8816-31) were used in Figures 3C, 4B, and 5A-B. The chemiluminescence reaction was performed using ECL Western Blotting Femto (Thermo Fisher), and images were captured using an LAS-3000 or LAS-4000 instrument (Fuji). The data were quantified using ImageJ software.13
Real-time quantitative PCR
To measure the level of c-MPL messenger RNA (mRNA) (Figure 2), shRNA-expressing cells marked by DsRed-express were sorted and collected by MoFlo (Beckman). Total RNA preparation, cDNA synthesis, and quantitative PCR were performed as previously described,12 using the following primers for c-MPL quantitative PCR: 5′-CTGAAGTGTTTCTCCCGAACAT-3′ and 5′-GCGGGTAGGCATACAGCAG-3′.
Surface protein isolation and subcellular fractionation
Cell surface protein isolation and subcellular fractionation were performed by the Cell Surface Protein Isolation Kit (Thermo Fisher) and the Qproteome Cell Compartment Kit (Qiagen), respectively, according to the manufacturers’ protocols.
iPS cell establishment and megakaryocyte induction
iPS cells were established from an ET patient harboring the CALR Ins5 mutation by a standard method (H.T., S.M., M.A., N.M., Y.H., Y.M., Y.E., Y.S., Hiroshi Endo, Sou Nakamura, Koji Eto, A.O., and N.K., manuscript in preparation).14 The CALR mutation in the iPS cells was verified after establishment. After generating hematopoietic stem cells from iPS cells, megakaryopoiesis was induced and monitored by anti-CD42b-APC (BD Bioscience), as described previously.15 This study was conducted in accordance with the Declaration of Helsinki and was approved by the ethics committee at Juntendo University School of Medicine (institutional review board #2015041). Written informed consent for the use of samples and clinical records was obtained from the patient before sample collection.
Results
CALR promotes cytokine-independent growth in UT-7/TPO cells
Because a genetic link between CALR and c-MPL was recognized in MPN development, we used the human cell line UT-7/TPO, which endogenously expresses functional c-MPL protein and responds to TPO.10 To test the ability of mutant CALR to promote cytokine-independent growth in UT-7/TPO cells, we used a retrovirus vector system to introduce an empty vector, FLAG-tagged mutant CALR type 1 (Del52), FLAG-tagged mutant CALR type 2 (Ins5) (Figure 1A),1 or FLAG-tagged CALR WT cDNA, thus generating UT-7/TPO vector-, UT-7/TPO CALR Del52-, UT-7/TPO CALR Ins5-, and UT-7/TPO CALR WT-expressing cells, respectively. The infected cells were then sorted by GFP, which was simultaneously expressed with CALR by the IRES system. As shown in Figure 1B, exogenous CALR expression was detected by immunoblot analysis with anti-FLAG antibody. Interestingly, accumulation of mutant CALR was strongly suppressed, presumably owing to protein degradation, as we detected similar levels of integrated FLAG-tagged CALR mRNA expression (data not shown) and comparable levels of GFP signals in conjunction with FLAG-tagged CALR in established cell lines (data not shown).
The dependence of the established cell lines on cytokines was then examined. As shown in Figure 1C, UT-7/TPO CALR Del52- or Ins5-expressing cells proliferate even in the absence of TPO, whereas UT-7/TPO vector- or WT-expressing cells stop proliferating, indicating that the expression of mutant CALR promotes cytokine-independent growth in human UT-7/TPO cells. Unlike UT-7/TPO, UT-7/EPO cells express erythropoietin (EPO) receptor (EPOR) but not c-MPL and thus require EPO for proliferation.11 These cells did not proliferate in the absence of EPO, even when CALR Del52 or Ins5 was expressed (Figure 1D). UT-7/EPO and UT-7/TPO cells were originally established from the same parental cell line, UT-716 ; however, their receptor expression levels and cytokine responses differ. Because c-MPL expression correlated with the induction of cytokine-independent growth by mutant CALR, we hypothesize that mutant CALR activates either c-MPL itself or molecules in the downstream pathway to induce the cytokine-independent growth of UT-7/TPO cells.
c-MPL is required for the cytokine-independent growth of UT-7/TPO cells induced by mutant CALR
To investigate the involvement of c-MPL in cytokine-independent growth of UT-7/TPO CALR Del52- and Ins5-expressing cells, we examined whether c-MPL is required for mutant CALR to function. Lentiviral vectors harboring nontargeting shRNA or 3 independent shRNA sequences against c-MPL were generated (see our “Methods” for further details). All 3 shRNAs that target c-MPL, but not the nontargeting shRNA, significantly knocked down c-MPL expression 48 hours after the infection of UT-7/TPO CALR Del52-expressing cells (Figure 2A-B). These viruses were then used to infect the UT-7/TPO CALR Del52-expressing cells at an infection rate exceeding 80% (Figure 2C); cell viability was monitored 24 and 72 hours after infection. As shown in Figure 2D, when c-MPL was knocked down, more than 60% of UT-7/TPO CALR Del52-expressing cells were killed 72 hours after infection, whereas the viability of cells infected with nontargeting shRNA was not significantly affected. This observation indicates that c-MPL is required for the cytokine-independent growth of UT-7/TPO cells induced by mutant CALR.
Mutant CALR preferentially binds to c-MPL
Because c-MPL and mutant CALR were found to cooperate in the induction of cytokine-independent growth in UT-7/TPO cells, we next examined whether c-MPL and mutant CALR proteins physically interact in UT-7/TPO cells. To this end, we performed a co-IP assay with extracts prepared from UT-7/TPO cells expressing vector, CALR WT, Del52, or Ins5 (Figure 1). When FLAG-tagged CALR proteins were immunoprecipitated using the FLAG antibody, c-MPL was preferentially recovered from CALR Del52- and Ins5-expressing cells but not from CALR WT-expressing cells (Figure 3A).
To further demonstrate the interaction between c-MPL and mutant CALR proteins, we performed a co-IP assay in HEK293T cells. Specifically, we cotransfected cells to express c-MPL and various CALR proteins (see our “Methods” for further details). Consistent with the results obtained in UT-7/TPO cells, FLAG-tagged CALR Del52 and Ins5, but not CALR WT, coprecipitated with HA-tagged c-MPL from HEK293T cell extracts (Figure 3B). In a reciprocal experiment with V5-tagged c-MPL as bait, FLAG-tagged CALR Del52 and Ins5, but not CALR WT, were recovered with c-MPL (Figure 3C). These results indicate that mutant CALR preferentially interacts with c-MPL and strongly suggest that mutant CALR activates c-MPL via direct interaction, which directly induces the cytokine-independent growth in UT-7/TPO cells.
The mutant-specific domain of CALR is required for c-MPL interaction
To further investigate the molecular mechanism by which mutant CALR preferentially binds to c-MPL, we created vectors that express a series of truncated forms of FLAG-tagged CALR Ins5 based on the structure of CALR (Figure 4A).17-19 These vectors were cotransfected into HEK293T cells expressing V5-tagged c-MPL, and the capacity of various forms of CALR Ins5 to bind to c-MPL was examined by co-IP assay. These experiments demonstrated that deleting the mutant-specific sequences encoded by amino acids 367 to 430 in CALR Ins5, which are commonly generated by various frameshift mutations in patients with MPNs harboring CALR mutations (see our “Introduction” for more details), abolished c-MPL binding (Δ367-430 and Δ309-430, Figure 4A-B). Because the CALR mutant-specific sequence is required for the c-MPL interaction, we first postulated that the interaction between c-MPL and CALR Ins5 is mediated by amino acids 309 to 430 of CALR Ins5. Contrary to this expectation, CALR Ins5 mutants harboring this C-terminal sequence, such as Δ1-197 and Δ1-308, were not able to bind to c-MPL (Figure 4A-B). Furthermore, although amino acids 309 to 430 of CALR Ins5 are required for c-MPL binding, CALR Δ198-430, which lacks the C-terminal mutant-specific domain, can strongly bind to c-MPL (Figure 4A-B). In addition, deletion of amino acids 18 to 197 results in a loss of c-MPL interaction. Because these findings contradicted our hypothesis and because CALR Δ198-430 robustly bound to c-MPL, we hypothesized that the N-domain of CALR, which has been reported to exhibit a chaperon function,17,18 is the bona fide c-MPL binding domain, although the function of the mutant-specific sequence remains unclear.
Examining other truncated CALR proteins, we found that the N-domain could bind to c-MPL in either the presence of the mutant-specific C terminus domain (Ins5 and Δ1-17, Figure 4A-B) or the absence of P-domain (Δ198-308 and Δ198-430, Figure 4A-B). Interestingly, when the P-domain is present and the mutant-specific C terminus domain is missing, all CALR mutants harboring the N-domain, such as WT, Δ367-430, and Δ309-430, failed to interact with c-MPL (Figure 4A-B). These findings imply that amino acids 309 to 430 are required for CALR Ins5 to interact with c-MPL via the N-domain. Our analysis strongly suggests that the unique C terminus extension of mutant CALR exhibits a gain-of-function property by interfering with the P-domain to allow the N-domain to interact with c-MPL (Figure 4C).
c-MPL–dependent JAK2 interaction with mutant CALR
Although we demonstrated that mutant CALR preferentially interacts with c-MPL, the mechanism by which it induces cytokine-independent growth remains unelucidated. Because patients with MPNs harboring CALR mutations respond to JAK inhibitor treatment,20 JAK2 activity is thought to be upregulated in cells harboring a CALR mutation.1 We first hypothesized that mutant CALR interacts with JAK2 as well as c-MPL, rearranges the positions of JAK2 molecules associated with a c-MPL dimer in the membrane,21 and finally activates JAK2. In contrast to our hypothesis, the co-IP assay of 3 components, V5-tagged JAK2, HA-tagged c-MPL, and FLAG-tagged CALR Ins5 or Del52, showed that mutant CALR only interacts with JAK2 in the presence of c-MPL (Figure 5A). Although mutant CALR may directly interact with JAK2 and c-MPL, our data suggest that it interacts with JAK2 via c-MPL.
Next, we asked whether mutant CALR promotes c-MPL dimerization, which should increase the chance of JAK2 activation. To this end, we performed a co-IP experiment with extracts prepared from HEK293T cells in which 2 differently tagged c-MPL proteins, HA-tagged and V5-tagged, were expressed in the presence of CALR WT, Del52, or Ins5. As shown in Figure 5B, we detected an interaction between 2 c-MPL proteins as reported previously,22 which was not significantly enhanced by mutant CALR.
c-MPL downstream activation by mutant CALR
Our findings imply that mutant CALR promotes c-MPL activation and subsequently induces the cytokine-independent growth of UT-7/TPO cells. To demonstrate that mutant CALR proteins activate c-MPL, we investigated the status of c-MPL downstream pathways in the UT-7/TPO CALR WT-, Del52-, Ins5-, and vector-expressing cells described in Figure 1. Extracts were prepared from these cells cultured in the absence or presence of TPO. Immunoblot analysis showed that cells expressing CALR Del52 or Ins5 presented elevated levels of JAK2, ERK1/2, and STAT5 phosphorylation, even in the absence of TPO, and that these expression levels were similar to those in the control cells (vector or CALR WT) cultured in the presence of TPO (Figure 5C). Interestingly, unlike the levels of JAK2 and ERK1/2 phosphorylation, the levels of STAT5 phosphorylation in UT-7/TPO CALR Del52- or Ins5-expressing cells were lower than those in vector control– or CALR WT-expressing cells cultured in the presence of TPO. This weaker activation of STAT5 by mutant CALR may explain the lower proliferation rates of UT-7/TPO CALR Del52- and Ins5-expressing cells in the absence of TPO compared with the proliferation of cells cultured in the presence of TPO (Figure 1C). We note that UT-7/TPO CALR Ins5-expressing cells expressed a higher level of phosphorylated ERK1/2 than did UT-7/TPO CALR Del52-expressing cells, presumably because these cells accumulated more CALR Ins5 than Del52 (Figure 1B). This finding may explain, at least in part, the poorer prognosis of patients with PMF harboring the CALR Ins5 mutation compared with patients with PMF harboring the CALR Del52 mutation.8 We observed robust phosphorylation of ERK1/2 and STAT5, which were previously reported as major downstream targets of c-MPL in megakaryocytic cells. This observation further supports our conclusion that mutant CALR activates c-MPL via JAK2 activation to induce cytokine-independent cell growth.
To demonstrate that the activation of c-MPL downstream pathways such as ERK1/2 and STAT5 by mutant CALR is mediated by the ectopic activation of JAK2, we examined the ability of JAK2 inhibitor treatment to block the phosphorylation of these molecules. When cells were incubated with 3 µM JAK2 inhibitor I for 17 hours, ERK1/2 and STAT5 phosphorylation was significantly suppressed in UT-7/TPO CALR Del52- and Ins5-expressing cells cultured in TPO-free media (Figure 5D), indicating that mutant CALR promotes cytokine-independent growth by activating the JAK2 pathway.
Cell surface localization of mutant CALR with no paracrine activation capacity
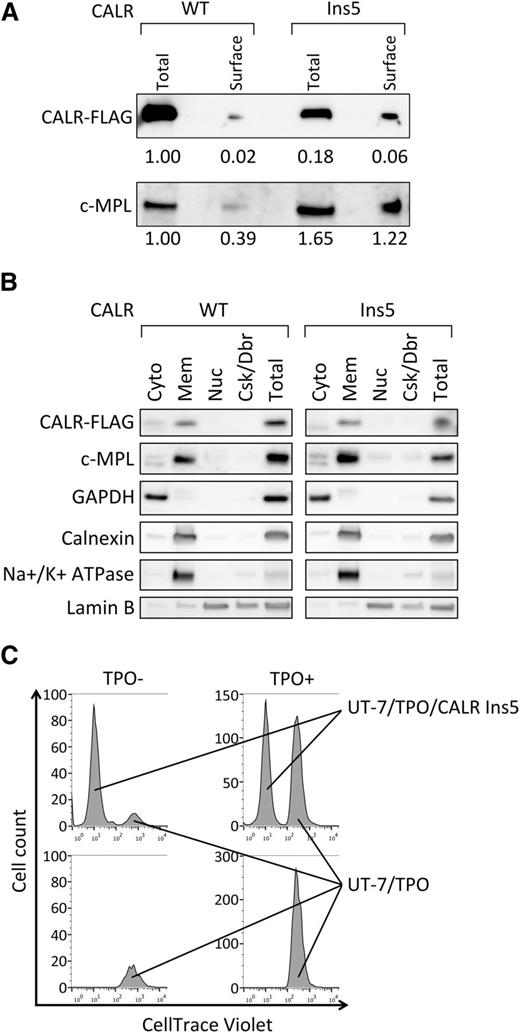
To further understand the molecular mechanism underlying constitutive activation of JAK2 by mutant CALR, we next determined where this activation occurs. Activation of JAK2 is achieved by the c-MPL interaction with TPO on the cell surface, and our preliminary data suggest that mutant CALR interacts with c-MPL extracellular domain (not shown); therefore, we first examined whether mutant CALR accumulates on the cell surface. By the surface protein isolation (see our “Methods” for further details), despite the lower accumulation of CALR Ins5 in total cell lysate (approximately 6-fold), we recovered 3-fold more CALR Ins5 than WT (Figure 6A). This indicates that CALR Ins5 exhibits a trend of cell surface localization compared with WT. Because we also observed the c-MPL accumulation on the surface of UT-7/TPO CALR Ins5 cells (Figure 6A), we speculated that mutant CALR binds to c-MPL on the cell surface. In concordance with this finding, we found, in a subcellular fractionation assay, that mutant CALR protein is accumulated in a fraction containing extra cellular membrane together with c-MPL (Figure 6B). However, we noted that the membrane fraction (“Mem” in Figure 6B) contained intracellular organelles (see ER marker Calnexin in Figure 6B), where mutant CALR and c-MPL binding may occur and lead to the JAK2 activation. Nevertheless, because of the preferential accumulation of mutant CALR, we hypothesize that the mutant CALR interacts with c-MPL on the cell surface and activates JAK2 via c-MPL.
Cell surface localization of mutant CALR with no paracrine activation for UT-7/TPO cell growth. (A) Cell surface proteins were biotinylated, purified, and analyzed by immunoblot for the detection of FLAG-tagged CALR WT and Ins5, and c-MPL. The relative intensity of each band is indicated. Total cell lysate corresponding to 10% of cells used for surface protein isolation were run as “total.” Note that the expression of CALR WT is significantly higher than Ins5, as shown in Figure 1B. Representative data from multiple experiments are presented. (B) Subcellular distribution of CALR WT, Ins5, and c-MPL were analyzed. cyto, cytosol; mem, membranes; nuc, nuclear; Csk/Dbr, cytoskeleton and debris; total, total cell lysate prepared from same number of cells used for fractionation. Note that for the detection of FLAG-tagged CALR WT, samples analyzed were diluted 8-fold because of elevated protein expression (Figure 1B). Markers for each fraction such as GAPDH (cytosol), Calnexin (ER), Na+/K+ ATPase (extracellular membrane), and Lamin B (nuclear) were analyzed. Representative data from multiple experiments are presented. (C) Cell count analysis for tracking dye labeled UT-7/TPO cells. UT-7/TPO cells were cultured with (upper) or without (lower) UT-7/TPO CALR Ins5 in the absence (left) or presence (right). Note that when starting the culture, 2 times more cells were cultured in UT-7/TPO alone (bottom) to equalize the starting cell number to cocultured cells (top).
Cell surface localization of mutant CALR with no paracrine activation for UT-7/TPO cell growth. (A) Cell surface proteins were biotinylated, purified, and analyzed by immunoblot for the detection of FLAG-tagged CALR WT and Ins5, and c-MPL. The relative intensity of each band is indicated. Total cell lysate corresponding to 10% of cells used for surface protein isolation were run as “total.” Note that the expression of CALR WT is significantly higher than Ins5, as shown in Figure 1B. Representative data from multiple experiments are presented. (B) Subcellular distribution of CALR WT, Ins5, and c-MPL were analyzed. cyto, cytosol; mem, membranes; nuc, nuclear; Csk/Dbr, cytoskeleton and debris; total, total cell lysate prepared from same number of cells used for fractionation. Note that for the detection of FLAG-tagged CALR WT, samples analyzed were diluted 8-fold because of elevated protein expression (Figure 1B). Markers for each fraction such as GAPDH (cytosol), Calnexin (ER), Na+/K+ ATPase (extracellular membrane), and Lamin B (nuclear) were analyzed. Representative data from multiple experiments are presented. (C) Cell count analysis for tracking dye labeled UT-7/TPO cells. UT-7/TPO cells were cultured with (upper) or without (lower) UT-7/TPO CALR Ins5 in the absence (left) or presence (right). Note that when starting the culture, 2 times more cells were cultured in UT-7/TPO alone (bottom) to equalize the starting cell number to cocultured cells (top).
Although WT CALR is known to localize to the ER, it can be secreted and play a nonchaperone function outside of cells.23,24 Thus, we next examined whether mutant CALR possesses the capacity to induce cytokine-independent growth in a paracrine fashion. We cocultured dye-labeled UT-7/TPO with UT-7/TPO CALR Ins5 cells and examined cell proliferation in the absence of TPO. As shown in Figure 6C, coculture did not promote cell proliferation in UT-7/TPO cells (left top and bottom panels in Figure 6C). We therefore conclude that mutant CALR activates internal JAK2 for promoting cytokine-independent growth in UT-7/TPO cells.
c-MPL is required for the TPO-independent megakaryopoiesis in CALR mutant hematopoietic stem cells
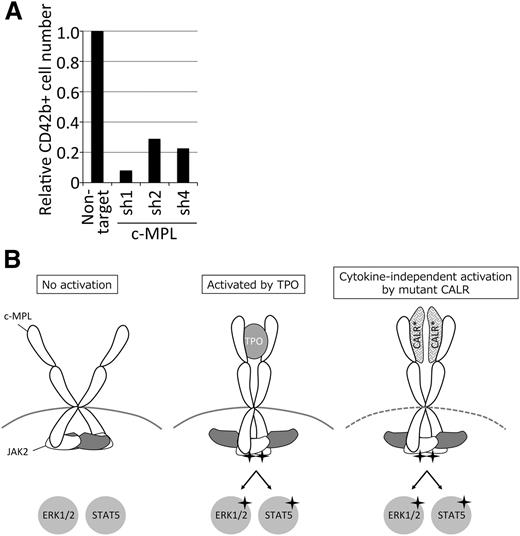
Finally, to confirm the constitutive c-MPL activation in CALR-mutated hematopoietic cells in more physiological conditions, we established iPS cells from an ET patient harboring the CALR Ins5 mutation (see “Methods” for further details). Hematopoietic stem cells generated from iPS cells showed TPO-independent megakaryopoiesis (H.T., S.M., M.A., N.M., Y.H., Y.M., Y.E., Y.S., Hiroshi Endo, Sou Nakamura, Koji Eto, A.O., and N.K., manuscript in preparation).25 To demonstrate the c-MPL requirement in TPO-independent megakaryopoiesis, we knocked down c-MPL expression using shRNA. The results indicated that the induction of CD42b+ megakaryocytes were greatly reduced in the cells infected with c-MPL but not control shRNA. (Figure 7A). These data imply that the mutant CALR-dependent c-MPL activation takes place in iPS-derived hematopoietic stem cells.
c-MPL is required for megakaryopoiesis in iPS-derived hematopoietic stem cells harboring CALR mutations. (A) Bar graph represents relative CD42b cell number induced from hematopoietic stem cells infected with indicated shRNA and cultured in TPO-free media. Note that c-MPL sh4 exhibits equivalent knock-down capacity to sh1-3 in UT-7/TPO CALR Del52 cells (not shown). (B) A model for JAK2 downstream activation by mutant CALR proteins. Mutant CALR interacts with c-MPL and presumably induces a structural change sufficient for JAK2 activation, leading to the phosphorylation of downstream molecules including ERK1/2 and STAT5. Note that mutant CALR and c-MPL may interact indirectly.
c-MPL is required for megakaryopoiesis in iPS-derived hematopoietic stem cells harboring CALR mutations. (A) Bar graph represents relative CD42b cell number induced from hematopoietic stem cells infected with indicated shRNA and cultured in TPO-free media. Note that c-MPL sh4 exhibits equivalent knock-down capacity to sh1-3 in UT-7/TPO CALR Del52 cells (not shown). (B) A model for JAK2 downstream activation by mutant CALR proteins. Mutant CALR interacts with c-MPL and presumably induces a structural change sufficient for JAK2 activation, leading to the phosphorylation of downstream molecules including ERK1/2 and STAT5. Note that mutant CALR and c-MPL may interact indirectly.
Discussion
Here, we have shown that the expression of CALR Del52 and Ins5 mutants in ET and PMF patients promotes TPO-independent growth in UT-7/TPO cells through activation of the c-MPL downstream pathways. We have shown that c-MPL is indispensable for mutant CALR function in UT-7/TPO and iPS-derived hematopoietic stem cells expressing mutant CALR. By domain analysis of mutant CALR, we proposed a model in which the unique C terminus sequence of CALR potentially creates a structural change and subsequently promotes CALR N-domain binding to c-MPL. Although the exact mechanism underlying JAK2 activation by mutant CALR binding to c-MPL is unclear, these findings shed light on why the CALR mutation is in the same epistasis group as JAK2 and c-MPL for ET and PMF, where aberrant megakaryocyte formation has been described as a hallmark of these diseases.
Homodimerization of the single-transmembrane cytokine receptor is required for the activation of downstream signaling molecules such as JAK2. However, our data indicate that mutant CALR does not promote homodimerization of c-MPL (Figure 5B), which suggests that the association between mutant CALR and c-MPL induces the structural change in the receptor-JAK2 complex required for activation. Interestingly, we recently found that mutant CALR also interacts with EPOR and CSF3R (supplemental Figure 1). In concordance with these findings, our preliminary data suggest that mutant CALR interacts with c-MPL at the cytokine receptor homology domain (data not shown), which is conserved in EPOR and CSF3R. However, c-MPL has 2 sets of this domain, whereas EPOR or CSF3R has only 1.26 Such a distinctive structural difference between c-MPL and EPOR or CSF3R may cause the differential JAK2 activation when binding to mutant CALR and selectively induce cytokine-independent growth in UT-7/TPO but not UT-7/EPO cells that exclusively express EPOR but not c-MPL (Figure 1D). For the activation of receptor-bound JAK2, a model of cytokine-induced complex structural change in the receptor-JAK2 complex has been proposed.21,27 Thus, a more detailed analysis of the structural change of the c-MPL-JAK2 complex induced by mutant CALR is required to further understand the molecular mechanism of c-MPL pathway activation by mutant CALR.
Based on these findings, we propose a model for mutant CALR-induced activation of JAK2 and its downstream signaling pathways through binding to c-MPL during MPN development (Figure 7B). Although more detailed molecular and structural analyses are required to understand this unique mechanism of JAK2 activation by CALR mutant proteins, our findings elucidate MPN pathogenesis and support the development of novel therapeutic strategies against MPNs with mutant CALR.
The online version of this article contains a data supplement.
The publication costs of this article were defrayed in part by page charge payment. Therefore, and solely to indicate this fact, this article is hereby marked “advertisement” in accordance with 18 USC section 1734.
Acknowledgments
We thank Joseph Nevins and Shing Leng Chan for their critical reading of the manuscript, Dider Trono for MD2G vector, Erina Hayashi for technical assistance, Kyoko Kubo and Megumi Hasegawa for secretarial assistance, and the other members of the Department of Hematology for supporting this study. We also thank the Laboratory of Molecular and Biochemical Research and the Division of Cell Biology at the Research Support Center of the Juntendo University Graduate School of Medicine.
This work was funded in part by the Ministry of Education, Culture, Sports, Science and Technology (MEXT)-Supported Program for the Strategic Research Foundation at Private Universities, and MEXT’s Promotion Plan for the Platform of Human Resource Development for Cancer project. The funders had no role in the study design, data collection and analysis, decision to publish, or preparation of the manuscript.
Authorship
Contribution: M.A., Y.Y., and N.K. conceived and designed the experiments; M.A., Y.Y., N.M., Y.H., H.T., S.M., Y.M., S.K., S.S., Y.E., and Y.S. performed the experiments; M.A. and Y.Y. analyzed the data; A.O. and N.K. contributed reagents/materials/analysis tools; and M.A., Y.Y., and N.K. wrote the paper.
Conflict-of-interest disclosure: M.A., Y.Y., and N.K. have submitted a patent application related to this study. The remaining authors declare no competing financial interests.
Correspondence: Norio Komatsu, Department of Hematology, Juntendo University Graduate School of Medicine, 2-1-1 Hongo, Bunkyo-ku, Tokyo, 113-8421, Japan; e-mail: komatsun@juntendo.ac.jp.
References
Author notes
M.A. and Y.Y. contributed equally to this work.

