

Key Points
Deletion/haploinsufficiency of Asxl1 causes MDS-like disease in mice.
Asxl1 loss reduces the HSC pool and decreases HSC hematopoietic repopulating capacity in vivo.
Abstract
ASXL1 is mutated/deleted with high frequencies in multiple forms of myeloid malignancies, and its alterations are associated with poor prognosis. De novo ASXL1 mutations cause Bohring-Opitz syndrome characterized by multiple congenital malformations. We show that Asxl1 deletion in mice led to developmental abnormalities including dwarfism, anophthalmia, and 80% embryonic lethality. Surviving Asxl1−/− mice lived for up to 42 days and developed features of myelodysplastic syndrome (MDS), including dysplastic neutrophils and multiple lineage cytopenia. Asxl1−/− mice had a reduced hematopoietic stem cell (HSC) pool, and Asxl1−/− HSCs exhibited decreased hematopoietic repopulating capacity, with skewed cell differentiation favoring granulocytic lineage. Asxl1+/− mice also developed mild MDS-like disease, which could progress to MDS/myeloproliferative neoplasm, demonstrating a haploinsufficient effect of Asxl1 in the pathogenesis of myeloid malignancies. Asxl1 loss led to an increased apoptosis and mitosis in Lineage–c-Kit+ (Lin–c-Kit+) cells, consistent with human MDS. Furthermore, Asxl1−/− Lin–c-Kit+ cells exhibited decreased global levels of H3K27me3 and H3K4me3 and altered expression of genes regulating apoptosis (Bcl2, Bcl2l12, Bcl2l13). Collectively, we report a novel ASXL1 murine model that recapitulates human myeloid malignancies, implying that Asxl1 functions as a tumor suppressor to maintain hematopoietic cell homeostasis. Future work is necessary to clarify the contribution of microenvironment to the hematopoietic phenotypes observed in the constitutional Asxl1−/− mice.
Introduction
Additional sex comb–like 1 (ASXL1) is a member of the Polycomb group of proteins, which are necessary for the maintenance of the stable repression of homeotic and other loci.1-5 Recently, copious clinical studies showed that ASXL1 is altered in multiple forms of myeloid malignancies, including myelodysplastic syndrome (MDS), myeloproliferative neoplasms (MPN), MDS/MPN (such as chronic myelomonocytic leukemia [CMML] and juvenile myelomonocytic leukemia [JMML]), and acute myeloid leukemia (AML).6-12 Alterations in ASXL1 are generally associated with signs of aggressiveness and poor prognosis in patients with CMML, MDS, myelofibrosis, and AML.13-17 ASXL1 alterations in myeloid malignancies have been reported as mutations and/or deletion, with the majority being frameshift and nonsense mutations,6-12 resulting in C-terminal truncation of the protein upstream of the PHD finger. A recent study showed that truncated forms of the ASXL1 protein were undetectable in leukemia samples with ASXL1 mutations, suggesting that these mutations are likely “bona fide loss-of-function” disease alleles.18 However, it remains possible that truncated forms of ASXL1 resulting from ASXL1 mutations in patients exert a gain-of-function and/or dominant-negative effect. Nevertheless, these clinical data suggest an important role of ASXL1 in the pathogenesis and/or transformation of myeloid malignancies. Therefore, it is important to elucidate the role ASXL1 plays in regulating normal hematopoiesis and pathogenesis of myeloid malignancies.
ASXL1 mutations in patients with myeloid malignancies are usually heterozygous,17 suggesting a haploinsufficient effect of ASXL1 in regulating hematopoietic stem/progenitor cell (HSC/HPC) functions and contributing to the development of myeloid malignancies. Intriguingly, de novo heterozygous mutations of ASXL1 gene occur in Bohring-Opitz syndrome, a rare condition characterized by facial anomalies, multiple malformations, failure to thrive, severe intellectual disabilities, and early death.19 These results suggest that somatic mutations of ASXL1 lead to myeloid malignancies, whereas germline ASXL1 mutations cause developmental phenotypes.
ASXL1 is mapped to chromosome 20q11, a region commonly involved in cancers.1 Studies showed that ASXL1 regulates epigenetic marks and transcription through interaction with polycomb complex proteins and various transcription activators and repressors.8,20,21 ASXL1 directly associates with BAP1 to form a PR-DUB complex, which deubiquitylates H2AK119.18,20 However, a recent study showed that the impact of ASXL1 in leukemogenesis does not seem to be mediated by the DUB complex.18 Importantly, ASXL1 interacts with components of the polycomb complex PRC2, which is involved in the deposition of H3K27me3 repressive marks.18 Inhibition of ASXL1 function diminishes H3K27me3 histone marks, reinforcing the importance of ASXL1 in regulating the methylation of H3K27.18 In addition, ASXL1 cooperates with HP1 to modulate the activity of LSD1,4,21 a histone demethylase for H3K4 and H3K9.
Multiple in vitro studies in nonhematopoietic cells have suggested multiple activities for ASXL1, including physical cooperativity with HP1 and LSD1 to repress retinoic acid receptor activity and interaction with PPARγ to suppress lipogenesis.4,21 Cooperative effects of ASXL1 loss with other gene mutations in leukemogenesis have been suggested by a recent study showing that shRNA-mediated Asxl1-knockdown and NRasG12D overexpression triggered a more severe myeloid malignancy in vivo.18 In an Asxl1-mutant mouse model, Fisher et al reported that Asxl1 loss mildly perturbed myelopoiesis but did not trigger a hematologic malignancy.22,23 The discrepancy between findings in human patients and the reported Asxl1-mutant model led us to wonder whether loss of function in ASXL1 mutations is indeed causative or is a “driver” genetic event in the development and/or progression of myeloid malignancies. Likewise, the mechanism by which ASXL1 mutations contribute to the pathogenesis of myeloid malignancies is of great importance in the field.
In the present study, we generated a murine model of ASXL1 with complete knockout of Asxl1. We showed that Asxl1−/− mice had developmental abnormalities, including dwarfism, anophthalmia, and 80% embryonic lethality during late gestation. Approximately 78% of Asxl1−/− newborns died within 1 day after birth, and the remaining 22% of Asxl1−/− mice lived for 18 to 42 days. These surviving Asxl1−/− mice developed features of MDS. Asxl1−/− mice had a reduced HSC pool, and Asxl1−/− HSCs exhibited decreased hematopoietic repopulating capacity with skewed cell differentiation favoring granulocytic lineage. Importantly, Asxl1+/− mice also developed an MDS-like phenotype, indicating a haploinsufficient effect of Asxl1 in the pathogenesis of myeloid malignancies. Moreover, Asxl1 loss led to an increased apoptosis and mitosis in bone marrow (BM) cells and Lin–c-Kit+ HPCs, characteristics of human MDS. Therefore this Asxl1 murine model recapitulates patients with MDS and provides a platform to investigate the cellular/molecular mechanisms by which Asxl1 loss leads to the pathogenesis of myeloid malignancies. Our animal study was approved by Indiana University Institutional Review Board on Animal Care.
Material and methods
See supplemental Material and methods (available on the Blood Web site) for this information.
Results
Generation of Asxl1:nlacZ/nGFP knock-in and Asxl1-null murine models
Targeted Asxl1-null mice were generated by replacing part of exon 1 sequences of the Asxl1 gene with nlacZ/nGFP (Figure 1A, supplemental Figure 1). The targeted allele results in transcription of nlacZ (Asxl1:nlacZ/nGFP) mRNA instead of Asxl1 (disrupting endogenous ATG). Heterozygous Asxl1:nlacZ/nGFP (Asxl1+/–) mice were interbred to obtain homozygous Asxl1;nlacZ/nGFP (Asxl1−/−) mice. The mean litter size in Asxl1+/– intercrossing was smaller compared with wild-type (WT) intercrossing (7.4 ± 2.8 pups/litter vs 10.6 ± 2.0 pups/litter, P < .01). Genotypic analysis of 991 live births revealed that Asxl1−/− newborns were underrepresented (Figure 1B), suggesting embryonic lethality of ∼80% of those embryos carrying both targeted alleles. This was confirmed by subsequent observation of dead Asxl1−/− embryos at embryonic day (E) 14.5 to 18.5 (supplemental Table 1). Moreover, ∼78% of the Asxl1−/− newborn mice (52/67) died within 1 day after birth, and the remaining 22% of Asxl1−/− mice (15/67) survived for 18 to 42 days (Figure 1C). All surviving Asxl1−/− mice displayed dwarfism with profoundly lower body weight, albeit the size of Asxl1+/− mice was comparable with that of their WT littermates (Figure 1D-E). In addition, Asxl1−/− mice exhibited anophthalmia (supplemental Figure 2A-B). These results indicate that Asxl1 deficiency leads to developmental abnormalities, including dwarfism and anophthalmia.

Generation of Asxl1:nlacZ/nGFP knock-in mice. (A) An nlacZ/nGFP-FRTNeoFRT cassette was introduced 6 bp upstream of the Asxl1 start codon. Rectangular black bars indicate exons. S, StuI. (B) Genotype distribution among live births of Asxl1+/− intercross. Asxl1−/− mice are underrepresented. P values are compared with normal Mendelian distribution (25%, 50%, 25%) using a χ2 test. (C) Kaplan-Meier curve representing the percent survival of Asxl1−/− (n = 12), Asxl1+/− (n = 42), and WT (n = 42) mice vs age in days. (D) The gross appearance of an Asxl1−/− mouse compared with WT and Asxl1+/− littermates (4 weeks old). (E) Body weight of WT, Asxl1+/−, and Asxl1−/− mice (3-6 weeks old, 9 mice/genotype; ***P < .001). (F) Western blot shows the reduced and deletion of Asxl1 expression in BM cells of representative Asxl1+/− and Asxl1−/− mice, respectively, compared with WT. (G) Analyses of Asxl1 mRNA expression levels in BM cells of WT (n = 4), Asxl1+/− (n = 5), and Asxl1−/− (n = 5) mice by qPCR with 4 different pairs of primers. The relative Asxl1 mRNA expression was determined by using β-actin as an internal calibrator and reported as relative expression units to the respective Asxl1 expression with each primer pair in WT mice. **P < .01, ***P < .001
Generation of Asxl1:nlacZ/nGFP knock-in mice. (A) An nlacZ/nGFP-FRTNeoFRT cassette was introduced 6 bp upstream of the Asxl1 start codon. Rectangular black bars indicate exons. S, StuI. (B) Genotype distribution among live births of Asxl1+/− intercross. Asxl1−/− mice are underrepresented. P values are compared with normal Mendelian distribution (25%, 50%, 25%) using a χ2 test. (C) Kaplan-Meier curve representing the percent survival of Asxl1−/− (n = 12), Asxl1+/− (n = 42), and WT (n = 42) mice vs age in days. (D) The gross appearance of an Asxl1−/− mouse compared with WT and Asxl1+/− littermates (4 weeks old). (E) Body weight of WT, Asxl1+/−, and Asxl1−/− mice (3-6 weeks old, 9 mice/genotype; ***P < .001). (F) Western blot shows the reduced and deletion of Asxl1 expression in BM cells of representative Asxl1+/− and Asxl1−/− mice, respectively, compared with WT. (G) Analyses of Asxl1 mRNA expression levels in BM cells of WT (n = 4), Asxl1+/− (n = 5), and Asxl1−/− (n = 5) mice by qPCR with 4 different pairs of primers. The relative Asxl1 mRNA expression was determined by using β-actin as an internal calibrator and reported as relative expression units to the respective Asxl1 expression with each primer pair in WT mice. **P < .01, ***P < .001
Analyses of Asxl1 expression in BM cells
We then examined the expression of Asxl1 in BM cells of WT, Asxl1+/−, or Asxl1−/− mice by Western blot analysis with an anti-Asxl1 antibody against Asxl1 N-terminus sequences. The full-length Asxl1 protein expression was not detected in Asxl1–/– and was significantly reduced in Asxl1+/– BM cells compared with WT cells (Figure 1F). To assess whether the mutant Asxl1 allele generates aberrant splice variants of Asxl1, the expression of Asxl1 mRNA in each genotype was analyzed with 4 different sets of primers (supplemental Table 2 and supplemental Figure 3). The Asxl1 mRNA expression was not detectable in the BM cells of Asxl1−/− mice using any primer set (Figure 1G), indicating a complete deletion of Asxl1 transcripts in Asxl1−/− mice. The Asxl1 mRNA expression in Asxl1+/− BM cells was decreased by 35% to 50% compared with that in WT cells (Figure 1G). The levels of Asxl2 and Asxl3 mRNA expression were comparable in BM cells from each genotype of mice (data not shown).
Loss of Asxl1 leads to MDS-like disease
We first examined whether loss of Asxl1 resulted in manifestations of myeloid malignancies in the surviving young Asxl1−/− mice (n = 9, 18-42 days old). May-Giemsa–stained peripheral blood (PB) smears prepared from these young Asxl1−/− mice showed dysplastic features, including hypersegmented neutrophils, hyposegmented (bilobed) neutrophils (supplemental Figure 4) with fine nuclear bridging consistent with pseudo–Pelger-Huët anomaly, an increased number of polychromatophilic red blood cells (RBCs), and Howell-Jolly body in erythrocytes (Figure 2A), whereas blasts were rare. PB counts of these young Asxl1−/− mice revealed multiple cytopenias consistent with myelodysplasia and ineffective hematopoiesis. Leukocytopenia was observed in 3 of the 9, thrombocytopenia was detected in 6 of the 9, and anemia was evident in 3 of the 9 Asxl1−/− mice (Figure 2B).

Loss of Asxl1 leads to MDS-like disease. (A) May-Giemsa–stained PB smears prepared from representative WT (a-b) and Asxl1−/− (c-k) mice are shown. The PB smear of Asxl1−/− mice showed dysplastic features including hypersegmented neutrophils (c-d), bilobed and hyposegmented neutrophils (e-f) consistent with pseudo–Pelger-Huët anomaly, as well as an increased number of polychromatophilic RBCs (h-i), and Howell-Jolly body in erythrocytes (e,g). The PB smear of representative Asxl1−/− mice showed monocytosis (j-k). (B) Parameters of PB were summarized from WT (n = 9) and Asxl1−/− (n = 9) mice of 3 to 6 weeks of age: WBC counts (a), Hb (b), platelets (c), neutrophils (d), monocytes (e), and lymphocytes (f). *P < .05, **P < .01. (C) Hematoxylin and eosin staining of paraffin-embedded sections of femurs (a-d) and spleen (e-h) from representative WT and Asxl1−/− mice (4 weeks old). BM: original magnification ×20 in (a) and (c), and original magnification ×100 in (b) and (d). Red arrows indicate megakaryocytes, and green arrows indicate myeloid cells. SP: original magnification ×4 in (e) and (g), and original magnification ×40 in (g) and (h). (D) Quantitation of the Gr1+/Mac1+, B220+, and CD4+/CD8+ cell populations. Percentage in PB, spleen, and BM cells of WT and Asxl1−/− mice (3-5 weeks old). Data are presented as mean ± SD from 4 sets of WT and Asxl1−/− littermates. *P < .05.
Loss of Asxl1 leads to MDS-like disease. (A) May-Giemsa–stained PB smears prepared from representative WT (a-b) and Asxl1−/− (c-k) mice are shown. The PB smear of Asxl1−/− mice showed dysplastic features including hypersegmented neutrophils (c-d), bilobed and hyposegmented neutrophils (e-f) consistent with pseudo–Pelger-Huët anomaly, as well as an increased number of polychromatophilic RBCs (h-i), and Howell-Jolly body in erythrocytes (e,g). The PB smear of representative Asxl1−/− mice showed monocytosis (j-k). (B) Parameters of PB were summarized from WT (n = 9) and Asxl1−/− (n = 9) mice of 3 to 6 weeks of age: WBC counts (a), Hb (b), platelets (c), neutrophils (d), monocytes (e), and lymphocytes (f). *P < .05, **P < .01. (C) Hematoxylin and eosin staining of paraffin-embedded sections of femurs (a-d) and spleen (e-h) from representative WT and Asxl1−/− mice (4 weeks old). BM: original magnification ×20 in (a) and (c), and original magnification ×100 in (b) and (d). Red arrows indicate megakaryocytes, and green arrows indicate myeloid cells. SP: original magnification ×4 in (e) and (g), and original magnification ×40 in (g) and (h). (D) Quantitation of the Gr1+/Mac1+, B220+, and CD4+/CD8+ cell populations. Percentage in PB, spleen, and BM cells of WT and Asxl1−/− mice (3-5 weeks old). Data are presented as mean ± SD from 4 sets of WT and Asxl1−/− littermates. *P < .05.
The BM of these young Asxl1−/− mice exhibited normo- or hypercellularity as determined by cellularity/femur/body weight (supplemental Figure 5A-B). Morphologic examination of the BM of these Asxl1−/− mice revealed myeloid hyperplasia and relative erythroid hypoplasia with smaller erythroid islands compared with WT (Figure 2Ca-d). In addition, megakaryocytes in Asxl1−/− marrow were significantly smaller with hypolobated nuclei compared with megakaryocytes with multilobated nuclei in WT BM. Interestingly, spleen, but not liver, of these Asxl1−/− mice were of dramatically lower volume and weight (hyposplenia) than those of their WT and Asxl1+/– littermates (supplemental Figure 5C-E). The histology of the Asxl1−/− spleen revealed features of spleen atrophy, with dramatically reduced cellularity of the red pulp (Figure 2Ce-h). Lymphoid aggregates in the white pulp (disrupted architecture) of the Asxl1−/− spleen were also smaller than those of WT spleen. Consistently, flow cytometric analyses of Asxl1−/− PB, BM, and spleen cells revealed an increased proportion of granulocytic/monocytic cells (Gr-1+/Mac1+) but a decreased proportion of B220+ B cells (Figure 2D and supplemental Figure 6). The proportion of CD4+ and CD8+ T cells was also increased in the spleen, which might be relative to the decreased B-cell population (Figure 2D and supplemental Figure 6). Collectively, these data show that Asxl1 deletion leads to a disease phenotype resembling clinical manifestations of MDS in human.
Haploinsufficiency of Asxl1 is sufficient for the development of MDS-like disease and MDS/MPN
The majority of the ASXL1 mutations in patients with myeloid malignancies are heterozygous.6-12 We next examined whether haploinsufficiency of Asxl1 is sufficient for the development of myeloid malignancies by analyzing a cohort of 10 young (3-6 weeks old) and 18 adult (6-12 months old) Asxl1+/− mice. May-Giemsa–stained PB smears prepared from each of the Asxl1+/− mice showed dysplastic features, including hypersegmented neutrophils, hyposegmented (bilobed) neutrophils consistent with pseudo–Pelger-Huët anomaly, frequent apoptotic neutrophils, hypogranulated neutrophils, and an increased number of polychromatophilic RBCs (Figure 3A). Interestingly, adult Asxl1+/− mice exhibited more severe dysplasia of myeloid lineage than young Asxl1+/− mice, indicating disease progression. The age-dependent disease progression in Asxl1+/− mice was also substantiated by the PB counts and histologic and flow cytometric analyses. The adult Asxl1+/− mice displayed a higher frequency of anemia and thrombocytopenia than did the young Asxl1+/− mice. In addition, white blood cell (WBC) counts of adult Asxl1+/− mice were more heterogeneous, with many mice showing leukopenia, including neutropenia, and some mice displaying leukocytosis and monocytosis (Figure 3B). Absolute monocytosis/neutrophilia was identified in 4 of the 18 adult Asxl1+/− mice (22%) but in none of the young Asxl1+/− mice (Figure 3B). The presence of anemia, thrombocytopenia, leukocytosis, absolute monocytosis/neutrophilia, and dysplasia is consistent with human MDS/MPN, especially CMML. Histologic analysis of spleen and liver sections of the adult Asxl1+/− mice showed disrupted splenic architecture, with an increased proportion of myeloid cells, and perivascular myeloid cell infiltration in the liver (Figure 3C). BM histologic sections of adult Asxl1+/− mice revealed an increase in the proportion of myeloid cells and relatively decreased erythroid islands (Figure 3D). Compared with their WT counterparts, adult Asxl1+/− mice showed an increased myeloid/erythroid ratio (WT = 2.6 ± 0.3, Asxl1+/− with MDS-like disease = 4.2 ± 1.2; P < .05 and Asxl1+/− with MDS/MPN = 6.5 ± 2.1, P < .01; n = 4-5). Dysplastic myeloid cells were also frequently seen in Asxl1+/− BM (Figure 3D). Flow cytometric analysis confirmed the increased granulocytic/monocytic (Gr-1+/Mac-1+) and decreased B220+ B-cell populations in the BM and spleen of adult Asxl1+/− mice, whereas the proportions of CD4+/CD8+ cell populations in the BM and spleen were comparable (Figure 3E, supplemental Figure 7). These data suggest that haploinsufficiency of Asxl1 is sufficient to cause MDS-like disease and/or MDS/MPN in mice.

Haploinsufficiency of Asxl1 is sufficient for the development of MDS-like disease and MDS/MPN in mice. (A) May-Giemsa–stained PB smears prepared from representative adult WT (a-b) and Asxl1+/− (c-j) mice (6-12 months old) are shown. The PB smear of Asxl1+/− mice showed dysplastic features including bilobed and hyposegmented neutrophils with clumping chromatin consistent with pseudo–Pelger-Huët anomaly (c-d), hypersegmented neutrophils (e-f), and apoptotic neutrophils (g-h). The PB smear of representative Asxl1+/− mice showed monocytosis (i-j). (B) Parameters of PB were summarized from young WT (n = 7) and Asxl1+/− (3-6 weeks old, n = 10) and aged WT (n = 7) and adult Asxl1+/− (6-12 months old, n = 18) mice: WBC counts (a), Hb (b), platelets (c), neutrophils (d), monocytes (e), and lymphocytes (f). (C-D) Hematoxylin and eosin staining of paraffin-embedded sections of spleen (C, right), liver (C, left), and femurs (D), from representative aged WT and Asxl1+/− mice. Yellow lines represent areas containing infiltrating myeloid cells (Cg-h). Blue arrows indicate dysplastic cells (Dd). Spleen and liver: original magnification ×4 in (a), (c), (e), and (g); and original magnification ×40 in (b), (d), (f), and (h). BM: original magnification ×20 in (a) and (c), and original magnification ×100 in (b) and (d). (E) Quantitation of the percentage of Gr1+/Mac1+, B220+, and CD4+/CD8+ cell populations in PB, spleen, and BM of WT and Asxl1+/− mice (6-12 months old). Data are presented as mean ± SD from 5 sets of WT and Asxl1+/− littermates. *P < .05.
Haploinsufficiency of Asxl1 is sufficient for the development of MDS-like disease and MDS/MPN in mice. (A) May-Giemsa–stained PB smears prepared from representative adult WT (a-b) and Asxl1+/− (c-j) mice (6-12 months old) are shown. The PB smear of Asxl1+/− mice showed dysplastic features including bilobed and hyposegmented neutrophils with clumping chromatin consistent with pseudo–Pelger-Huët anomaly (c-d), hypersegmented neutrophils (e-f), and apoptotic neutrophils (g-h). The PB smear of representative Asxl1+/− mice showed monocytosis (i-j). (B) Parameters of PB were summarized from young WT (n = 7) and Asxl1+/− (3-6 weeks old, n = 10) and aged WT (n = 7) and adult Asxl1+/− (6-12 months old, n = 18) mice: WBC counts (a), Hb (b), platelets (c), neutrophils (d), monocytes (e), and lymphocytes (f). (C-D) Hematoxylin and eosin staining of paraffin-embedded sections of spleen (C, right), liver (C, left), and femurs (D), from representative aged WT and Asxl1+/− mice. Yellow lines represent areas containing infiltrating myeloid cells (Cg-h). Blue arrows indicate dysplastic cells (Dd). Spleen and liver: original magnification ×4 in (a), (c), (e), and (g); and original magnification ×40 in (b), (d), (f), and (h). BM: original magnification ×20 in (a) and (c), and original magnification ×100 in (b) and (d). (E) Quantitation of the percentage of Gr1+/Mac1+, B220+, and CD4+/CD8+ cell populations in PB, spleen, and BM of WT and Asxl1+/− mice (6-12 months old). Data are presented as mean ± SD from 5 sets of WT and Asxl1+/− littermates. *P < .05.
Diagnosis and subclassification of the myeloid malignancies developed in 18 adult AsxI1+/− mice
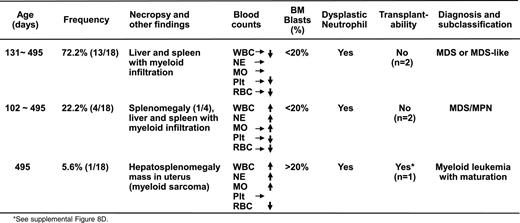
Notably, one Asxl1+/− mouse (B8) developed overt disease and became moribund at 16 months of age. In addition to elevated WBC counts and anemia (supplemental Table 3), necropsy revealed splenomegaly and a large mass in the uterus (supplemental Figure 8A). Flow cytometric analysis indicated that this mass was composed of Gr-1+/Mac1+ cells, suggesting myeloid sarcoma (supplemental Figure 8B-C). A tumor transfer assay showed that transferring 1 × 10⁶ spleen cells from this aged, end-disease stage Asxl1+/− mouse successfully caused neutrophilia/monocytosis and splenomegaly in sublethally irradiated WT recipients, verifying the malignant nature of the cells from the moribund Asxl1+/− mouse (supplemental Figure 8D). On the basis of the Bethesda proposals for classifying nonlymphoid hematopoietic neoplasms in mice,24 the pathology in this moribund Asxl1+/− mouse met the criteria for myeloid leukemia with maturation (neoplastic cells showed some maturation, more than 20% immature forms/blasts in the BM, supplemental Figure 8E-F). Collectively, heterozygous deletion of Asxl1 leads to the development of MDS-like disease in mice, some of which could progress/transform to MDS/MPN and myeloid leukemia (Table 1, supplemental Table 3). Approximately 14% of the Asxl1+/− mice (up to 16 months) became moribund or died as a result of severe myeloid malignancies (Figure 1C). These findings are significantly clinically relevant because ASXL1 mutations are associated with a more aggressive clinical course in MDS/CMML patients and have a high risk to progress to leukemia.13-17
Asxl1 loss leads to increased apoptotic and mitotic cells in BM
Increased apoptosis and cell proliferation are characteristic features of MDS.25 We next examined whether Asxl1 loss affected the apoptosis and mitosis of BM cells. May-Giemsa–stained BM cell cytospin preparations revealed a higher proportion of apoptotic and mitotic cells in Asxl1+/− and Asxl1−/− BM compared with WT BM, in which apoptotic and mitotic cells were rarely seen (supplemental Figure 9A). When BM cells were evaluated for apoptosis by Annexin V/7-AAD staining after 18-hour starvation, starvation-induced apoptosis was significantly greater in Asxl1+/− and Asxl1−/− BM cells compared with WT controls (supplemental Figure 9B-C). In addition, when freshly isolated BM Lin–c-Kit+ cells were analyzed for apoptosis (Figure 4A-B) and cytokine cocktail–stimulated Lin–c-Kit+ cells were analyzed for cell-cycle profiling (Figure 4C), a significantly higher percentage of apoptotic cells and cells of S/G2/M phases were observed in Asxl1−/− Lin–c-Kit+ cells than that in WT cells. Asxl1+/− Lin–c-Kit+ cells also contained a higher proportion of apoptotic cells than did WT controls (Figure 4A-B). Furthermore, examination of May-Giemsa–stained cytospin preparations of colonies derived from Asxl1+/− or Asxl1−/− BM cells (with mSCF, mIL-3, EPO, and IL-6 for 8 days) revealed dramatically increased proportions of mitotic cells compared with WT BM cell–derived colonies (Figure 4D-E). A significantly higher proportion of mitotic cells was also noted in Asxl1−/− BM cell–derived colonies than in Asxl1+/− BM cell–derived colonies. These data indicate that Asxl1 loss in mice resulted in increased apoptosis and mitosis of BM cells, consistent with cellular phenotypes of human MDS.

Asxl1 loss leads to increased apoptotic and mitotic cells in BM Lin–c-Kit+cells. (A) Flow cytometric analysis of freshly isolated Lin–c-Kit+ cells from the BM of representative WT, Asxl1+/−, and Asxl1−/− littermates (5 weeks old) after Annexin V/7-AAD staining. (B) Quantitation of the subgroup of apoptotic cell population that is Annexin V+/7-AAD–. Data are presented as mean ± SD from 3 sets of WT, Asxl1+/−, and Asxl1−/− mice (4-5 weeks old). (C) Cell cycle analysis of Lin–c-Kit+ cells from representative WT, Asxl1+/−, and Asxl1−/− littermates are shown (5 weeks old). Similar results were obtained using another set of Asxl1 littermates of mice (4 weeks old). (D-E) Representative images of May-Giemsa–stained cytospin preparations of cells from WT, Asxl1+/−, or Asxl1−/− BM cell–derived colonies showing an increased proportion of mitotic cells (red arrowheads, D). The quantitation of the percent of mitotic cells is shown by performing a 500-cell count of at least 10 colonies from each genotype (E). Representative data from 2 separate experiments are shown as mean ± SD. *P < .05, **P < .01.
Asxl1 loss leads to increased apoptotic and mitotic cells in BM Lin–c-Kit+cells. (A) Flow cytometric analysis of freshly isolated Lin–c-Kit+ cells from the BM of representative WT, Asxl1+/−, and Asxl1−/− littermates (5 weeks old) after Annexin V/7-AAD staining. (B) Quantitation of the subgroup of apoptotic cell population that is Annexin V+/7-AAD–. Data are presented as mean ± SD from 3 sets of WT, Asxl1+/−, and Asxl1−/− mice (4-5 weeks old). (C) Cell cycle analysis of Lin–c-Kit+ cells from representative WT, Asxl1+/−, and Asxl1−/− littermates are shown (5 weeks old). Similar results were obtained using another set of Asxl1 littermates of mice (4 weeks old). (D-E) Representative images of May-Giemsa–stained cytospin preparations of cells from WT, Asxl1+/−, or Asxl1−/− BM cell–derived colonies showing an increased proportion of mitotic cells (red arrowheads, D). The quantitation of the percent of mitotic cells is shown by performing a 500-cell count of at least 10 colonies from each genotype (E). Representative data from 2 separate experiments are shown as mean ± SD. *P < .05, **P < .01.
Altered HSC and myeloid progenitor populations in Asxl1−/− mice
To determine whether deleting Asxl1 affects the HSC/HPC pool in vivo, we analyzed the Lin–Sca1+c-Kit+ (LSK) and Lin–Sca1–c-Kit+ (LK) cell populations in the BM of young WT, Asxl1+/−, and Asxl1−/− mice (3-6 weeks old). The proportion of LSK cells, but not LK cells, was significantly decreased in young Asxl1−/− mice compared with WT controls (Figure 5A-C). When the myeloid progenitor populations were analyzed within the LK populations, the percentage of granulocyte-macrophage progenitor (GMP) population was higher, whereas megakaryocyte-erythroid progenitor (MEP) population was lower in the BM of Asxl1−/− mice compared with that of WT and Asxl1+/− mice (Figure 5D-E). Consistently, colony assays revealed a moderate decrease in colony-forming unit (CFU)-C and burst-forming unit–E frequency of Asxl1−/− BM cells compared with WT controls (Figure 5F), presumably because of a decreased frequency and increased apoptosis of HSC/HPCs. These data suggest that Asxl1 deletion decreases the HSC pools and alters the GMP and MEP populations in young mice.

Altered HSC and myeloid progenitor cell populations in Asxl1−/−mice. (A) Flow cytometric analysis of LSK and LK compartments in the BM of representative young WT, Asxl1+/−, and Asxl1−/− mice (4 weeks old). (B-C) Quantitation of the percent of LSK (B) and LK (C) cells in the total BM cells of each genotype of mice (mean ± SD, 4-5 mice/genotype, 3-6 weeks old, *P < .05). (D) Flow cytometric analysis of CMP, GMP, and MEP populations in the BM LK cell population of WT, Asxl1+/−, and Asxl1−/− mice are shown. (E) Quantitative analysis of CMP, GMP, and MEP populations in the LK cell population (4-5 mice/group, 3-6 weeks old, *P < .05). (F) BM progenitor assay. CFU numbers were assessed in semisolid media in the presence of mSCF, mIL-3, IL-6, and EPO. Data are presented as mean ± SEM from 4 to 5 mice per genotype. Black bars represent CFU-GM (granulocytes/macrophages), open bars represent BFU-E (burst forming unit-erythrocyte), and gray bars represent CFU-Mix (mixed colonies of GM, E, and megakaryocytic cells). *P < .05.
Altered HSC and myeloid progenitor cell populations in Asxl1−/−mice. (A) Flow cytometric analysis of LSK and LK compartments in the BM of representative young WT, Asxl1+/−, and Asxl1−/− mice (4 weeks old). (B-C) Quantitation of the percent of LSK (B) and LK (C) cells in the total BM cells of each genotype of mice (mean ± SD, 4-5 mice/genotype, 3-6 weeks old, *P < .05). (D) Flow cytometric analysis of CMP, GMP, and MEP populations in the BM LK cell population of WT, Asxl1+/−, and Asxl1−/− mice are shown. (E) Quantitative analysis of CMP, GMP, and MEP populations in the LK cell population (4-5 mice/group, 3-6 weeks old, *P < .05). (F) BM progenitor assay. CFU numbers were assessed in semisolid media in the presence of mSCF, mIL-3, IL-6, and EPO. Data are presented as mean ± SEM from 4 to 5 mice per genotype. Black bars represent CFU-GM (granulocytes/macrophages), open bars represent BFU-E (burst forming unit-erythrocyte), and gray bars represent CFU-Mix (mixed colonies of GM, E, and megakaryocytic cells). *P < .05.
Interestingly, when the LSK and LK cell populations in the BM of adult Asxl1+/− mice were examined, the proportion of both LSK and LK cells was significantly greater in adult Asxl1+/− mice with MDS/MPN but was smaller in adult Asxl1+/− mice with MDS compared with age-matched WT controls (supplemental Figure 10A-C). Moreover, the GMP frequency was dramatically increased and MEP frequency significantly decreased in adult Asxl1+/− mice with MDS/MPN but not in adult Asxl1+/− mice with MDS (supplemental Figure 10D-E). Consistently, the BM and spleen cells of adult Asxl1+/− mice with MDS/MPN contained higher frequencies, and adult Asxl1+/− mice with MDS had lower frequencies, of CFU-C compared with WT controls (supplemental Figure 10F-G). These data suggest that Asxl1 haploinsufficiency differentially alters HSC/HPC pools as animals develop different spectrum of myeloid malignancies.
Asxl1 loss impairs hematopoietic repopulating capacity
We next performed a competitive repopulation assay to determine whether deleting Asxl1 affects the cell fates of HSCs in vivo. When PB was determined for donor chimerism 1, 2, 4, 6, or 10 months after transplantation, the CD45.2 chimerisms remained ∼50% in mice receiving WT BM cells, whereas a steady decline in the CD45.2 chimerism was observed in mice receiving Asxl1+/− or Asxl1−/− BM cells, with a significantly lower CD45.2 chimerism in mice receiving Asxl1−/− BM cells (Figure 6A). At month 10, the CD45.2 chimerism decreased to less than 10% in the PB of mice receiving Asxl1−/− BM cells. Consistent with PB, the CD45.2 chimerism was significantly lower in the BM of mice receiving Asxl1−/− or Asxl1+/− BM cells than in the mice receiving WT BM cells (Figure 6B). Interestingly, Asxl1−/− BM cells contributed to a greater proportion of Gr-1+/Mac1+ granulocytic/monocytic cells, a smaller proportion of B220+ B cells, and significantly smaller proportions of LSK and LK HSC/HPCs in the recipient BM compared with the WT controls. In addition, serial transplantation showed a stable BM CD45.2 chimerism (range 42%-52%) in WT BM transplants, whereas BM CD45.2 chimerism decreased upon each round of Asxl1+/− or Asxl1−/− BM transplantation, with a sharper decline in Asxl1−/− BM transplants (Figure 6C). These data suggest that Asxl1 deletion/haploinsufficiency impairs the long-term repopulating capacity and self-renewal of HSCs and likely confers a skewed differentiation toward granulocytic/monocytic lineage in vivo.

Asxl1 loss impaired the hematopoietic repopulation capacity of HSCs. CD45.2+ BM cells from young WT, Asxl1+/−, or Asxl1−/− mice were mixed with CD45.1+ competitor cells at a ratio of 1:1 (1 × 10⁶ cells each) and transplanted into lethally irradiated F1 recipients. (A) The kinetics of CD45.2 chimerism in the PB of mice receiving WT, Asxl1+/−, or Asxl1−/− BM cells are shown (mean ± SD of 3-7 animals). (B) Flow cytometric analysis of BM cells from representative mice receiving WT, Asxl1+/−, or Asxl1−/− BM cells 10 months after transplantation using indicated antibody combinations. The percent CD45.2+ cells as well as Gr1+/Mac1+, B220+, and LSK distribution within the CD45.2+ cells in the BM of each group of recipient mice is shown (mean ± SD of 3-5 animals). (C) Serial transplantations were performed as described in supplemental Material and methods. The percent CD45.2 chimerism in the BM of recipient mice 4 months after each round of transplantation is show as mean ± SEM. *P < .05, **P < .01.
Asxl1 loss impaired the hematopoietic repopulation capacity of HSCs. CD45.2+ BM cells from young WT, Asxl1+/−, or Asxl1−/− mice were mixed with CD45.1+ competitor cells at a ratio of 1:1 (1 × 10⁶ cells each) and transplanted into lethally irradiated F1 recipients. (A) The kinetics of CD45.2 chimerism in the PB of mice receiving WT, Asxl1+/−, or Asxl1−/− BM cells are shown (mean ± SD of 3-7 animals). (B) Flow cytometric analysis of BM cells from representative mice receiving WT, Asxl1+/−, or Asxl1−/− BM cells 10 months after transplantation using indicated antibody combinations. The percent CD45.2+ cells as well as Gr1+/Mac1+, B220+, and LSK distribution within the CD45.2+ cells in the BM of each group of recipient mice is shown (mean ± SD of 3-5 animals). (C) Serial transplantations were performed as described in supplemental Material and methods. The percent CD45.2 chimerism in the BM of recipient mice 4 months after each round of transplantation is show as mean ± SEM. *P < .05, **P < .01.
Deletion of Asxl1 altered expression of genes implicated in apoptosis regulation and reduced global levels of H3K27me3 and H3K4me3 in Lin–c-Kit+ cells
The Polycomb group of proteins maintains the “off state” of the clustered homeotic box (Hox) genes, and Asxl1 is a member of the Polycomb group of proteins.26 We then determined whether deletion of Asxl1 leads to altered expression of HoxA genes (HoxA5/7/9/10) in Lin–c-Kit+ cells by quantitative polymerase chain reaction (qPCR). The expression of each of these HoxA genes was significantly higher in Asxl1−/− BM Lin–c-Kit+ cells than in WT Lin–c-Kit+ cells (Figure 7A). Asxl1−/− Lin–c-Kit+ cells are characterized by increased apoptosis. We therefore examined the expression of several genes implicated in apoptosis regulation, including Bcl2, Bcl2l12, and Bcl2l13. Bcl2l13 (an apoptosis facilitator) was upregulated, whereas Bcl2 and Bcl2l12 (pro-apoptotic genes) were downregulated in Asxl1−/− Lin–c-Kit+ cells (Figure 7A), which might contribute to the increased apoptosis of Asxl1−/− Lin–c-Kit+ cells.

Asxl1−/−HSC/HPCs had an altered expression of genes implicated in apoptosis regulation and reduced global levels of H3K27me3 and H3K4me3. (A) The mRNA expression of HoxA5/7/9/10, Bcl2l13, Bcl2, and Bcl2l12 in the BM Lin–c-Kit+ cells of WT (n = 4) and Asxl1−/− (n = 4) mice were determined by qPCR. Data are shown as relative expression units to the respective gene expression in WT mice using Gapdh as an internal calibrator. (B) Western blot analyses of H3K27me3 and H3K4me3 in the BM Lin–c-Kit+ cells of each genotype of mice. Total H3 levels served as loading controls. Representative blots from 3 independent experiments are shown.
Asxl1−/−HSC/HPCs had an altered expression of genes implicated in apoptosis regulation and reduced global levels of H3K27me3 and H3K4me3. (A) The mRNA expression of HoxA5/7/9/10, Bcl2l13, Bcl2, and Bcl2l12 in the BM Lin–c-Kit+ cells of WT (n = 4) and Asxl1−/− (n = 4) mice were determined by qPCR. Data are shown as relative expression units to the respective gene expression in WT mice using Gapdh as an internal calibrator. (B) Western blot analyses of H3K27me3 and H3K4me3 in the BM Lin–c-Kit+ cells of each genotype of mice. Total H3 levels served as loading controls. Representative blots from 3 independent experiments are shown.
ASXL1 knockdown has recently been shown to significantly reduce global H3K27me3 levels in myeloid cells.18 We next examined whether deleting Asxl1 altered the global H3 methylation states in Lin–c-Kit+ cells. Western blot analysis with nuclear extracts of Lin–c-Kit+ cells showed decreased levels of global H3K4me3 and H3K27me3 in Asxl1−/− Lin–c-Kit+ cells compared with WT and Asxl1+/− Lin–c-Kit+ cells (Figure 7B). These results indicate that Asxl1 is required to maintain H3 methylation states in HSC/HPCs.
Discussion
Despite the clinical importance of ASXL1 mutations in the myeloid malignancies, the cellular and molecular mechanisms underpinning the ASXL1 loss–mediated pathogenesis of myeloid malignancies remains largely unknown. In the present study, using our newly generated Asxl1 knockout murine model, we made several important observations. First, Asxl1 deletion in mice led to developmental abnormalities including dwarfism and anophthalmia. Second, Asxl1−/− mice developed a phenotype resembling many characteristics of MDS. Third, deletion of Asxl1 reduces the HSC pool and decreases HSC hematopoietic repopulating capacity in vivo, which is associated with increased apoptosis and mitosis. Fourth, Asxl1+/− mice also developed a mild MDS-like disease, which could progress to MDS/MPN, demonstrating a haploinsufficient effect of Asxl1 in the pathogenesis of myeloid malignancies.
De novo mutations in the ASXL1 gene have been shown to account for approximate 50% cases of Bohring-Opitz syndrome, which is a rare disease characterized by facial anomalies, multiple malformations, failure to thrive, and severe intellectual disabilities.19 This severe condition often leads to death at an early age, preventing knowledge of whether susceptibility to myeloid malignancies might result from ASXL1 germ-line mutations. Fisher et al showed that Asxl1-mutant mice exhibited alterations of the axial skeleton.23 In this study, we showed that Asxl1-deletion caused multiple developmental defects in mice including dwarfism and anophthalmia. The mechanisms by which Asxl1 deletion causes developmental defects needs to be elucidated.
The majority of myeloid malignancy patients with ASXL1 mutations retain a WT copy and a mutant allele of ASXL1, which leads to nonsense/frameshift, suggesting loss of function.6-12 Therefore ASXL1 has been speculated to be a putative tumor suppressor gene that is strongly implicated in the pathogenesis of myeloid malignancies. Consistent with the clinical genetic characteristics, haploinsufficient loss of Asxl1 in mice leads to the development of MDS-like disease. These data provide persuasive functional evidence that haploinsufficiency of Asxl1 is sufficient to cause MDS-like disease in vivo. In addition, a subset of Asxl1+/− mice progress to MDS/MPN as they age, displaying neutrophilia and/or monocytosis, and an increased number of granulocytic/monocytic cells in the BM, suggesting that ASXL1 loss can lead to myelomonocytic expansion. This is consistent with the observations that ASXL1 mutations are common in CMML, which is classified as a MDS/MPN.6-12 Clonal dominance is a defining feature of MDS. Concomitant mutations have been frequently found in myeloid malignancy patients with ASXL1 mutations. It is possible that Asxl1+/− mice could acquire mutations in critical genes, promoting the clonal dominance over time. Indeed, MDS in 1 aged Asxl1+/− mouse progressed to myeloid leukemia, which was transferable into sublethally irradiated naïve WT recipient mice. Multiple clinical studies have shown that mutations in ASXL1 are associated with signs of aggressiveness and poor prognosis in patients with CMML, MDS, myelofibrosis, and AML.13-17 In MDS and CMML, ASXL1 mutations are frequently present in chronic phases and precede transformation.27 Data obtained from the animal model are consistent with these clinical observations.
Increased apoptosis and mitosis of hematopoietic precursors are characteristic cellular features of human MDS.25 Bouscary et al reported that the proliferation of dysplastic clones is likely accompanied by a significant increase in apoptosis.28 We consistently observed an increased apoptosis and mitosis in Asxl1+/− and Asxl1−/− BM and Lin–c-Kit+ cells, which could result in the ineffective hematopoiesis and high risk of leukemic transformation in these mice. The upregulated apoptotic facilitator, Bcl2l13, and downregulated anti-apoptotic genes, Bcl2 and Bcl2l12, in Asxl1−/− Lin–c-Kit+ cells could play a critical role in their increased apoptosis. Interestingly, myeloid progenitors of the NUP98-HOXD13 transgenic MDS mice have been shown to have an increased rate of apoptosis, which is also associated with a reduction in Bcl2.29
Although truncated forms of the ASXL1 protein were undetectable in leukemia samples with ASXL1 mutations in a recent study, suggesting that these mutations are likely loss-of-function disease alleles,18 this still cannot definitively eliminate the possibility that truncated forms of ASXL1 resulting from ASXL1 mutations in patients exert a gain-of-function and/or dominant-negative effect. In vivo studies using transgenic or knock-in strategies to express truncated Asxl1 proteins in mice are warranted to thoroughly clarify this possibility.
Aberrant apoptosis and/or senescence may alter the HSC/HPC pool in vivo. Indeed, Asxl1−/− mice had a decreased HSC pool. In a competitive reconstitution assay, Asxl1−/− HSC/HPCs exhibited a reduced HSC self-renewal and long-term hematopoietic repopulating capacity with a skewed cell differentiation, favoring granulocytic lineage. These data together with the increased apoptosis in Asxl1−/− HSC/HPCs suggest that Asxl1 regulates HSC/HPC cellular functions. The ASXL1 gene can be translocated and fused to the PAX5 gene in B-acute lymphoblastoid leukemia.30 Recent genome sequencing studies revealed low frequencies of ASXL1 mutations in B-chronic lymphocytic leukemia,31 but not in T-cell–acute leukemia.32 Although we did not observe lymphoid malignancies in the cohort of Asxl1−/− and Asxl1+/− mice, deletion/haploinsufficiency of Asxl1 did cause impaired B-cell development, consistent with a previous report by Fisher et al.23 Studies using B- or T-cell lineage–specific Asxl1 inactivation may be necessary to further clarify the exact role of Asxl1 in B- and T-cell development, respectively. Furthermore, increasing evidence has been shown that the BM microenvironment plays an important role in the development and progression of myeloid malignancies.33 Our study cannot rule out a possibility that an altered microenvironment may contribute to the hematopoietic phenotype and myeloid malignancy development observed in the constitutive Asxl1-deficient murine models. However, the competitive transplantation data suggest an intrinsic effect of Asxl1 in regulating HSC/HPC function.
Interacting with histone-modifying enzymes including EZH2 and LSD1, Asxl1 deletion globally decreases H3K27me3 and H3K4me3 in Lin–c-Kit+ cells, consistent with Abdel-Wahab et al’s observation that Asxl1 knockdown resulted in diminished H3K27me3 histone mark in leukemia myeloid cell lines.18 H3K4me3 is associated with transcriptional competence and activation, whereas H3K27me3 and H3K9me3 are frequently associated with repressed gene expression.34-37 It would be logical and important to interrogate the dysregulated gene expression with the genomic alteration of histone marks identified by Chip-Seq experiments.
Collectively, our results demonstrate that deletion/haploinsufficiency of Asxl1 in mice is sufficient to recapitulate disease manifestations of patients with MDS and MDS/MPN, implying that Asxl1 functions as a tumor suppressor in myelopoiesis. The current ASXL1 murine model provides an ideal platform for unveiling the detailed mechanisms of Asxl1 loss–mediated multiple-step pathogenesis of myeloid malignancies and for testing novel therapeutic agents for myeloid malignant patients with ASXL1 alterations.
The online version of this article contains a data supplement.
The publication costs of this article were defrayed in part by page charge payment. Therefore, and solely to indicate this fact, this article is hereby marked “advertisement” in accordance with 18 USC section 1734.
Acknowledgments
This work was supported in part by grants from the Leukemia and Lymphoma Society (F.-C.Y.), the Department of Defense (NF073112 [F.-C.Y.]), the National Institutes of Health, National Cancer Institute (CA155294, [F.-C.Y.] and Heart, Lung and Blood Institute HL112294 [M.X.]), the Children’s Tumor Foundation (S.R.), and the Indiana Clinical and Translational Sciences Institute (PHS NCCR, 5TL1RR025759-03 [S.D.R.]).
Authorship
Contribution: J.W., Z.L., Y.H., S.C., S.R., F.P., J.Y., L.J., L.N., and X.Y. performed the experiments and analyzed the data; Z.L. assisted in the statistical analysis; H.N. and J.Z. reviewed the blood smears and histopathologic sections; O.W. and C.-L.C. provided assistance in designing the study and revised the manuscript; and M.X. and F.-C.Y. designed and supervised the studies, performed the experiments, analyzed data, wrote the manuscript, and are responsible for its final draft.
Conflict-of-interest disclosure: The authors declare no competing financial interests.
Correspondence: Feng-Chun Yang, Department of Pediatrics, Herman B. Wells Center for Pediatric Research, Indiana University School of Medicine, 1044 W Walnut St, R4, Room 427, Indianapolis, IN 46202; e-mail: fyang@iu.edu; or Mingjiang Xu, Department of Pediatrics, Herman B. Wells Center for Pediatric Research, Indiana University School of Medicine, 1044 W Walnut St, R4, Room 119, Indianapolis, IN 46202; e-mail: mx2@iu.edu.

This feature is available to Subscribers Only
Sign In or Create an Account Close Modal