

Abstract
Oncogenic mutations in components of cytokine signaling pathways elicit ligand-independent activation of downstream signaling, enhancing proliferation and survival in acute myeloid leukemia (AML). The myeloproliferative leukemia virus oncogene, MPL, a homodimeric receptor activated by thrombopoietin (THPO), is mutated in myeloproliferative disorders but rarely in AML. Here we show that wild-type MPL expression is increased in a fraction of human AML samples expressing RUNX1-ETO, a fusion protein created by chromosome translocation t(8;21), and that up-regulation of Mpl expression in mice induces AML when coexpressed with RUNX1-ETO. The leukemic cells are sensitive to THPO, activating survival and proliferative responses. Mpl expression is not regulated by RUNX1-ETO in mouse hematopoietic progenitors or leukemic cells. Moreover, we find that activation of PI3K/AKT but not ERK/MEK pathway is a critical mediator of the MPL-directed antiapoptotic function in leukemic cells. Hence, this study provides evidence that up-regulation of wild-type MPL levels promotes leukemia development and maintenance through activation of the PI3K/AKT axis, and suggests that inhibitors of this axis could be effective for treatment of MPL-positive AML.
Introduction
Acute myeloid leukemia (AML) results from mutations in genes associated with proliferation, differentiation, and survival of hematopoietic progenitor cells, including genes encoding transcription factors and cytokine receptors that are essential for normal hematopoietic function. The simplistic but valid model of a multistep pathogenesis of AML proposes that class I mutations provide proliferative and survival advantage, and cooperate with class II mutations that block differentiation.1 The chromosome translocation t(8;21) is a class II mutation found in 10% of AML samples, which breaks and joins the core binding factor (CBF) RUNX1 and ETO genes to create the leukemia fusion gene RUNX1-ETO (also called AML1-ETO; henceforth R1E).2 R1E inhibits differentiation of hematopoietic progenitors and increases survival in vitro.3,4 R1E expression is not sufficient for leukemic transformation in animal models,5 but it induces AML in cooperation with mutations in genes encoding components of cytokine signaling pathways, such as the receptor tyrosine kinases (RTK) c-KIT and FLT3, and their downstream GTPases NRAS and KRAS.6–10
The myeloproliferative leukemia virus oncogene, MPL (also called c-MPL or CD110), is a homodimeric receptor activated by the cytokine thrombopoietin (THPO) that regulates proliferation in hematopoietic stem cells (HSCs) and megakaryocytes.11 Expression of Mpl is found in 70% of HSCs and is markedly reduced on HSC differentiation.12,13 The number and function of HSCs are markedly reduced in Mpl-null and Thpo-null mice.14–16 Self-renewal capacity of long-term HSCs is reduced 10- to 20-fold in Thpo-null recipients, an effect that can be rescued with the addition of recombinant Thpo.17 THPO/MPL signaling regulates the proliferation and maintenance of HSCs and early progenitors via activation of JAK/STAT, ERK/MEK, and PI3K/AKT pathways.11
Mutations identified in human disease also highlight the importance of MPL signaling in homeostasis of the hematopoetic compartment. Nonsense mutations in the MPL and THPO genes cause congenital amegakaryocytic thrombocytopenia, with severe thrombocytopenia and aplastic anemia.18 Somatic activating mutations in MPL cause constitutive JAK2 activation and are associated with myeloproliferative neoplasms, including myelofibrosis with myeloid metaplasia and essential thrombocythemia.19,20 Activating mutations in the MPL gene have been detected in a small fraction of megakaryoblastic AML.21 However, the oncogenic role of wild-type MPL in leukemia is not well understood.
In this study, we used human AML cells and mouse transplantation models to study the role of MPL in R1E leukemia development. These studies show that MPL expression confers an oncogenic signal that cooperates with R1E in initiating and maintaining leukemia. Expression of wild-type MPL expression in t(8;21)–positive cells provides a survival and proliferative advantage via activating the THPO/MPL/PI3K/AKT axis.
Methods
Quantitative RT-PCR analyses
RNA from mouse BM and leukemic cells was extracted with Trizol (Invitrogen). First-strand cDNA was generated by using 2 μg RNA, 1 U Superscript III reverse transcriptase (Invitrogen), and 0.5μM oligo-dT or random hexamer primers in a 20-μL reaction. SYBR Green PCR Master Mix (Applied Biosystems) was used for quantitative PCR according to the manufacturer's instructions. Mpl primers were Mplx1 (5′-ACTTTGATCCAGCGGGTGCT-3′) and Mplx2 (5′-CAGGAAGTCACTGATTTCAG-3′). The β-actin primers were ActbF1 (5′-CGAGGCCCAGAGCAAGAGAG-3′) and ActbR1 (5′-CGGTTGGCCTTAGGGTTCAG-3′). Quantitative PCR was performed in a StepOne Plus Sequence Detection System (Applied Biosystems). Samples were normalized to β-actin transcript levels, and relative values were determined using standard curve or comparative threshold cycle (CT) methods.
Analysis of human AML samples
Expression analysis.
BM leukemia blasts were obtained from 162 patients with AML at diagnosis (classified according to the French-American-British nomenclature), and normal BM specimens were obtained from 6 healthy volunteers. All patients and subjects gave written informed consent in accordance with the Declaration of Helsinki, and approval for these studies was obtained from the Erasmus Medical Ethical Review Committee. Leukemic blasts from AML samples and mononucleated fractions from normal BM specimens were isolated by Ficoll-Hypaque (Nygaard) centrifugation and then cryopreserved. After thawing, cells were washed with HBSS and processed for RNA isolation. AML samples treated according to this procedure usually contain more than 90% blasts after thawing. Total RNA was extracted with guanidium thiocyanate followed by centrifugation in cesium chloride solution. RNA (1 μg) was transcribed into cDNA by using Superscript (Invitrogen) and random hexamers in a 40-μL reaction, under standard conditions. The quantitative PCR amplification was performed in an ABI PRISM 7900 HT Sequence Detector, using 12.5 μL SYBR Green PCR Master Mix (Applied Biosystems), 2 μL (1/20th aliquot) cDNA, 2.5 pmol primer mix (Invitrogen), and 10 μL water. The PCR conditions included 2 minutes at 50°C and 10 minutes at 95°C followed by 45 cycles of amplification (each with a 15-second denaturation step at 95°C and a 1-minute annealing/extension step at 60°C). The MPL primers were hMPLx1 (5′-CCAGCCAGGGGAACTTC-3′) and hMPLx2 (5′-GCTTTGGTCCATCTTGCC-3′).
MPL expression was determined using the assay-on-demand Hs00180489-m1 (Applied Biosystems). To determine MPL relative expression levels, the average CT values from duplicate readings were normalized for endogenous reference (ΔCt = Ct target − Ct PBGD) and compared with a calibrator using the “δδ Ct method” (ΔΔCt = ΔCt sample − ΔCt calibrator). We used the average Ct value of MPL in 6 CD34+ samples from healthy volunteers as a calibrator. The relative expression was calculated (2 − ΔΔCt). Pearson correlation analysis was performed to assess the linear relationship between MPL expression and induction of growth by THPO. Log-transformed data were used for this analysis in order for the 3 variables to be approximately normally distributed.
Mutation analysis.
Microstimulation assay with THPO.
Ficoll-isolated mononuclear cells of the primary AMLs were suspended in IMDM/1% BSA and plated on tissue culture dishes for 1 hour at 37°C. Nonadherent cells were collected, and 2 × 10⁴ cells were stimulated with 100 ng/mL THPO for 3 days. 3H-Thymidine incorporation was measured after an 8-hour incubation period.
Retroviral production
Retroviral constructs included pMSCV-IRES-GFP (MIG) and pMSCV-IRES-humanCD4 (MID). The Mpl cDNA (provided by Harvey Lodish, Massachusetts Institute of Technologies, Cambridge, MA) was subcloned into the MID vector via the BglII and XhoI sites. The R1E cDNA (provided by Peter Westervelt, Washington University, St Louis, MO) and R1E isoform 9a (R1E9a; provided by Dong-Er Zhang, University of California, San Diego, CA) were cloned into the XhoI site of MIG. The PLAGL2 cDNA was cloned into the BglII and XhoI sites of MID. Phoenix packaging cells (provided by Gary Nolan, Stanford University, Stanford, CA) were cotransfected with 2 μg retroviral constructs and 2 μg ψ-Eco packaging plasmid with Effectene reagent (QIAGEN) according to the manufacturer's protocol. Retrovirus supernatants were collected at 48, 56, and 72 hours and titered in NIH3T3 cells by flow cytometric analysis of GFP or hCD4 expression.
BM transplantation experiments
Donor and recipient mice were 4- to 8-week-old 129SvEv strain (Taconic Farms). All mice were treated in accordance with federal and state government guidelines, and the University of Massachusetts Medical School Institutional Animal Care and Use Committee. BM progenitor cells were harvested form mice pretreated with 5-fluorouracil (150 mg/kg intraperitoneal injection), spin-infected twice with retrovirus supernatants, and 5 × 10⁵ to 1 × 10⁶ BM cells transplanted by intravenous injection into 4- to 6-week-old sublethally (650 cGy) or lethally (split dose of 500 cGy) irradiated recipient mice. Mice were observed daily for early signs of leukemia (limited motility, pale paws, and dehydration). Peripheral blood was collected periodically to monitor for the presence of immature cells. Analysis of peripheral blood was performed by flow cytometry, using lineage markers (Lin: Gr1, CD11b, B220, CD3, Ter119, CD71), CD41, and c-kit (BD Biosciences). Flow cytometric analysis of Mpl receptor expression used a polyclonal rabbit anti-Mpl extracellular domain antibody (provided by Wei Tong, University of Pennsylvania, Philadelphia, PA) and a PE-anti–rabbit secondary antibody (BD Biosciences). Staining of peripheral blood smears and spleen sections was ordered from Histoserv. Secondary transplantations used 1 to 5 × 10⁵ GFP(+) sorted MIG-R1E/MID-MPL and MIG-R1E/MID leukemic cells transplanted intravenously into sublethally (650/cGy) irradiated 4- to 6-week-old 129SvEv recipients. For in vivo treatment with Jak2 inhibitor INCB18242, irradiated recipient mice were transplanted with 5 × 10⁵MIG-R1E9a/MID or MIG-R1E9a/MID-Mpl leukemic cells, and treated with oral administration of 90 mg/kg twice a day, starting at day 14 after transplantation. For in vivo treatment with mTOR inhibitor rapamycin, irradiated recipient mice were transplanted with 5 × 10⁵R1E9a/MID or MIG-R1E9a/MID-PL2 leukemic cells and treated with intraperitoneal injections of 0.8 mg/kg rapamycin (Calbiochem), starting at day 7 after transplantation, as previously described.22 Briefly, powdered rapamycin was dissolved in 100% ethanol at 10 mg/mL, aliquoted and frozen at −80°C. Aliquots were prepared daily, by dilution in 5% PEG-400, 5% Tween-80 in water, to a final concentration of 80 μg/mL.
Histology and cytology analyses
Tissue samples (spleen, liver, and tibia) collected from leukemic mice were fixed in 10% buffered formalin, embedded in paraffin, and sectioned specimens were stained with H&E. For cytologic and morphologic analyses, cyto-centrifuged preparations were stained with Wright-Giemsa (Fisher Scientific) according to manufacturer's instructions. Images were acquired using Axioscope 40 camera (Carl Zeiss), AxioCamMRc camera, and MR-Grab software (Carl Zeiss Vision).
Immunoblot analyses
Cryopreserved mouse leukemic cells were thawed and immediately serum starved in RPMI media with 1% BSA for 60 minutes at 37°C (Invitrogen). Cells were then incubated with RPMI media with 0.1% BSA and 0, 1, 2.5, 5, and 10 ng/mL THPO (PeproTech) for 10 minutes. Cells were washed with PBS and resuspended in RIPA buffer with protease-inhibitor cocktail III (Calbiochem). Antibodies included anti–Jak2 (catalog 3230), anti–phospho-Jak2-Tyr221 (catalog 3774), anti–phospho-Stat5-Tyr694 (catalog 9351), anti-Stat5 (catalog 9310), anti–phospho-Akt-Ser273 (catalog 4058), anti-Akt (catalog 9272), anti–phospho-Erk1/2-Thr202/Tyr204 (catalog 9101), anti-Erk1/2 (catalog 9102), and β-actin (catalog 5125), all from Cell Signaling Technology.
In vitro assays of leukemic cells
Apoptosis analysis of mouse leukemic cells in presence of THPO.
R1E/MPL and R1E/MIG leukemic cells were cultured in RPMI medium with 20% FBS, 3 ng/mL IL-3, 10 ng/mL SCF, and 10 ng/mL IL-6 (PeproTech) for 24 hours. Cells (106/mL) were resuspended in serum-free medium (StemSpan-Sfem; StemCell Technologies) and treated with 20 ng/mL THPO (PrepoTech) for 48 hours. Cell proliferation was measured by estimating cell number in treated and untreated live cells using the Trypan blue exclusion method. Apoptotic cells were determined by flow cytometry as annexin V+/7-amino-actinomycin D (7-AAD−) at 48 hours (BD Biosciences PharMingen) according to the manufacturer's instructions. Inhibitors used were 1nM rapamycin (Calbiochem), 0.5μM TG101348 for Jak2 (ChemieTek), 20μM PD98059 for MEK (Invitrogen), and 50nM wortmanin for PI3K (Cell Signaling).
Cell-cycle analysis.
Cell-cycle assay was performed by propidium iodine staining of leukemic cells after 48 hours of treatment and analyzed by flow cytometry. Assays were performed in at least 3 independent leukemic cell samples, each in triplicate. Inhibitors were used as described in “Apoptosis analysis of mouse leukemic cells in presence of THPO.”
Cytokine response of leukemic cells.
A total of 1 × 10⁶ R1E/MPL leukemic cells were treated with single cytokines IL-3 (6 ng/mL), IL-6 (1 ng/mL), SCF (10 μg/mL), THPO (20 ng/mL), or the combination of cytokines, each in triplicate, and proliferation was estimated at 48 hours by CellTiter 96 AQueous One Solution Cell Proliferation Assay kit (catalog G-3580, Promega) according to the manufacturer's instructions.
Statistical analyses
Results
Expression of MPL is increased in t(8;21)–positive human AML samples and promotes proliferation
A previous study determined the gene expression profile in 285 human AML samples.26 The unsupervised clustering defined 16 distinct clusters with similar gene expression signatures. Analysis of this dataset using 3 independent MPL probe sets revealed that the MPL transcript was expressed in a fraction of AML samples across all clusters, with a marked over-representation in a cluster of AML samples with t(8;21) translocation (Figure 1A). This cluster aggregates all samples expressing the leukemia oncogene R1E. These results contrast to the relatively low MPL expression levels in the AML cluster with the chromosome inversion inv(16), which expresses the related CBF fusion leukemia protein CBFβ-SMMHC. To test whether the human AML blasts respond to THPO, the proliferation of 86 AML cells, including 7 t(8;21) samples, was measured in the presence of THPO. Cell proliferation was estimated by 3H-thymidine incorporation in 3-day cultures, and THPO specificity was adjusted by normalizing to the values in the absence of cytokine. This adjustment allows the exclusion of immortalized samples, which expand independently of the presence of cytokines. Compared with no-cytokine controls, THPO induced at least a 3-fold increase in proliferation in approximately 20% of samples (17 of 86; Figure 1B), including 85% (6 of 7) of the t(8;21) samples (Figure 1B black bars) and 0% (0 of 6) of the inv(16) samples (Figure 1B “v” marks). Expression of MPL transcript was determined by quantitative RT-PCR in the 86 AML samples (Figure 1C). MPL expression showed significant correlation with THPO response (R = 0.572; P < .0001), and MPL levels in the 7 t(8;21) samples were significantly higher than that of the 79 t(8;21)–negative samples. The panel of AML samples included 16 subtype M2 samples (French-American-British classification), composing 7 t(8;21) and 9 non-t(8;21) samples.

t(8;21)–positive AML cells express MPL and respond to THPO induction. (A) Expression Correlation View (2856 probe sets) of 285 human AML samples, adapted from Valk et al.26 The 16 clusters identified on the basis of the Correlation View are shown by different colors alongside the Correlation View (1-16). Clusters 9 and 13, aggregating all AML cells with inv(16) and t(8;21), respectively, are indicated by horizontal lines. Expression of MPL (detected by 3 independent probe sets 207550_at, 211903_s_at, 216825_s_at) is plotted in the latter 3 columns in which the bars are proportional to the MPL expression level. (B) Relative proliferation levels of 86 human AML cells in response to THPO as single cytokine. Samples were incubated with THPO or PBS for 3 days, and proliferation was tested by 3H-thymidine incorporation. The fold increase in proliferation with THPO was normalized to that without cytokine and ordered by increasing response. Samples carrying t(8;21) translocation (black bar) and inv(16) rearrangement (“v” mark) are shown. (C) MPL transcript levels determined by quantitative RT-PCR in human AML samples that were subjected to proliferation assays. The MPL levels are the average of duplicate values and relative to the average value of 6 healthy CD34+ BM samples (REL). Correlation between MPL expression and THPO response was performed by R statistics (R = 0.572, P < .001).
t(8;21)–positive AML cells express MPL and respond to THPO induction. (A) Expression Correlation View (2856 probe sets) of 285 human AML samples, adapted from Valk et al.26 The 16 clusters identified on the basis of the Correlation View are shown by different colors alongside the Correlation View (1-16). Clusters 9 and 13, aggregating all AML cells with inv(16) and t(8;21), respectively, are indicated by horizontal lines. Expression of MPL (detected by 3 independent probe sets 207550_at, 211903_s_at, 216825_s_at) is plotted in the latter 3 columns in which the bars are proportional to the MPL expression level. (B) Relative proliferation levels of 86 human AML cells in response to THPO as single cytokine. Samples were incubated with THPO or PBS for 3 days, and proliferation was tested by 3H-thymidine incorporation. The fold increase in proliferation with THPO was normalized to that without cytokine and ordered by increasing response. Samples carrying t(8;21) translocation (black bar) and inv(16) rearrangement (“v” mark) are shown. (C) MPL transcript levels determined by quantitative RT-PCR in human AML samples that were subjected to proliferation assays. The MPL levels are the average of duplicate values and relative to the average value of 6 healthy CD34+ BM samples (REL). Correlation between MPL expression and THPO response was performed by R statistics (R = 0.572, P < .001).
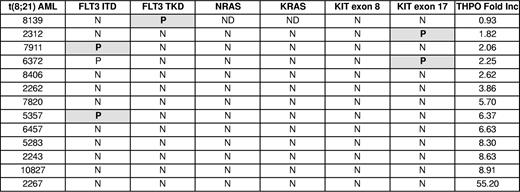
To assess the correlation between response to THPO and the presence of RTK mutations in t(8;21) AML cells, mutation analysis for FLT3, NRAS, KRAS, and KIT genes was performed in 13 t(8;21) AML samples. Eight of the 13 samples were wild-type for these genes (Table 1). A sample with low THPO response (sample 6372) had 2 RTK mutations, FLT3ITD and KITex17, confirming previous observations that more than one RTK mutation may be present in a sample.10 Together, the analysis of human AML samples suggests that the leukemic blasts expand in the presence of THPO/MPL signaling and that this effect is preferentially present in RUNX1-ETO expressing samples.
Mpl cooperates with R1E in AML development in mice
Next, we determine whether up-regulation of Mpl expression synergized with R1E in leukemia development in mice. Leukemic cells with t(8;21) express 2 isoforms of R1E fusion transcript: the full-length (R1E) and a truncated isoform RUNX1-ETO9a (R1E9a) missing the C-terminal exons and inducing more aggressive leukemia in mice.27 To test the role of Mpl in leukemia, BM cells were cotransduced with either MIG-R1E or MIG-R1E9a, and either MID or MID-MPL retroviruses (Figure 2A), sorted for GFP to minimize a putative erythroid phenotype caused by cells transduced with Mpl but not with R1E (see below), and transplanted into irradiated isogenic recipients.

MPL cooperates with RUNX1-ETO in leukemia development in mice. (A) Experimental design. Top: diagram of retroviral constructs used in the transplantation experiment. Bottom: the transduction-transplantation assay. BM cells (circles) harvested from wild-type mice are cotransduced with MIG-R1E, MIG-R1E9a, or MIG, and MID or MID-Mpl retroviruses were GFP-sorted and transplanted into irradiated recipient mice. (B) Kaplan-Meier plot showing the survival of mice transplanted with BM cells transduced with MIG-R1E/MID-MPL (dashed line/circle, n = 5), MIG-R1E9a/MID-MPL (solid line, circle; n = 12), MIG-R1E9a/MID (solid line, open circle; n = 11), MIG-R1E/MID (dashed line, open circle; n = 8), MID-MPL (dotted line, circle; n = 4), and MID (dotted line; n = 4); mice were followed for 210 days (experimental endpoint). (C) Kaplan-Meier survival curve of secondary transplants from MIG-R1E/MID-MPL (dashed line; n = 5), MIG-R1E9a/MID (solid line, circle; n = 3) leukemic cells, and MID-MPL BM (dotted line; n = 4). (D) Kaplan-Meier survival curve of secondary transplantations with MIG-R1E9a/MID (left; n = 6) and MIG-R1E/MID-MPL (right line; n = 6) leukemic cells, treated with vehicle (dashed line) or INCB18242 (solid line), from day 14 after transplantation (arrow).
MPL cooperates with RUNX1-ETO in leukemia development in mice. (A) Experimental design. Top: diagram of retroviral constructs used in the transplantation experiment. Bottom: the transduction-transplantation assay. BM cells (circles) harvested from wild-type mice are cotransduced with MIG-R1E, MIG-R1E9a, or MIG, and MID or MID-Mpl retroviruses were GFP-sorted and transplanted into irradiated recipient mice. (B) Kaplan-Meier plot showing the survival of mice transplanted with BM cells transduced with MIG-R1E/MID-MPL (dashed line/circle, n = 5), MIG-R1E9a/MID-MPL (solid line, circle; n = 12), MIG-R1E9a/MID (solid line, open circle; n = 11), MIG-R1E/MID (dashed line, open circle; n = 8), MID-MPL (dotted line, circle; n = 4), and MID (dotted line; n = 4); mice were followed for 210 days (experimental endpoint). (C) Kaplan-Meier survival curve of secondary transplants from MIG-R1E/MID-MPL (dashed line; n = 5), MIG-R1E9a/MID (solid line, circle; n = 3) leukemic cells, and MID-MPL BM (dotted line; n = 4). (D) Kaplan-Meier survival curve of secondary transplantations with MIG-R1E9a/MID (left; n = 6) and MIG-R1E/MID-MPL (right line; n = 6) leukemic cells, treated with vehicle (dashed line) or INCB18242 (solid line), from day 14 after transplantation (arrow).
Mice transplanted with R1E/Mpl and R1E9a/Mpl cells (ie, transduced with either MIG-R1E or MIG-R1E9a and MID-Mpl) developed fully penetrant leukemia with a median latency of 50 days (Figure 2B, solid and dashed lines/circle marks). Conversely, mice transplanted with cells expressing R1E alone (dashed line) did not develop leukemia up to 168 days (experimental endpoint), and mice transplanted with cells expressing R1E9a alone developed leukemia with longer latency (median latency = 140 days; Figure 2B, solid line/open circle mark). Control mice transplanted with cells expressing Mpl or MID (dotted lines) remained healthy during the duration of the experiment. Furthermore, 8 × 10⁴ GFP(+)hCD4(+) leukemic cells from MIG-R1E/MID-MPL and MIG-R1E9a/MID mice transplanted into sublethally irradiated recipients induced fully penetrant leukemia with a median latency of 25 and 60 days, respectively (Figure 2C, dash and solid lines). Expression of R1E was consistently present in leukemic cells as assessed by GFP expression (using flow cytometric analysis) and R1E protein expression (using Western blot analysis; supplemental Figure 1, available on the Blood Web site; see the Supplemental Materials link at the top of the online article). To test whether MIG-R1E/MID-Mpl leukemia is dependent on Mpl signaling, secondary transplantation assays were performed using MIG-R1E9a/MID and MIG-R1E9a/MID-Mpl leukemic cells into irradiated recipients (n = 6 per group) and treated with vehicle or with the Jak2 inhibitor INCB018242.28 The latency of leukemia in mice transplanted with MIG-R1E9a/MID leukemic cells was similar between vehicle and treated groups (latency: 21 days, range, 19-22 days; Figure 2D left), and fully penetrant. The latency of leukemia in mice transplanted with MIG-R1E9a/MID-Mpl leukemic cells, expressing Mpl, was 21 days (range, 19-23 days) when treated with vehicle, whereas it was delayed to 28 days (range, 26-31 days) when treated with INCB018242 (Figure 2D right).
The pathology of leukemia was similar among the R1E groups. The peripheral blood of sick mice revealed a consistent increase in white blood cell count (WBC > 18 ± 7 × 10⁶ cells/mL; normal WBC count = 4 ± 2 × 10⁶ cells/mL) and increased presence of immature leukocyte morphologies (Figure 3A-B). A significant fraction of cells in BM and peripheral blood expressed both R1E and Mpl (30%-60% of cells). The immunophenotype observed in MIG-R1E/MID-Mpl and MIG-R1E/MID leukemic cells was predominantly c-kit(+) and lineage (CD41, CD3, B220, Mac1, Gr1, Ter119) negative (Figure 3C). Leukemic mice from the MIG-R1E9a/MID, MIG-R1E9a/MID-Mpl, and MIG-R1E/MID-Mpl mice exhibited splenomegaly (data not shown), with a marked disruption in splenic architecture (Figure 3D). Recipient mice transplanted with MID-Mpl transduced BM did not develop leukemia. However, these mice exhibited a transient expansion of hCD4(+) cells and erythroid progenitors. Time-course analysis of peripheral blood revealed the gradual increase of erythroid progenitors, with hCD4(+)c-kit(−)Ter119(low) peaking at 40 days after transplantation and gradually decreasing to be undetectable by 168 days (Figure 3E). These cells were not transplantable in secondary recipients (Figure 2C dotted line). Together, these studies suggest that expression of wild-type Mpl induces transient erythroid expansion, and in the presence of R1E, acts as a synergistic oncogenic signal in the development of leukemia in mice.

Pathology of RUNX1-ETO/MPL myeloid leukemia. (A) Quantification of peripheral blood WBCs from recipient mice expressing MID-Mpl, MIG-R1E9a/MID-MIG, MIG-R1E9a/MID-Mpl, and MIG-R1E/MID-Mpl. Individual values (triangle) and mean (line) are represented. (B) Representative immature cells detected in peripheral blood of MIG-R1E/MID-Mpl (left) and MIG-R1E-MID (right) leukemic mice; original magnification 100×. (C) Representative flow cytometric analysis of GFP(+)/hCD4(+) gated peripheral blood from MIG-R1E9a/MID (top) and MIG-R1E9a/MID-Mpl (bottom) leukemic mice, for lineage (CD41, CD3 B220, Mac1, Gr1, and Ter119) and leukemic cell marker (c-kit). (D) Spleen cross sections showing the architecture of wild-type (wt; 16 weeks old) spleen, and MIG-R1E9a/MID-Mpl (14 weeks old), and MIG-R1E/MID (26 weeks old) spleens from leukemic mice (original magnification ×50). (E) Time course analysis of erythroid progenitors in peripheral blood of recipients transduced with MID-Mpl (n = 8). The percentage of donor cells hCD4(+) cells expressing Mpl (left) and Ter119(+) (right) cells.
Pathology of RUNX1-ETO/MPL myeloid leukemia. (A) Quantification of peripheral blood WBCs from recipient mice expressing MID-Mpl, MIG-R1E9a/MID-MIG, MIG-R1E9a/MID-Mpl, and MIG-R1E/MID-Mpl. Individual values (triangle) and mean (line) are represented. (B) Representative immature cells detected in peripheral blood of MIG-R1E/MID-Mpl (left) and MIG-R1E-MID (right) leukemic mice; original magnification 100×. (C) Representative flow cytometric analysis of GFP(+)/hCD4(+) gated peripheral blood from MIG-R1E9a/MID (top) and MIG-R1E9a/MID-Mpl (bottom) leukemic mice, for lineage (CD41, CD3 B220, Mac1, Gr1, and Ter119) and leukemic cell marker (c-kit). (D) Spleen cross sections showing the architecture of wild-type (wt; 16 weeks old) spleen, and MIG-R1E9a/MID-Mpl (14 weeks old), and MIG-R1E/MID (26 weeks old) spleens from leukemic mice (original magnification ×50). (E) Time course analysis of erythroid progenitors in peripheral blood of recipients transduced with MID-Mpl (n = 8). The percentage of donor cells hCD4(+) cells expressing Mpl (left) and Ter119(+) (right) cells.
Expression of endogenous Mpl by PlagL2 cooperates with R1E in leukemia
Retrovirus-induced overexpression of Mpl could create nonspecific activation of cellular pathways. Therefore, we tested whether Mpl would induce leukemia if it was activated endogenously. In these studies, we used PlagL2 (PL2), a transcription factor that activates Mpl transcript expression in hematopoietic cells.29
BM cells were cotransduced with MIG-R1E and MID-PL2 retroviruses and transplanted into isogenic irradiated recipients (Figure 4A). Control groups transplanted with MIG or MID-PL2 BM did not develop leukemia (Figure 4B solid line). Recipient mice carrying MIG-R1E/MID-PL2 cells developed fully penetrant leukemia with a median latency of 11 weeks (range, 8-17 weeks; n = 12; Figure 4B dotted line). In contrast, only 18% (2 of 11) of mice carrying MIG-R1E/MID cells developed leukemia after longer latency (median latency = 20 weeks; Figure 4B, dashed line). The leukemia phenotype was similar to that observed in MIG-R1E/MID-Mpl leukemias. These included efficient secondary transplantation of MIG-R1E/MID-PL2 leukemia into sublethally irradiated recipient mice (Figure 4B long dashed lines) and splenomegaly (data not shown). The leukemic cells in peripheral blood were GFP(+)c-kit(+), and analysis of circulating leukemic blasts gated for c-kit(+) showed that these cells were hCD4(+) and expressed the Mpl receptor on the cell surface (Figure 4C). The immunophenotype of MIG-R1E/MID-PL2 leukemic cells was mostly c-kit(+)Lin(−), and a small fraction of the cells were Gr1(low)Mac1(low) (Figure 4D). These findings suggest that activation of endogenous Mpl mimics Mpl retroviral expression in cooperation with R1E to induce leukemia.

Endogenous Mpl activated by PL2 induces AML in cooperation with R1E in mice. (A) Experimental design. Top: schematic representation of retroviral constructs used in the transplantation assay. Bottom: the transduction-transplantation assay. BM cells (circles) harvested from wild-type mice are cotransduced with either MIG or MIG-R1E and MID or MID-PL2 retroviruses, and transplanted into 4- to 8-week-old irradiated recipient mice. (B) Kaplan-Meier plot showing survival curve of mice transplanted with MIG-R1E/MID-PL2 (dotted line; n = 11), MIG-R1E/MID (short dashed line; n = 12), MIG/MID-PL2 (gray line; n = 8), and MIG (solid line, n = 8) transduced BM cells; secondary transplantations of MIG-R1E/MID-PL2 leukemic cells (long dashed line; n = 12); experimental end point: 24 weeks. (C) Flow cytometric analysis of hCD4 (cells expressing PL2) and Mpl receptor expression in GFP-gated peripheral blood leukemic cells from MIG-R1E/MID-PL2 (top) and MIG-R1E/MID (bottom) mice compared with untransduced cells (gray shaded). (D) Flow cytometric analysis of the expression of lineage and c-kit markers in (GFP(+)hCD4(+)–gated cells from MIG-R1E/MID-PL2 mice.
Endogenous Mpl activated by PL2 induces AML in cooperation with R1E in mice. (A) Experimental design. Top: schematic representation of retroviral constructs used in the transplantation assay. Bottom: the transduction-transplantation assay. BM cells (circles) harvested from wild-type mice are cotransduced with either MIG or MIG-R1E and MID or MID-PL2 retroviruses, and transplanted into 4- to 8-week-old irradiated recipient mice. (B) Kaplan-Meier plot showing survival curve of mice transplanted with MIG-R1E/MID-PL2 (dotted line; n = 11), MIG-R1E/MID (short dashed line; n = 12), MIG/MID-PL2 (gray line; n = 8), and MIG (solid line, n = 8) transduced BM cells; secondary transplantations of MIG-R1E/MID-PL2 leukemic cells (long dashed line; n = 12); experimental end point: 24 weeks. (C) Flow cytometric analysis of hCD4 (cells expressing PL2) and Mpl receptor expression in GFP-gated peripheral blood leukemic cells from MIG-R1E/MID-PL2 (top) and MIG-R1E/MID (bottom) mice compared with untransduced cells (gray shaded). (D) Flow cytometric analysis of the expression of lineage and c-kit markers in (GFP(+)hCD4(+)–gated cells from MIG-R1E/MID-PL2 mice.
Mpl expression is not regulated by R1E in mouse hematopoietic progenitor and leukemic cells
Considering that MPL expression is increased in a fraction of t(8;21) AML samples and that MPL has been reported as a direct core binding factor (CBF) target in HSCs and megakaryocytes,30,31 we determined whether R1E could upregulate transcript and protein Mpl expression in mice. Levels of Mpl transcript were tested in cDNA from BM cells transduced with either MIG, MIG-R1E, or MID-PL2 retroviruses, and sorted for GFP or hCD4 markers, using qRT-PCR. Mpl levels were similar between the MIG and MIG-R1E groups, and increased 3-fold in MID-PL2–transduced BM cells (Figure 5A). Expression of Mpl transcript in MIG-R1E/MID leukemic cells was 125-fold lower than in MIG-R1E/MID-PL2 leukemic cells (Figure 5B). Mpl levels in MIG-R1E/MID-MPL leukemic cells were 4.8-fold higher than in MIG-R1E/MID-PL2 cells. Cell-surface expression of Mpl in Lin(-) BM cells was tested 24 hours after transduction with MID-Mpl, MIG, or MIG-R1E retroviruses. Mpl was detected on the cell surface of BM cells transduced with MID-Mpl but not in BM cells transduced with MIG or MIG-R1E retroviruses (Figure 5C). Cell-surface expression of Mpl was also tested in GFP(+)-gated MIG-R1E9a/MID and MIG-R1E9a/MID-MPL leukemic cells. Mpl levels in MIG-R1E9a/MID leukemic cells were similar to untransduced controls, but increased in MIG-R1E9a/MID-MPL cells (Figure 5D) left and center panels). Mpl levels between GFP(+)-gated samples are shown in Figure 5D right panel. Together, these results suggest that Mpl levels are not induced by R1E in hematopoietic progenitors and leukemic cells in mice.

The expression of Mpl is not regulated by R1E. (A) Relative expression levels (REL) of Mpl transcript in cDNA from GFP(+)-sorted BM progenitors transduced with MIG, MID-PL2, or MIG-R1E, using qRT-PCR and normalized to the average of MIG sample; experiments were performed in triplicate. (B) Relative expression levels (REL) of Mpl transcript in cDNA from GFP(+)-sorted MIG-R1E/MID-PL2, MIG-R1E/MID-MPL, and MIG-R1E/MID (n = 3) leukemic cells, using qRT-PCR and normalized to MIG-R1E/MID-Pl2; experiments were performed in triplicate. (C) Epression of Mpl in cell surface of hCD4(+)- or GFP(+)-gated Lin(−) BM cells pretransduced with MID-MPL (left), MIG (middle left), and MIG-R1E (middle right) retroviruses was determined by flow cytometry, and compared with untransduced BM cells (gray shaded). Mpl ecpression in transduced cells is shown in left panel. (D) Expression of MPL in cell surface of GFP(+) MIG-R1E9a/MID (n = 2, left panels) and MIG-R1E/MID-MPL (n = 2, middle panels) leukemic cells was determined by flow cytometry, and compared with untransduced BM cells (gray shaded). Mpl expression in transduced cells is shown in left panel.
The expression of Mpl is not regulated by R1E. (A) Relative expression levels (REL) of Mpl transcript in cDNA from GFP(+)-sorted BM progenitors transduced with MIG, MID-PL2, or MIG-R1E, using qRT-PCR and normalized to the average of MIG sample; experiments were performed in triplicate. (B) Relative expression levels (REL) of Mpl transcript in cDNA from GFP(+)-sorted MIG-R1E/MID-PL2, MIG-R1E/MID-MPL, and MIG-R1E/MID (n = 3) leukemic cells, using qRT-PCR and normalized to MIG-R1E/MID-Pl2; experiments were performed in triplicate. (C) Epression of Mpl in cell surface of hCD4(+)- or GFP(+)-gated Lin(−) BM cells pretransduced with MID-MPL (left), MIG (middle left), and MIG-R1E (middle right) retroviruses was determined by flow cytometry, and compared with untransduced BM cells (gray shaded). Mpl ecpression in transduced cells is shown in left panel. (D) Expression of MPL in cell surface of GFP(+) MIG-R1E9a/MID (n = 2, left panels) and MIG-R1E/MID-MPL (n = 2, middle panels) leukemic cells was determined by flow cytometry, and compared with untransduced BM cells (gray shaded). Mpl expression in transduced cells is shown in left panel.
THPO/MPL signaling activates survival pathway in leukemic cells expressing Mpl
Activation of the MPL receptor by its ligand, THPO, in hematopoietic progenitors induces the phosphorylation of JAK2 and subsequent anti–apoptotic and proliferative response via activation of PI3K/AKT, STAT5, and MEK/ERK pathways (reviewed in Kaushansky and Ranney11 ). To determine the role of downstream signal activation by Mpl in leukemic cells, we tested phosphorylation levels of Jak2, Stat5, Akt1, and Erk1/2 in MIG-R1E/MID (not expressing Mpl) and MIG-R1E/MID-Mpl leukemic cells after exposure to Thpo. MIG-R1E/MID-Mpl cells showed dose-dependent activation of Jak2, Stat5, Akt, and Erk1/2 signaling at low Thpo concentrations (1-10 ng/mL range; Figure 6A). Similar results were observed using MIG-R1E/MID versus MIGR1E/MID-PL2 cells (data not shown). Changes in phosphorylation of Stat5, Akt, S6R, and Erk1/2 were also tested in vivo, using leukemic cells harvested from mice that have been transplanted with MIG-R1E9a/MID and MIG-R1E9a/MID-MPL leukemic cells and treated with vehicle or the Jak1/2 inhibitor INCB018242, as described in Figure 2C. Intracellular flow cytometric phosphorylation analysis showed increased phosphorylation of these proteins in MIG-R1E9a/MID-MPL cells, which was reduced in mice treated with the Jak2 inhibitor (supplemental Figure 2). The sensitivity of mTor regulated S6R phosphorylation by INCB018242 in vivo suggested that Thpo/Mpl signaling may function in leukemic cell survival via PI3K/Akt/mTor axis. To test this possibility, apoptosis was determined in MIG-R1E9a/MID and MIG-R1E9a/MID-MPL leukemic cells after treatment with rapamycin (Figure 6B). Thpo significantly reduced apoptosis (P < .01, Student t test) in MIG-R1E9a/MID-MPL (expressing Mpl), but not in MIG-R1E9a/MID leukemic cells. This effect was inhibited in the presence of the mTor inhibitor rapamycin.

Leukemic cells expressing R1E and Mpl are sensitive to THPO signaling through Jak2/Pi3k/Akt. (A) Western blot analysis of signaling proteins activated by Mpl. MIG-R1E/MID (not expressing Mpl) and MIG-R1E/MID-MPL leukemic cells were stimulated with 0, 1, 2.5, 5, and 10 ng/mL THPO after serum starvation. Expression of phospho-Jak2, Jak2, phospho-Stat5, Stat5, phospho-Akt1, Akt1, phospo-Erk1/2, and Erk1/2 was tested by immunoblot analysis. (B) Apoptosis analysis (annexin V(+), 7-AAD-) of MIG-R1E/MID-MPL and MIG-R1E/MID leukemic cells estimated after 48-hour treatment with PBS (black), Thpo (gray), or Thpo and rapamycin (white); P < .01 (*), Student t test). (C) Apoptosis analysis (annexin V(+), 7-AAD-) of MIG-R1E/MID-MPL leukemic cells estimated after 48-hour treatment with PBS (white) or Thpo (black) with pretreatment of no inhibitor (none) or inhibitors for mTor (rapamycin), PI3K (wortmanin), Jak2 (TG101348), and MEK (PD98059). Experiments were performed in quadruplicate; P < .001 (*), Student t test. (D) Cell-cycle analysis (propidium-iodine staining) of MIG-R1E9a/MID-MPL treated as in panel C; subG1 (gray), G0/1 cells (dark gray), S phase cells (white), and G2/M cells (black); P < .001 Student t test), (*). (E) Proliferation assays of MIG-R1E/MID-MPL leukemic cells after 48-hour culture with IL-3 (6 ng/mL), IL-6 (1 ng/mL), SCF (10 μg/mL), Thpo (20 ng/mL), or the combination of cytokines; each in triplicate. P < .001 (*), Student t test. (F) Kaplan-Meier survival curve of transplantations of MIG-R1E9a/MID-PL2 (left) and MIG-R1E9a/MID (right) leukemic cells in mice injected with mTOR inhibitor rapamycin (solid line, n = 8) or vehicle (dashed line, n = 8). P < .0001 log-rank test.
Leukemic cells expressing R1E and Mpl are sensitive to THPO signaling through Jak2/Pi3k/Akt. (A) Western blot analysis of signaling proteins activated by Mpl. MIG-R1E/MID (not expressing Mpl) and MIG-R1E/MID-MPL leukemic cells were stimulated with 0, 1, 2.5, 5, and 10 ng/mL THPO after serum starvation. Expression of phospho-Jak2, Jak2, phospho-Stat5, Stat5, phospho-Akt1, Akt1, phospo-Erk1/2, and Erk1/2 was tested by immunoblot analysis. (B) Apoptosis analysis (annexin V(+), 7-AAD-) of MIG-R1E/MID-MPL and MIG-R1E/MID leukemic cells estimated after 48-hour treatment with PBS (black), Thpo (gray), or Thpo and rapamycin (white); P < .01 (*), Student t test). (C) Apoptosis analysis (annexin V(+), 7-AAD-) of MIG-R1E/MID-MPL leukemic cells estimated after 48-hour treatment with PBS (white) or Thpo (black) with pretreatment of no inhibitor (none) or inhibitors for mTor (rapamycin), PI3K (wortmanin), Jak2 (TG101348), and MEK (PD98059). Experiments were performed in quadruplicate; P < .001 (*), Student t test. (D) Cell-cycle analysis (propidium-iodine staining) of MIG-R1E9a/MID-MPL treated as in panel C; subG1 (gray), G0/1 cells (dark gray), S phase cells (white), and G2/M cells (black); P < .001 Student t test), (*). (E) Proliferation assays of MIG-R1E/MID-MPL leukemic cells after 48-hour culture with IL-3 (6 ng/mL), IL-6 (1 ng/mL), SCF (10 μg/mL), Thpo (20 ng/mL), or the combination of cytokines; each in triplicate. P < .001 (*), Student t test. (F) Kaplan-Meier survival curve of transplantations of MIG-R1E9a/MID-PL2 (left) and MIG-R1E9a/MID (right) leukemic cells in mice injected with mTOR inhibitor rapamycin (solid line, n = 8) or vehicle (dashed line, n = 8). P < .0001 log-rank test.
Next, we asked whether Jak2, Pi3k/Akt, or Mek/Erk activated signals act on the survival and proliferation of leukemic cells expressing Mpl. Apoptosis analysis of MIG-R1E/MID-MPL leukemic cells revealed that Thpo treatment significantly reduced apoptosis compared with vehicle-treated cells (40%-20%, P < .001; Figure 6C). Thpo-mediated antiapoptotic function was blocked by inhibitors for Jak2 (TG101348), PI3K (wortmanin), and mTor (rapamycin), but not with MEK inhibitor (PD98059). The block in PI3K-mediated survival was also found when using PI3K inhibitor LY294002 (data not shown). Cell-cycle analysis of these cells showed that Thpo significantly reduced the sub-G0/1 cell fraction, similar to untreated cells, and this reduction was blocked after treatment with Jak2, PI3K, and mTor inhibitors (Figure 6D).
We asked whether MIG-R1E/MID-MPL leukemic cells would respond to other cytokines. Proliferation of primary R1E/MPL leukemic cells in the presence of IL-3, IL-6, SCF, or THPO as a single cytokine and with the combination of the 4 cytokines showed that THPO was the predominant factor driving proliferation of these cells (Figure 6E). The cells also responded to IL-3, but not to IL-6 or SCF.
Finally, the role of the Akt/mTor pathway was tested in transplantation assays using rapamycin (Figure 6F). Recipient mice were transplanted with MIG-R1E/MID-PL2 or MIG-R1E9a/MID leukemic cells and administered daily injections of vehicle or rapamycin. MIG-R1E/MID-PL2 mice treated with vehicle died with leukemia with a median latency of 30 days (range, 28-38 days), whereas rapamycin-treated mice showed a significant delay in disease latency (P < .0001, log-rank test) and incomplete penetrance (Figure 6F left). MIG-R1E9a/MID mice treated with vehicle or with rapamycin showed a similar median latency of 20 days and complete penetrance (Figure 6F right).
Together, these results show that Mpl-expressing leukemic cells activate THPO/MPL signaling, and suggest that the Jak2/PI3K/Akt1/mTor signaling axis is a critical component on the Mpl-mediated survival response in leukemic cells expressing wild-type MPL.
Discussion
The regulation of cytokine signaling modulates proliferation, differentiation, and survival of HSCs and progenitor cells. Components of these pathways are prime targets of mutations in leukemia initiation, dysregulating their proliferative and survival functions.32 Patients with AML frequently present mutations in genes encoding components of RTK pathways. In this study, we show that increased expression of the wild-type THPO receptor MPL acts as an oncogenic signal, activating proliferative and survival pathways, and cooperates with the fusion protein R1E in the initiation and maintenance of leukemia.
Our study shows that human t(8;21) AML cells frequently proliferate in response to THPO and express MPL. We also show that expression of Mpl transcript and Mpl receptor in membrane is not regulated by R1E in murine progenitor and leukemic cells. These results strongly suggest functional synergy between the 2 signals in leukemogenesis, rather than a direct regulation. Hematopoietic blasts expressing R1E have increased self-renewal in vitro and impaired differentiation capacity5 and can remain as preleukemic cells in the asymptomatic stage for years before triggering leukemia transformation in cooperation with other mutations.33,34 Because R1E also increases DNA damage,35,36 subclones of the preleukemic cells expressing increased MPL levels probably gain selective advantage to proliferate and survive in response to THPO, thereby promoting leukemia transformation. Based on our studies, we cannot rule out mouse/human species differences in Mpl regulation. But either as a direct target or as a cooperative mutation, the synergistic effect of R1E and THPO/MPL in leukemia induction, both in mouse and human cells, is clear. Interestingly, we observed that some THPO-responsive AML samples expressed relatively low levels of MPL transcript. Assuming that MPL is the only THPO receptor, it is possible that sensitivity to THPO signaling could also result from MPL posttranscriptional regulation of MPL, such as deregulation of internalization and degradation of the receptor.37,38
The simplistic but valid model of a multistep pathogenesis of AML proposes that class I mutations provide proliferative and survival advantage and cooperate with class II mutations that block differentiation, such as R1E.1 Our results demonstrate that MPL expression acts as a class I oncogenic signal that initiates leukemia in cooperation with class II mutations in mice. The MPL gene can have oncogenic mutations or be expressed at higher levels in myeloproliferative disorders.39 Here we show that overexpression of wild-type Mpl induces a transient erythroid expansion but is not sufficient to induce leukemia. The levels of Mpl induced by PlagL2 did not induce erythroid expansion, consistent with the idea that high Mpl levels may induce proliferation, whereas lower Mpl expression only induces a survival signal. We used 2 approaches to test the role of Mpl in leukemia development: retroviral transduction to induce Mpl expression and activation of endogenous Mpl levels by expression of the Mpl-regulator PlagL2. Although PlagL2 is also expected to activate other genes in BM progenitors, both approaches shows similar activation of signals downstream of Thpo, supporting the idea that Mpl activation is a major target of PlagL2 in leukemia development. In leukemic blasts, the expression of MPL receptor on the cell membrane may be originating from other transcription factors or by other mechanisms during the biosynthesis, trafficking, recycling, and degradation of MPL.40
As a class I mutation, THPO/MPL activated signaling may be functionally redundant with other RTK mutations, and the t(8;21) AML cases analyzed with MPL expression analyzed showed a correlation to the absence of other known class I mutations. Activation of MPL elicits proliferative and prosurvival functions in HSCs and megakaryocytes through activation of PI3K/AKT/mTOR, MEK/ERK, and JAK/STAT cascades.40 The MPL receptor lacks intrinsic tyrosine kinase activity, unlike other members of the cytokine receptor superfamily. Thpo/Mpl-mediated phosphorylation of Jak2 is critical for Mpl phosphorylation and activation. Incubation of MIG-R1E/MID-MPL leukemic cells with THPO induced phosphorylation of Jak2. These cells were also sensitive to THPO-mediated phosphorylation of AKT1, ERK1/2, and STAT5, suggesting that these signals can direct the survival and proliferation response. Inhibition of the Pi3k/Akt pathway (but not Mek/Erk) abrogated the THPO-mediated survival in vitro, and treatment of recipient mice with leukemic cells expressing R1E and Mpl, but not R1E, with the mTOR inhibitor rapamycin significantly reversed survival function of Mpl, and delayed leukemia development in mice. We propose that the PI3K/AKT/mTOR pathway plays a critical role in the initiation and maintenance of leukemia mediated by THPO/MPL.
Our findings suggest that inclusion of JAK2 and PI3K/AKT/mTor signaling inhibitors may be beneficial in treatment of t(8:21)-positive AML cells expressing MPL. In addition, future in vivo studies should focus on the characterization of the R1E/MPL expressing leukemia-initiating cells, which may reside in the expanded stem cell compartment,41,42 or in the myeloid compartment, as has been shown for the CBF-associated leukemia fusion protein CBFβ-SMMHC.43 Finally, our observation that MPL is also expressed in a fraction of AML without R1E suggests that targeting THPO/MPL signaling may be of therapeutic value for AML cases expressing MPL.
There is an Inside Blood commentary on this article in this issue.
The online version of this article contains a data supplement.
The publication costs of this article were defrayed in part by page charge payment. Therefore, and solely to indicate this fact, this article is hereby marked “advertisement” in accordance with 18 USC section 1734.
Acknowledgments
The authors thank the members of the L.H.C. laboratory for technical assistance and valuable discussion of the manuscript, the members of the bone marrow transplantation facility of the Erasmus University Medical Center for technical assistance, Ross Levine for providing INCB018242, Wei Tong for providing the antibody for Mpl, Peter Westervelt for providing the RUNX1-ETO cDNA, Dong-Er Zhang for providing the cDNA for RUNX1-ETO9a, and Harvey Lodish for providing the MPL cDNA.
This work was supported by the National Institutes of Health (NIH; grant CA096983, L.H.C.) and the Dutch Cancer Society Koningin Wilhelmina Fonds (P.V.). Core resources were supported in part by the University of Massachusetts Diabetes Endocrinology Research Center (grant DK32520) and Center for AIDS Research (P30AI042845). L.H.C. is the recipient of a Scholar Award from the Leukemia & Lymphoma Society (grant 1334-08). P.B. was supported by the NIH (grant T32 CA130807).
National Institutes of Health
Authorship
Contribution: J.A.P. and D.M. led the design and execution of the experiments; S.F.L., Y.-H.K., S.A., L.X., P.V., and P.B. contributed to the research and manuscript preparation; L.J.Z. performed the statistical analyses; and L.H.C. led the experimental design, discussion of results, and writing of the manuscript.
Conflict-of-interest disclosure: The authors declare no competing financial interests.
The current affiliation for S.F.L. is Yale University School of Medicine, New Haven, CT. The current affiliation for Y.-H.K. is Beckman Research Institute at City of Hope Medical School, Duarte, CA. The current affiliation for D.M. is National Institutes of Health, Bethesda, MD.
Correspondence: Lucio Hernán Castilla, Program in Gene Function and Expression, University of Massachusetts Medical School, 364 Plantation St, Worcester, MA 01605; e-mail: lucio.castilla@umassmed.edu.

This feature is available to Subscribers Only
Sign In or Create an Account Close Modal