Key Points
Effects of gene therapy were stable up to 11 years, but with variable outcomes based on the levels of engrafted, gene-corrected stem cells.
Integration site analyses showed some prominent clones with integrants near proto-oncogenes, but no clinically significant clonal outgrowth.

Abstract
Patients lacking functional adenosine deaminase activity have severe combined immunodeficiency (ADA SCID), which can be treated with ADA enzyme replacement therapy (ERT), allogeneic hematopoietic stem cell transplantation (HSCT), or autologous HSCT with gene-corrected cells (gene therapy [GT]). A cohort of 10 ADA SCID patients, aged 3 months to 15 years, underwent GT in a phase 2 clinical trial between 2009 and 2012. Autologous bone marrow CD34+ cells were transduced ex vivo with the MND (myeloproliferative sarcoma virus, negative control region deleted, dl587rev primer binding site)–ADA gammaretroviral vector (gRV) and infused following busulfan reduced-intensity conditioning. These patients were monitored in a long-term follow-up protocol over 8 to 11 years. Nine of 10 patients have sufficient immune reconstitution to protect against serious infections and have not needed to resume ERT or proceed to secondary allogeneic HSCT. ERT was restarted 6 months after GT in the oldest patient who had no evidence of benefit from GT. Four of 9 evaluable patients with the highest gene marking and B-cell numbers remain off immunoglobulin replacement therapy and responded to vaccines. There were broad ranges of responses in normalization of ADA enzyme activity and adenine metabolites in blood cells and levels of cellular and humoral immune reconstitution. Outcomes were generally better in younger patients and those receiving higher doses of gene-marked CD34+ cells. No patient experienced a leukoproliferative event after GT, despite persisting prominent clones with vector integrations adjacent to proto-oncogenes. These long-term findings demonstrate enduring efficacy of GT for ADA SCID but also highlight risks of genotoxicity with gRVs. This trial was registered at www.clinicaltrials.gov as #NCT00794508.
Introduction
Adenosine deaminase (ADA) deficiency results from the lack of functional ADA enzyme, and infants born with profound ADA deficiency develop severe combined immunodeficiency (SCID).1 When ADA enzyme is nonfunctional, high levels of its substrates, adenosine and deoxyadenosine, accumulate systemically, and lymphoid cells, with high levels of deoxycytidine kinase can phosphorylate deoxyadenosine and accumulate deoxyadenosine triphosphate (dATP).2 Excess dATP is linked to apoptosis in immature thymocytes and consequently the impairment of T-, B-, and natural killer (NK)-cell differentiation and function.3 As a result, patients with ADA SCID have severe lymphopenia and are susceptible to life-threatening infections.
There are several methods for treating ADA-SCID that can restore functional immunity and confer normal resistance to infections.4 The most longstanding method is allogeneic hematopoietic stem cell transplantation (HSCT).5 This treatment is most effective with a human leukocyte antigen-matched family donor; if there are none available, a mismatched family member (eg, haplo-identical parent) or unrelated donor (adult or cord blood) can be used.6 There are several risks associated with an unmatched or unrelated donor, such as rejection and graft-versus-host disease, which can be acute, chronic, and rarely fatal.
Another treatment option is polyethylene-conjugated ADA enzyme replacement therapy (PEG-ADA ERT). This involves 1 to 2 times per week intramuscular injections of pharmaceutical-grade PEG-ADA enzyme, which only partially improves immune function and has high ongoing financial costs as a chronic therapy.7 Currently, PEG-ADA ERT is often used as a bridge to HSCT or gene therapy (GT), providing metabolic detoxification and improving general well-being before transplant.4
Finally, GT is an alternative transplant option for ADA-SCID that does not requires a donor and eliminates the risk of graft-versus-host disease.8-13 In 2016, the European Medicines Agency approved Strimvelis, a GT treatment with a γ-retroviral vector (gRV) encoding for a functional human ADA cDNA sequence introduced into CD34+ hematopoietic stem and progenitor cells (HSPCs) following reduced intensity conditioning (RIC) (https://www.ema.europa.eu/en/medicines/human/orphan-designations/eu305313).
In this study, we followed this GT approach, withholding ERT to improve the selective survival advantage of gene-corrected lymphocytes, and administering busulfan RIC before infusion of the gene-modified autologous cells. Between 2009 and 2012, 10 children diagnosed with ADA-SCID were treated in a phase 2 GT trial using a gRV Myeloproliferative Sarcoma Virus, Negative control region deleted, dl587rev primer binding site (MND)-ADA. In line with US Food and Drug Administration guidelines (https://www.fda.gov/regulatory-information/search-fda-guidance-documents/long-term-follow-after-administration-human-gene-therapy-products), these patients are being followed for a total of 15 years after GT to monitor the safety and efficacy of GT for ADA-SCID. Long-term clinical data collection is essential, given the novelty of GT with now recognized risks for leukoproliferative events from gRV that may have integrated near cellular proto-oncogenes.14,15
Shaw et al13 reported on the first 2 years of study evaluations after GT for this cohort in the GT clinical trial. Here, we present the longer-term outcomes 8 to 11 years after GT.
Methods
Clinical trial protocol
These patients were initially treated under a GT clinical trial (NCT00794508) previously described.13 Briefly, patients diagnosed with ADA SCID were offered enrollment in the phase 2 GT clinical trial. Informed consent was obtained following guidelines of the University of California, Los Angeles and National Institutes of Health Institutional Review Boards. The major eligibility criteria included (1) confirmed absence of ADA enzyme activity in peripheral blood or fetal cells, (2) absolute lymphocyte count (ALC) <200 cells/mm3, and (3) absence of a suitable matched sibling donor. Each patient received ERT from the time shortly after their diagnosis with ADA SCID up until their treatment in this study (stopped within 7 days before bone marrow [BM] harvest).
Patients meeting eligibility criteria underwent a BM harvest, collecting 15 to 20 mL/kg. The BM was processed for immunoselection of CD34+ cells, which were transduced with the MND-ADA gRV vector. At the completion of the 4-day culture period, the transduced CD34+ cells were infused fresh to the patients. During the cell culture period, the patients received RIC with busulfan using a single fixed dose on day –3 before transplant of 90 mg/m2, which corresponded to 2.6 to 5.2 mg busulfan/kg.
Clinical monitoring and follow-up
Patients were followed for 2 years under the clinical GT protocol. They were then offered enrollment into a long-term follow-up (LTFU) study, which assessed safety and gene marking of blood cells and immune function. At annual visits, an interval history and physical examination, routine blood cell counts, serum chemistries, and immune assessments, including lymphocyte subsets and quantitative immunoglobulins, were performed and documented. Blood samples were also shipped from the home clinical site to University of California, Los Angeles, and Duke University for testing. Replication-competent retrovirus (RCR) testing was performed by the National Gene Vector Biorepository at Indiana University.
Vector copy number determination
Heparinized peripheral blood samples were separated by Ficoll-Hypaque centrifugation into peripheral blood mononuclear cells (PBMCs) and granulocyte fractions. The granulocyte fraction was depleted of contaminating lymphocytes using immunomagnetic beads to CD3, CD19, and CD56 (STEMCELL Technologies, Vancouver, BC, Canada). Phenol/chloroform methods or PureLink Genomic DNA Mini Kit were used to isolate genomic DNA for droplet digital polymerase chain reaction (ddPCR) measurements of VCN, using the Bio-Rad QX200 Droplet Digital PCR System (Hercules, CA).
Vector integration site analysis
gRV integration sites were determined using the sonic shear abundance method as described16-18 from stored samples of PBMC genomic DNA. All coordinates are on human genome draft hg38. INSPIIRED v1.1 software was used for bioinformatic analyses (http://github.com/BushmanLab/INSPIIRED).
ADA enzyme activity and deoxyadenosine nucleotides
Routine immunologic monitoring
All immunologic assays were conducted in facilities certified by Clinical Laboratory Improvement Amendments. Assays were performed to determine lymphocyte subset numbers, according to immunophenotype, and serum immunoglobulin levels. Age-normal ranges used for lymphocyte enumeration and immunoglobulin levels were from Shearer et al21 and Agarwal et al,22 respectively.
T-cell receptor sequencing
Genomic DNA was extracted from PBMC samples using the Gentra Puregene Cell Kit (158767; Qiagen). T-cell receptor (TCR) Vβ rearrangements were amplified from 200 ng of gDNA with 2 replicates per sample using a cocktail of 23 Vβ families with framework region 2 (FR2) forward primers, and 13 Jβ primers, as described previously.23,24 Sequencing was performed in the Human Immunology Core Facility at the University of Pennsylvania using the Illumina 2 × 300-bp paired-end kit (Illumina MiSeq Reagent Kit v3, 600-cycle, Illumina MS-102-3003).
Statistical methods
Quantitative measurements collected over time were presented in figures descriptively, and medians were summarized by subjects. Linear mixed model was used to assess if stable trends over the subsequent years (test of slope) were observed in vector copy number (VCN) of granulocytes, VCN of PBMC, ADA activity in PBMCs, ALC, and percentage of dAXP of total adenine nucleotides (%dAXP), respectively. Variation of lymphocyte subsets within individual patients was assessed by coefficients of variation (CV), and the test of the equality of the CV25 was performed. Spearman's rank correlation coefficient rs were used to quantify the correlations between pairs of quantitative measurements such as VCN of granulocytes vs molecular, biochemical, and immunologic outcomes of the GT, CD19+ B-cell counts vs serum immunoglobulin levels, and PBMC ADA activity vs ALC. An α of 0.05 was used as the cutoff for significance for 2-sided statistical testing. All statistical analyses were carried out using statistical software R version 4.0.0.26
Results
Patients with ADA SCID
Ten ADA SCID patients were treated with GT between 2009 and 2012 under a phase II trial using the MND-ADA gRV and busulfan RIC. Transplant parameters including cell dose, VCN in the cell product, and the busulfan exposure were reported13 and are reproduced in Table 1. At the time of GT, ages ranged from 3 months to 15 years. The CD34+ cell per kg doses varied from 0.6 to 8.4 106/kg. The VCN in the cell products ranged from 0.6 to 2.7. Busulfan area-under-the-curves after a single fixed 90-mg/m2 dose ranged from 2427 to 6714 μM × minutes.
Safety
For all 10 patients, adverse events during LTFU were low grade in severity, and no serious adverse events were reported. No severe, persistent, or opportunistic infections nor RCR, leukoproliferative events, or malignancies occurred. All patients grew at normal rates, (supplemental Figure 1), aside from 1 patient enrolled at age 15 years with existing short stature. One patient grew under the lower fifth percentile for height and another patient remains above the 95th percentile.
Gene marking of leukocytes
Heparinized peripheral blood samples were obtained at 6- to 12-month intervals, separated into PBMCs and granulocyte fractions. Genomic DNA was isolated from these cells, and the average VCNs were determined using ddPCR with primers specific for the vector sequences.
After initial variability in the VCN in granulocytes over the first 1 to 2 years, the subsequent levels were stable for each patient over the course of LTFU (Figure 1A). The stability of granulocyte VCN 2 to 10 years after GT is consistent with the long-term stable function of the gene-modified hematopoietic stem cells (HSCs) following retrovirus-mediated transduction and autologous transplantation with RIC.
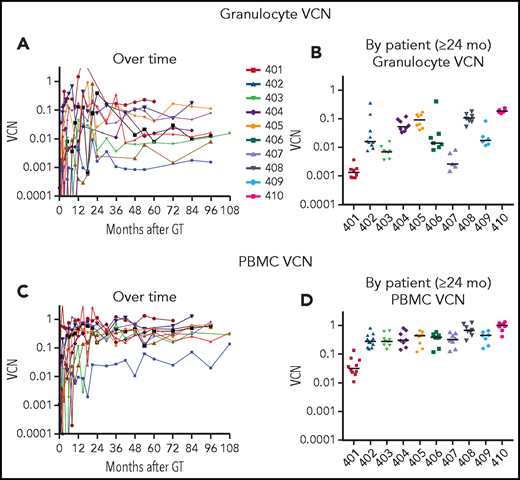
VCN in granulocytes and PBMCs. Genomic DNA, isolated from (A-B) granulocyte and (C-D) PBMC fractions isolated from peripheral blood samples obtained at serial times after gene therapy as described in “Materials and methods” was analyzed using ddPCR to quantify average VCN. The test results are displayed chronologically (A,C) or grouped by patient for samples 2 years or later after GT (B,D).
VCN in granulocytes and PBMCs. Genomic DNA, isolated from (A-B) granulocyte and (C-D) PBMC fractions isolated from peripheral blood samples obtained at serial times after gene therapy as described in “Materials and methods” was analyzed using ddPCR to quantify average VCN. The test results are displayed chronologically (A,C) or grouped by patient for samples 2 years or later after GT (B,D).
There was a nearly 100-fold range in the levels of granulocyte VCNs measured among the different patients (Figure 1B). The lowest levels of granulocyte marking were in patient 401 (∼0.001), who received the lowest cell dose of transduced CD34+ cells and resumed ERT at 6 months after GT. For others, the granulocyte VCNs ranged from ∼0.003 for patient 407 to VCN = 0.2 for patient 410. In contrast, the VCNs in the PBMC fraction (containing T, B, and NK lymphocytes and monocytes) were more similar among all the patients, ranging from 0.1 to 1.0 (Figure 1C-D).
Vector integration site analysis
We previously reported vector integration site analysis (VISA) results in the PBMC samples from these patients over the first few years after GT.27 At that time, there was a wide range in the diversity of vector integrant numbers, with some patients (401, 403, and 407) having low estimated numbers of unique integrants in their PBMCs (<100) and others (404, 408, 410), having polyclonal engraftment of gene-transduced HSCs, with >10 000 estimated unique integrants in their PBMCs.
Troublingly, 3 of the patients with low granulocyte gene marking and low integrant diversity had prominent PBMC clones accounting for up to 10% of their gene-marked cells, with integrants near cellular proto-oncogenes (LMO2, MECOM, PRDM1) that have been associated with insertional oncogenesis and development of leukoproliferative complications in previous trials of GT using gRVs.27-33 These proto-oncogene-adjacent integrants were among the 10 most frequent unique integrants for these patients.
Therefore, an important component of this LTFU study was to evaluate the status of vector integrants over this longer time period. Vector integration sites were determined from PBMC samples obtained approximately 2 years after gene therapy (t1) to coincide with the latest times previously tested27 and also from the most recently obtained PBMC sample available to assess changes over the time of LTFU. We assessed the general trends in retention of diversity of integration sites, as well as specifically characterized the proto-oncogene-adjacent integrants to determine whether the prominent clones have remained stable in relative frequency or have expanded or contracted.
As before,27 the degree of clonal diversity varied widely among the different subjects, and findings were consistent with the prior assessments (Figure 2A; Table 2). Patients 401, 403, and 407, with lowest granulocyte VCN, were visibly pauci-clonal, with several of the top 10 most frequent integrants present as 10% to 20% of the total and the top 10 integrants composing >75% to 80% of total integrants. Patients 402, 405, 406, and 409 had moderate clonal diversity, with their 10 most frequent integrants composing 25% to 35% of all integrants. Patients 404, 408, and 410, with the highest granulocyte VCN, had the most diversity, with the top 10 clones each representing <1% to 2% of total unique integrants (Figure 2).

VISA of PBMCs. Vector integration sites were determined from PBMC samples obtained ∼2 years after gene therapy at the start of LTFU and from the most recently obtained PBMC sample available to assess changes over the time of LTFU. (A) Stacked bars illustrate the 10 most abundant vector integration sites detected at the times indicated for each patient. (B) Word cloud with names of genes most commonly found with vector integrants across all 10 patients. Relative sizes of the gene names indicate their relative abundance. *Within transcription unit (TU); ∼within 50 kB of oncogene(s); !within 50 kB of gene(s) implicated in human lymphomas; N.B., LMO2 gene name appears twice, representing integrants within the LMO2 TU (denoted with an asterisk) and those adjacent to, but not actually within, the LMO2 TU.
VISA of PBMCs. Vector integration sites were determined from PBMC samples obtained ∼2 years after gene therapy at the start of LTFU and from the most recently obtained PBMC sample available to assess changes over the time of LTFU. (A) Stacked bars illustrate the 10 most abundant vector integration sites detected at the times indicated for each patient. (B) Word cloud with names of genes most commonly found with vector integrants across all 10 patients. Relative sizes of the gene names indicate their relative abundance. *Within transcription unit (TU); ∼within 50 kB of oncogene(s); !within 50 kB of gene(s) implicated in human lymphomas; N.B., LMO2 gene name appears twice, representing integrants within the LMO2 TU (denoted with an asterisk) and those adjacent to, but not actually within, the LMO2 TU.
The diversity in the numbers of integrants in each sample were expressed in several ways, including by the Chao1 estimator, that provides a lower bound for the total number of different integrants in a sample (Table 2). The patients with the lowest diversity had estimated 12 to 221 unique integrants, whereas those with the most diversity had >1000 to 2000 integrants. Each measure of vector integrant diversity correlated with the granulocyte VCN: unique integrations (rs = 0.83, P = .006), Chao1 estimator (rs = 0.88, P = .002), and Shannon Diversity Index (rs = 0.94, P < .001; Table 2; supplemental Figure 2).
The most common integrations sites identified among all the subjects as a group are depicted in Figure 2B (and individually in supplemental Figure 3). Six of the patients had clones with integrants near the known proto-oncogene MECOM (supplemental Figure 4), present as ≥1% of total integrants in 3 (Table 2). Three also had integrants at ≥0.5% of total near LMO2 or CCND2 and 1 near HMGA2 (Table 2). Many of the other common integration sites are annotated as being near other proto-oncogenes or lymphoma-associated genes (supplemental Table 1).
Patient 402 who previously was determined to have 3 vector integrants near MECOM in the first 2 years showed the persistence of these clones at unchanged frequencies between years 2 and 10. In contrast, patient 403 has a clone with a MECOM-adjacent integrant that increased from 5% at 2 years to 16% at 10 years, a greater than threefold increase (supplemental Figure 4). Patients 404, 408, and 410, who had the most polyclonal marking, had several integrants detected near MECOM, LMO2, and HMGA2 genes, but each was at relatively low frequency (0.2% to 0.6%; supplemental Table 1).
ADA enzyme activity and ERT
PEG-ADA ERT was discontinued 1 week before BM harvest. All but 1 patient remained off ERT after GT through the 8 to 11 years of follow-up. Patient 401 resumed ERT 6 months after his transplant because of low ADA enzyme activity in his PBMC and low lymphocyte counts (Figure 3A-B); he had received the lowest CD34+ cell dose at transplant.
![ADA enzyme activity in PBMCs and dAXP in RBCs. (A-B) PBMCs isolated from peripheral blood samples by Ficoll-Hypaque separation were counted, frozen, and assayed for ADA enzyme activity using a radiochemical assay. (C-D) Deoxyadenosine nucleotides (dAXP = dAMP + dADP + dATP) were measured in RBCs, as described.20 The test results are displayed chronologically (A,C) or group by patient for samples 2 years or later after gene therapy (B,D). The horizontal dashed red line is the upper limit for normal control samples in the testing laboratories (<0.2%); the horizontal dashed blue line is the median value for %dAXP in 22 recipients of allogeneic HSCT for ADA SCID (median = 4.8%; mean = 7.0 ± 11.0% [standard deviation]; M.S.H., unpublished observation).](https://ash.silverchair-cdn.com/ash/content_public/journal/blood/138/15/10.1182_blood.2020010260/6/m_bloodbld2020010260f3.png?Expires=1764374506&Signature=g3WRKD3epg4-ravK2Ut7ljhBzQddyDILqzTBmR55YgC1X7MCE4DZs-f47xZ7e3g6NO9GmdMmUD7SMIz45nWKw5UwyH-oUuFnAa-1hyBD37uNEWGC4Cv2u~2s8~hzfsFZBbt4m8mv1DTk-GcNUKD1staNZ1m0D-4~buKnNjCLDDGytxkZEXdSRZ3DdYblYSvfQcBXEyyeKWzET94xiiv4wXTeHErw0vCA1j5lkOGShWK4wyMheplrPTtDW7WAxxx0UbxMbNurrOtTPDqEroO0Lv8SY26~dZwSugv7uGVrpWXuiihIIeFLSFc250FO8TfOI8Ae7b1BKHNKCXuTZmyH0w__&Key-Pair-Id=APKAIE5G5CRDK6RD3PGA)
ADA enzyme activity in PBMCs and dAXP in RBCs. (A-B) PBMCs isolated from peripheral blood samples by Ficoll-Hypaque separation were counted, frozen, and assayed for ADA enzyme activity using a radiochemical assay. (C-D) Deoxyadenosine nucleotides (dAXP = dAMP + dADP + dATP) were measured in RBCs, as described.20 The test results are displayed chronologically (A,C) or group by patient for samples 2 years or later after gene therapy (B,D). The horizontal dashed red line is the upper limit for normal control samples in the testing laboratories (<0.2%); the horizontal dashed blue line is the median value for %dAXP in 22 recipients of allogeneic HSCT for ADA SCID (median = 4.8%; mean = 7.0 ± 11.0% [standard deviation]; M.S.H., unpublished observation).
ADA enzyme activity in PBMCs and dAXP in RBCs. (A-B) PBMCs isolated from peripheral blood samples by Ficoll-Hypaque separation were counted, frozen, and assayed for ADA enzyme activity using a radiochemical assay. (C-D) Deoxyadenosine nucleotides (dAXP = dAMP + dADP + dATP) were measured in RBCs, as described.20 The test results are displayed chronologically (A,C) or group by patient for samples 2 years or later after gene therapy (B,D). The horizontal dashed red line is the upper limit for normal control samples in the testing laboratories (<0.2%); the horizontal dashed blue line is the median value for %dAXP in 22 recipients of allogeneic HSCT for ADA SCID (median = 4.8%; mean = 7.0 ± 11.0% [standard deviation]; M.S.H., unpublished observation).
All patients besides 401 and 409 had PBMC ADA activity within or above the normal range of the assay (Figure 3A-B). Patients 404, 408, and 410 who received GT at the youngest ages (3 months of age) maintained the highest levels of ADA activity in their PBMCs throughout LTFU.
As another index of functional ADA enzyme activity, the %dAXP among all adenine nucleotides in RBC, elevated in the absence of ADA activity, were measured in all patients at multiple time points (Figure 3C-D). Each patient maintained sufficient ADA enzyme activity from the gene-modified grafts to eliminate deoxyadenosine and prevent re-accumulation of dAXP in RBCs. In this assay, the normal %dAXP is <0.2% of total adenine nucleotides; this was only achieved in patient 401 who was on PEG-ADA ERT. However, the median %dAXP was <5% in all other patients, similar to levels achieved in recipients of allogeneic HSCT (in 22 recipients of allogeneic HSCT for ADA SCID, the median %dAXP was 4.8% [mean = 7.0 ± 11.0% [standard deviation]; M.S.H., unpublished observation, 11 February 2021).
Lymphocyte numbers
At each follow-up visit, ALCs were determined by complete blood counts with differentials, and lymphocyte subsets were enumerated by flow cytometry. The ALCs remained relatively stable over the time of follow-ups for each patient (Figure 4A). The lowest lymphocyte counts (∼200/mm3) were in patients 401 (despite continual ERT) and 403, with low granulocyte VCN. The highest lymphocyte counts (>1000/mm3) were present in the 3 patients treated at the youngest ages (404, 408, and 410); nevertheless, these lymphocyte counts did not exceed the lower 10th percentile for healthy children between ages 2 to 6 and 6 to 12 years old (2300 and 1900/mm3, respectively).21 There was a strong correlation between the median PBMC ADA activity achieved from GT and the median ALC (rs = 0.92; P = .001; supplemental Figure 5A).
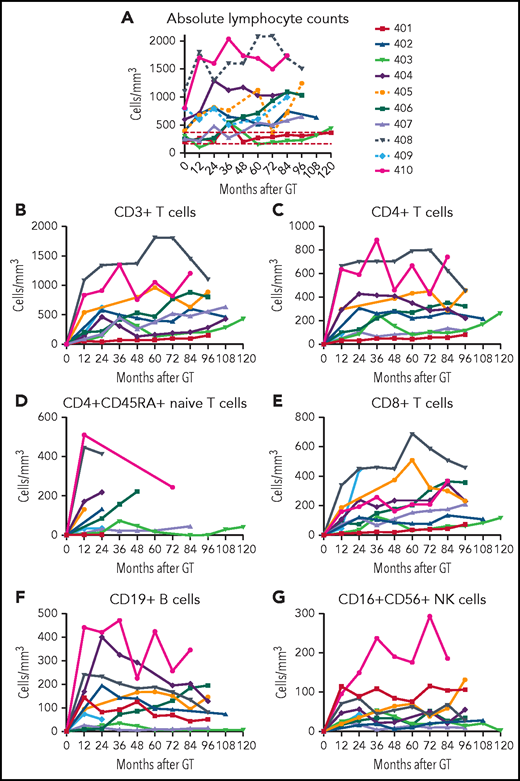
ALCs. (A) ALCs determined by clinical complete blood cell counts are shown for each patient over time after GT. Lymphocyte subsets determined by flow cytometry are shown for (B) total CD3+ T cells, (C) CD4+ T cells, (D) CD4+/CD45RA+ naïve T cells, (E) CD8+ T cells, (F) CD19+ B cells, and (G) CD16+/CD56+ NK cells.
ALCs. (A) ALCs determined by clinical complete blood cell counts are shown for each patient over time after GT. Lymphocyte subsets determined by flow cytometry are shown for (B) total CD3+ T cells, (C) CD4+ T cells, (D) CD4+/CD45RA+ naïve T cells, (E) CD8+ T cells, (F) CD19+ B cells, and (G) CD16+/CD56+ NK cells.
The age at GT also correlated with the median ALC (supplemental Figure 5B). The 3 subjects treated with GT by 3 months of age reached ALCs >1000/mm3, those treated between 4 and 20 months of age had ALCs >500/mm3, and those treated at 8 and 15 years of age reached ALCs ∼200/mm3.
Parallel trends were observed in the development of the different lymphocyte subsets. CD3+, CD4+, and CD8+ T-cell counts were relatively stable over time for each patient (Figure 4B-G; supplemental Table 2). Patients 408 and 410 stand out with the highest absolute CD3+, CD4+, and CD4+CD545RA+ T-cell counts. Patients 401 (despite continual ERT), 403, and 407 had the lowest T-cell numbers.
B-lymphocyte numbers also varied among the patients (Figure 4F). Patients 404, 405, 408, and 410 had absolute CD19+ B-cell counts above 150/mm3. These 4 patients are the only ones who have been able to discontinue immunoglobulin replacement therapy (IgRT). Patient 401 had numbers of NK cells higher than all but 1 of the other patients, perhaps reflecting the ability of PEG-ADA ERT to support recovery of this population (Figure 4G).
B-cell function
B-cell function was assessed by measuring quantitative serum immunoglobulin levels to assess antibody production capacity after GT. Patients 402, 404, 408, and 410 had IgM levels in the normal range (Figure 5A). Serum IgA levels were more variable, with all patients having similar levels around the lower limit of normal for their age (Figure 5B). Median serum IgM levels across all subjects correlated with median absolute CD19+ cell counts (rs = 0.83, P = .01), but serum IgA levels did not (rs = 0.27, P = .49).

Serum immunoglobulin levels 2 or more years after gene therapy. Serum IgM (A) and IgA (B) levels were measured in all subjects and IgG (C) in the 4 subjects who discontinued IgRT. Horizontal dashed red line indicates lower limits of normal. Horizontal bars in each patient’s data points represent medians. The numbers in parentheses in panel C represent the time (months) after GT that IgRT was stopped.
Serum immunoglobulin levels 2 or more years after gene therapy. Serum IgM (A) and IgA (B) levels were measured in all subjects and IgG (C) in the 4 subjects who discontinued IgRT. Horizontal dashed red line indicates lower limits of normal. Horizontal bars in each patient’s data points represent medians. The numbers in parentheses in panel C represent the time (months) after GT that IgRT was stopped.
Four patients were taken off IgRT, based on clinical assessment of B-cell numbers, IgM levels, and general well-being. These subjects maintained serum IgG levels ≥500 mg/dL (Figure 5C). Two of the 4 patients who stopped receiving IgRT were tested and responded to vaccines (responses to vaccinations are detailed in supplemental Table 3). The patients who remained on IgRT also continued to receive prophylactic antibiotics.
TCR repertoire diversity
To assess the diversity and stability of the circulating T-cell repertoire, bulk sequencing of TCR Vβ rearrangements was performed on stored PBMC samples taken at 2 time points: one early in LTFU, near the completion of the treatment trial (t1), and the second 7 to 10 years later (t2). Thousands of T-cell clones were surveyed in all available samples. TCR Vβ rearrangements were grouped into clones, and repertoire features were compared between the 2 time points (supplemental Table 4).
Despite the variable diversity and clone size distribution in the overall repertoire, the repertoire of each individual did exhibit some degree of stability. First, when use of the most abundant TRBV rearrangements of each subject was analyzed by hierarchical clustering (Figure 6A; supplemental Figure 6), the repertoires tended to cluster by subject rather than by time point (or subject age; see supplemental Figure 7, suggesting that subject-intrinsic features of the repertoire were retained over time). Second, in the 7 patients with paired TCR sequencing data, hundreds of clones were present at both time points (Figure 6B). Finally, all patients with paired TCR sequencing data at 2 points had large clones that were not only persistent over time, but remained large, exhibiting similar clone copy number fraction ranks at both time points (Figure 6C). These findings indicate that the T-cell repertoires of patients exhibit patient-specific TRBV use and stably maintain high-copy expanded clones over time.
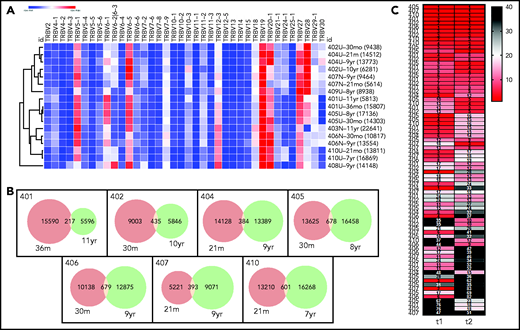
Stability of T-cell repertoires in transplanted patients. (A) TRBV gene use, normalized (heat map indicates z-score) and clustered by row (sample). Each clone is only counted once per sample. TRBV genes that account for <1% of total clones are excluded. Each row is labeled with the sample name and time point and the clone number is given in parentheses. (B) Venn diagrams showing clone numbers that are found at each time point and those that overlap between 2 time points (based on the same samples and time points that are shown in panel A). (C) Ranks of the T-cell clones that overlap between the 2 time points. Numbers to the left indicate the subjects. Columns indicate the time of the sample, with time point 1 (t1) being the earlier time point and t2 the later time point (same samples and time points as in panel A. Numbers in the cells indicate the clone ranks, which are also shown in the heat map. A rank of 1 indicates the clone with the highest sequence copy number fraction in the sample. Only clones with a combined rank of <100 (summed ranks of t1 + t2) are shown.
Stability of T-cell repertoires in transplanted patients. (A) TRBV gene use, normalized (heat map indicates z-score) and clustered by row (sample). Each clone is only counted once per sample. TRBV genes that account for <1% of total clones are excluded. Each row is labeled with the sample name and time point and the clone number is given in parentheses. (B) Venn diagrams showing clone numbers that are found at each time point and those that overlap between 2 time points (based on the same samples and time points that are shown in panel A). (C) Ranks of the T-cell clones that overlap between the 2 time points. Numbers to the left indicate the subjects. Columns indicate the time of the sample, with time point 1 (t1) being the earlier time point and t2 the later time point (same samples and time points as in panel A. Numbers in the cells indicate the clone ranks, which are also shown in the heat map. A rank of 1 indicates the clone with the highest sequence copy number fraction in the sample. Only clones with a combined rank of <100 (summed ranks of t1 + t2) are shown.
Engraftment levels of gene-corrected cells (granulocyte VCN) and response to ADA SCID gene therapy
To assess the relationship between the levels of engraftment of gene-corrected HSCs and the extent of molecular, biochemical, and immunologic reconstitution achieved, we used the surrogate end point of median granulocyte VCN for each patient during LTFU as a proxy for engraftment levels. The dose of gene-modified CD34+ cells infused and the intensity of busulfan RIC correlated with the granulocyte VCN (supplemental Tables 5 and 6).
We compared median granulocyte VCN for each patient to several efficacy outcome parameters (Figure 7). Across all patients (excluding subject 401 on ERT), VCN in granulocytes correlated with ADA activity in PBMCs (rs = 0.40, P = .04), %dAXP in RBC (rs = −0.53, P < .001, ALC (rs = 0.51, P < .001), absolute numbers of CD3+ T cells (rs = 0.29, P = .04), absolute numbers of CD19+ B cells (rs = 0.53, P < .001), and (F) serum IgM values (rs = 0.50, P = .001). TCR diversity also correlated with granulocyte VCN (supplemental Figure 8). These results suggest that the levels of gene-modified HSC engrafted (as indicated by granulocyte VCN) strongly predict overall immune reconstitution in patients treated with GT for ADA-SCID.
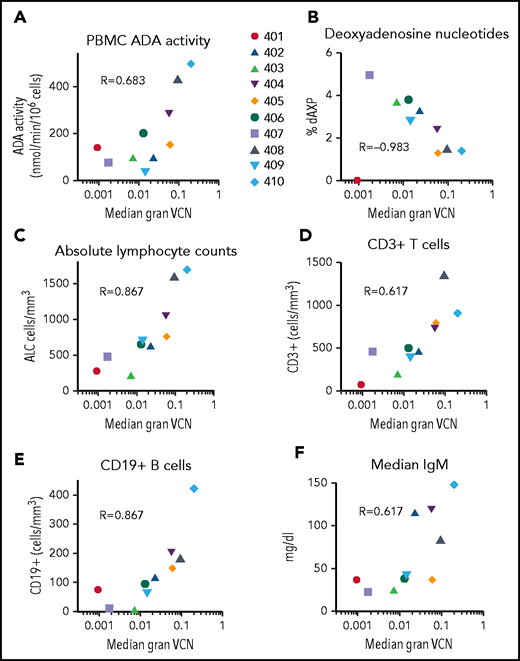
Correlations between median granulocyte VCN and biochemical and immunological outcomes. The median granulocyte VCN for each subject (as in Figure 2) were plotted vs the median values calculated for each subject for (A) PBMC ADA enzyme activity, (B) RBC deoxyadenosine nucleotides, (C) ALC, (D) absolute numbers of CD3+ T cells, (E) absolute numbers of CD19+ B cells, and (F) serum IgM levels. R values shown represent Spearman correlations between median granulocyte VCN and median of each of the outcome parameters.
Correlations between median granulocyte VCN and biochemical and immunological outcomes. The median granulocyte VCN for each subject (as in Figure 2) were plotted vs the median values calculated for each subject for (A) PBMC ADA enzyme activity, (B) RBC deoxyadenosine nucleotides, (C) ALC, (D) absolute numbers of CD3+ T cells, (E) absolute numbers of CD19+ B cells, and (F) serum IgM levels. R values shown represent Spearman correlations between median granulocyte VCN and median of each of the outcome parameters.
Discussion
Our study presents 8 to 11 years of LTFU data on a cohort of 10 patients with ADA SCID treated with GT using a gRV and busulfan RIC. The overall outcomes have been excellent in terms of health and immune reconstitution. There has been normal growth of all patients treated early in life with no serious opportunistic infections. Nine of 10 patients remained off PEG-ADA ERT, and none required a rescue allogeneic HSCT because of poor immune reconstitution. Four of the 9 evaluable patients stopped immunoglobulin replacement. There were no RCR detections, leukoproliferative events, malignancies, or any other complications related to the GT.
The major observation of this report is the stability and persistence of the effects of GT. The levels of vector-containing leukocytes, expression of ADA enzyme, detoxification of deoxyadenosine metabolites, and the degree of immune reconstitution that were reached in the first 1 to 2 years have persisted for the duration of time since GT. Gene-corrected stem cells were able to engraft and produce ADA-expressing leukocytes for the years of observation, despite the ex vivo isolation of CD34+ cells from the BM, cultured over 4 days with recombinant cytokines, exposure to the gRV, and reinfusion.
ADA SCID was one of the early disease candidates selected for evaluation of GT activity, in part because of the expected selective advantage of ADA-replete lymphoid progenitors, allowing development of increasing numbers of lymphocytes from relatively few numbers of gene-corrected stem cells.34-37 This selective survival of ADA replete lymphocytes is demonstrated in the patients receiving GT reported here who have higher VCN measured in PBMCs (0.3-1 copy per cell) than in granulocytes (ranging from <0.01 to 0.2 copies per cell).
The extent of immune reconstitution achieved across the different patients showed wide variability. The levels of lymphocytes and serum immunoglobulins approached or were at normal levels in several of the patients but were subnormal in others. However, no patients experienced severe infections, indicating that less than full normal levels of lymphocytes were sufficient to provide protective immunity during LTFU (albeit with IgRT and prophylactic antibiotics in those with lower levels of correction).
The surrogate marker for engraftment of gene corrected stem cells, granulocyte VCN, correlated with multiple molecular, biochemical, and immunologic outcomes. The 4 patients with the highest granulocyte VCN (≥0.03-0.10) had the highest PBMC ADA enzyme activity, the lowest %dAXP nucleotides, and reached CD3 >600 cell/mm3 and CD19 levels >150 cells/mm3. IgRT was stopped for all 4 of these patients, based on assessing their B-cell counts, serum IgM levels, and overall state of health. They have remained well, and 2 of the 4 patients taken off IgRT and evaluated have demonstrated responses to vaccination. The 2 patients with the highest granulocyte VCN (0.1-0.2) had the highest counts of CD3 (>1000 cell/mm3), CD4+ (>600 cell/mm3), and CD19 (>300 cell/mm3) lymphocytes and have the highest diversity of engraftment of vector-transduced stem cells, based on the VISA analysis.
Patients receiving GT at younger ages had higher levels of gene-corrected cells and better immunologic parameters, such as ALC. Additionally, younger patients received higher doses of transduced CD34+ cells, reflecting both better yield from BM harvest and better vector transduction efficiency, quantified by VCN. The total dose of CD34+ cells per kilogram infused, the calculated dose of transduced cells (CD34+ cells per kg × VCN), and the intensity of busulfan RIC for each patient each correlated with their granulocyte VCN values. The age-related decreases in CD34+ cell yields from the BM harvests13 and the resulting lower ALC may be circumvented by the use of mobilized PBSCs collected by leukapheresis, which generally yields higher numbers of CD34+ cells, relatively independently of age.
Genotoxicity from gRVs used to transduce HSPCs has been observed in multiple patients in GT clinical trials for other primary immune deficiencies.28-33 These leukoproliferations occurred when an HSPC with the vector integrated near and trans-activating a proto-oncogene (eg, LMO2, CCND2, and MECOM), underwent clonal expansion that then progressed to leukemia. Genotoxicity resulting in leukoproliferations in ADA SCID GT had not been observed for almost 2 decades, during which more than 50 patients were treated in published clinical trials,8-13 until a recent first instance, reported in October 2020 (https://ir.orchard-tx.com/news-releases/news-release-details/orchard-statement-strimvelisr-gammaretroviral-vector-based-gene). It remains ill defined why progression to leukoproliferation with gRV is still relatively attenuated in ADA SCID (∼2%) compared with the higher reported frequencies for other primary immune deficiencies (30% to 100%).
As seen in the patients described here and in reports on other trials using gRVs for ADA SCID,11,27,38,39 there are prominent and persistent PBMC clones with integrants near proto-oncogenes LMO2 and MECOM at increased frequencies. Despite prominent MECOM common integration sites in several patients in this study, no clinically significant leukoproliferation events have occurred to date. One patient was found to have several integrations near MECOM that had also been identified in the prior study,27 but the abundance of these clones did not change between 2 and 10 years after GT. In contrast, a MECOM-proximate integrant in another patient increased from 5% abundance to 16% between 2 and 10 years, which was statistically significant. Although the abundance did not reach the defined reporting threshold of a clone of >20% of total, it will be monitored over time. In a few of the patients with the highest gene marking, integrations near several proto-oncogenes were seen at their later time points, but at relatively low abundance (eg, 0.1% to 0.5%); their significance is unknown.
This group of patients with ADA SCID was treated a decade ago, using a gRV and the methods available at that time for vector production, hematopoietic cell processing, and administration of cytoreductive conditioning. All the patients reported here have remained clinically well over this period, suggesting that for ADA SCID, even relatively modest levels of engrafted gene-corrected stem cells (1% to 10%) may confer significant clinical benefits, allow freedom from ERT, and obviate need for an allogeneic HSCT. However, there was significant variability in efficacy among the patients in the levels of engraftment, based on granulocyte VCN. There were prominent and persistent clones with integrants near proto-oncogenes in several of unknown clinical significance.
The more contemporary approaches for ADA SCID GT produce more consistent results, in terms of granulocyte VCN.40 This is largely because of the current use of lentiviral vectors, which are more efficient than gRV vectors for CD34+ cell transduction and permit shorter ex vivo cell processing times to better preserve HSC activity.41 Lentiviral vectors have not been observed to lead to clonal leukoproliferations when applied to hundreds of patients in trials across multiple blood cell diseases and have become the de facto vector of choice for HSC GT.42,43 Studies using a lentiviral vector for ADA SCID have reported more consistent development of robust immune reconstitution with a higher percentage of patients able to discontinue IgRT than we observed in this group.44 Thus, GT for ADA SCID using a gRV supported survival and immune reconstitution in patients, but the potential genotoxicity justifies the subsequent movement to lentiviral vectors for ADA SCID and other disorders.
Acknowledgments
The authors thank the parents for enrolling their children in this study and for their continued cooperation with follow-up. The following physicians referred the patients and participated in their care and follow-up: David Lewis (Palo Alto, CA), Kenneth Purdy (San Jose, CA), Suzanne Skoda-Smith (Seattle, WA), Maite de la Morena (Seattle, WA), Ramsey Fuleihan (Chicago, IL), Aisha Ahmed (Chicago, IL), Nicholas Rider (Strasburg, PA), Kevin Straus (Strasburg, PA), James Gern (Madison, WI), Christine Seroogy (Madison, WI), Duane Wong (Phoenix, AZ), Jeffrey Bednarski (St Louis, MO), Alan Ikeda (Las Vegas, NV), and David Buchbinder (Orange, CA).
The clinical trial was supported by a US Food and Drug Administration Office of Orphan Products Development award (1RO1FD003005), the National Gene Vector Biorepository (grant P40RR024928, National Institutes of Health (NIH) National Heart, Lung, and Blood Institute grant 75N92019D00018), the NIH National Human Genome Research Institute Intramural Program, the NIH Clinical Center, and the California Institute of Regenerative Medicine (grants CL1-00505, FA1-00613, and AC1-07675). The vector integration studies were supported by the University of California, Los Angeles, Eli & Edythe Broad Center of Regenerative Medicine and Stem Cell Research. The Human Immunology Core facility at the University of Pennsylvania receives assistance for infrastructure support from NIH grants P30-AI0450080 (National Institute of Allergy and Infectious Diseases) and P30-CA016520 (National Cancer Institute).
Authorship
Contribution: D.B.K., B.C.E., G.M.P., F.C. F.D.B., K.L.S., and D.A.C.-S. designed the studies; D.B.K., K.L.S., E.G., D.A.C.-S., S.M., R.P.H., D.T., A.F., S.D.O., T.B.M., A.K.I., S.S., A.D., J.M., B.C.F., A.V., M.S.H., F.D.B., E.T.L.P., A. M. Rosenfield, W.M., S.S.D.R., H.M., R.S., F.C., C.J., J.E., A. M. Roche, P.H., and S.R. performed research; D.B.K., B.R., O.H., X.W., F.D.B., and J.E. performed data analysis; K.C. contributed key reagents; and D.B.K., B.R., and O.H. wrote the paper.
Conflict-of-interest disclosure: D.B.K. is an inventor for the University of California Regents of an ADA SCID gene therapy. D.A.C.-S. is an employee and shareholder of Orchard Therapeutics Limited, which is developing a commercial LV GT product for ADA SCID. E.T.L.P. is consulting or is an advisor for Roche Diagnostics, Enpicom, The Antibody Society, IEDB, and The American Autoimmune Related Diseases Association. The remaining authors declare no competing financial interests.
Correspondence: Donald B. Kohn, 3163 Terasaki Life Science Bldg, 610 Charles E. Young Dr E, Los Angeles, CA 90095; email: dkohn1@mednet.ucla.edu.
Integration site sequence data is available under Bioproject number PRJNA679795. The T cell receptor VBeta sequencing files are shared under BioProject number PRJNA716857.
The online version of this article contains a data supplement.
There is a Blood Commentary on this article in this issue.
The publication costs of this article were defrayed in part by page charge payment. Therefore, and solely to indicate this fact, this article is hereby marked “advertisement” in accordance with 18 USC section 1734.