

Key Points
Inflammation overrides erythropoietic signals in determining hepcidin concentration in untreated tuberculosis.
Iron absorption is blocked in untreated tuberculosis and progressively restored during treatment.

Abstract
Anemia of inflammation is a hallmark of tuberculosis. Factors controlling iron metabolism during anemia of inflammation and its resolution are uncertain. Whether iron supplements should be given during antituberculosis treatment to support hemoglobin (Hb) recovery is unclear. Before and during treatment of tuberculosis, we assessed iron kinetics, as well as changes in inflammation and iron metabolism indices. In a 26-week prospective study, Tanzanian adults with tuberculosis (N = 18) were studied before treatment and then every 2 weeks during treatment; oral and intravenous iron tracers were administered before treatment and after intensive phase (8/12 weeks) and complete treatment (24 weeks). No iron supplements were given. Before treatment, hepcidin and erythroferrone (ERFE) were greatly elevated, erythrocyte iron utilization was high (∼80%), and iron absorption was negligible (<1%). During treatment, hepcidin and interleukin-6 levels decreased ∼70% after only 2 weeks (P< .001); in contrast, ERFE did not significantly decrease until 8 weeks (P< .05). ERFE and interleukin-6 were the main opposing determinants of hepcidin (P< .05), and greater ERFE was associated with reticulocytosis and Hb repletion (P< .01). Dilution of baseline tracer concentration was 2.6-fold higher during intensive phase treatment (P< .01), indicating enhanced erythropoiesis. After treatment completion, iron absorption increased ∼20-fold (P< .001), and Hb increased ∼25% (P< .001). In tuberculosis-associated anemia of inflammation, our findings suggest that elevated ERFE is unable to suppress hepcidin, and iron absorption is negligible. During treatment, as inflammation resolves, ERFE may remain elevated, contributing to hepcidin suppression and Hb repletion. Iron is well absorbed only after tuberculosis treatment, and supplementation should be reserved for patients remaining anemic after treatment. This trial was registered at www.clinicaltrials.gov as #NCT02176772.
Introduction
Tuberculosis caused by Mycobacteriumtuberculosis is the leading global cause of death from a single infectious disease, with 10 million new cases and 1.5 million deaths per year.1 Anemia is common in tuberculosis patients, with up to 88% of patients affected.2-6 The etiology of anemia in tuberculosis is multifactorial, but anemia of inflammation usually plays a major role.7,8 The iron-regulatory hormone hepcidin drives anemia of inflammation by restricting availability of iron for erythropoiesis.9,10 In patients with anemic tuberculosis, various factors can modulate hepcidin: it is suppressed by iron deficiency, hypoxia, and erythropoiesis but increased by proinflammatory cytokines, particularly interleukin-6 (IL-6).9,11,12 Chronic inflammation is a hallmark of tuberculosis, and elevated hepcidin is characteristic of tuberculosis patients with and without HIV.7,13,14 Cytokines induced during tuberculosis may also directly suppress erythropoiesis and contribute to anemia.15 Erythroferrone (ERFE) is an erythroid regulator that mediates hepcidin suppression during stress erythropoiesis.16 In animal models, ERFE has been proposed to contribute to recovery from anemia of inflammation by suppressing hepcidin.17 Whether ERFE plays a role in humans during recovery from anemia of inflammation has not been studied.
During infection, hypoferremia due to iron sequestration and decreased dietary absorption is an innate immune response to withhold iron from pathogens.18 To survive and replicate within the host, M tuberculosis, like many pathogens, must acquire iron.19 To capture iron, it synthesizes siderophores, which bind ferric iron with high affinity and are essential for virulence.20,21 Iron excess markedly increases in vitro growth of M tuberculosis.22 In vivo, tuberculosis is more severe in iron-loaded mice,23,24 and high dietary iron uptake is associated with a higher risk of tuberculosis in humans.25 Conversely, iron deficiency and anemia are associated with increased mortality in tuberculosis patients,26,27 and anemia is associated with persistent positive sputum smears during antituberculosis treatment.3 Thus, both iron deficiency and excess are associated with disease progression and poor clinical outcomes in tuberculosis. In tuberculosis patients, distinguishing anemia of inflammation from iron-deficiency anemia is difficult because commonly used iron status biomarkers, such as ferritin and, to a lesser extent, soluble transferrin receptor, are confounded by inflammation. Thus, deciding if (and when) anemic patients with tuberculosis should be given iron is a major challenge.
In the current study, in mostly anemic Tanzanian adults with tuberculosis, we prospectively measured changes in iron metabolism and inflammation biomarkers and assessed dietary iron absorption and erythrocyte iron utilization by using oral and intravenous iron tracers, before, during, and after treatment. The study aims were to describe iron kinetics during recovery from anemia of inflammation and the interplay of hepcidin and ERFE in this process and to inform clinical practice on whether patients receiving antituberculosis treatment should be given iron supplementation.
Participants and methods
Participants
The study was conducted at the Ifakara Health Institute in the Bagamoyo district of eastern Tanzania from April 2015 until January 2017. Inclusion criteria were: (1) age 16 to 45 years; (2) sputum smear positive for tuberculosis confirmed by GeneXpert MTB/RIF assay; (3) body weight >40 kg; (4) not severely anemic (Hb >70 g/L); (5) HIV negative and free of malaria at enrollment; (6) no rifampicin resistance detected by GeneXpert MTB/RIF assay; (7) no self-reported major metabolic or gastrointestinal disorders or food allergies; (8) no intake of mineral/vitamin supplements 2 weeks before and during the study; (9) no blood transfusion, blood donation, or significant blood loss 6 months before the study; and (10) for female subjects, negative pregnancy test result (Status hCG Serum/Urine One-Step Pregnancy Test; LifeSign LLC, Skillman, NJ) and not breastfeeding.
Subjects provided written informed consent before enrollment. Informed consent and subject care during the study are further described in the supplemental Material (available on the Blood Web site). Review boards of the Ifakara Health Institute, the National Institute of Medical Research in Tanzania, the Tanzanian Food and Drug Authority, and ETH Zurich (Zurich, Switzerland) gave ethical approval. The study is registered at ClinicalTrials.gov (#NCT02176772) and later amended as reported in the supplemental Material.
Study design
In a prospective 26-week study, subjects were followed up every 2 weeks and received oral and intravenous iron stable isotopes at 3 time points: before, during, and at the end of treatment (Figure 1). At screening, we collected sputum and venous blood samples, and, in female subjects, a urine sample to test for pregnancy. Eligible subjects provided a urine and a stool sample for helminth analysis and received the first iron isotope administration at baseline, before they began tuberculosis treatment. Treatment consisted of an intensive phase of 8 weeks, with daily oral administration of isoniazid, rifampicin, ethambutol, and pyrazinamide, followed by 16 weeks of daily isoniazid and rifampicin (8-24 weeks) according to Tanzanian national guidelines. Participants who were tuberculosis sputum-negative at the end of the intensive phase received the second isotope administration at 8 weeks. Participants who were still tuberculosis sputum-positive at 8 weeks received the second isotope administration at 12 weeks. After treatment completion at 24 weeks, participants received the third isotope administration and completed the study at 26 weeks. From baseline to study end (0-26 weeks), participants were examined by the study physician (examinations included weight and height measurements), and venous blood samples were taken at biweekly intervals. Sputum was collected at baseline and at 8, 12 (only for participants who were still positive after 8 weeks), 20, and 24 weeks. Subjects remaining anemic at study end were referred to their physician for follow-up and treatment free of charge.
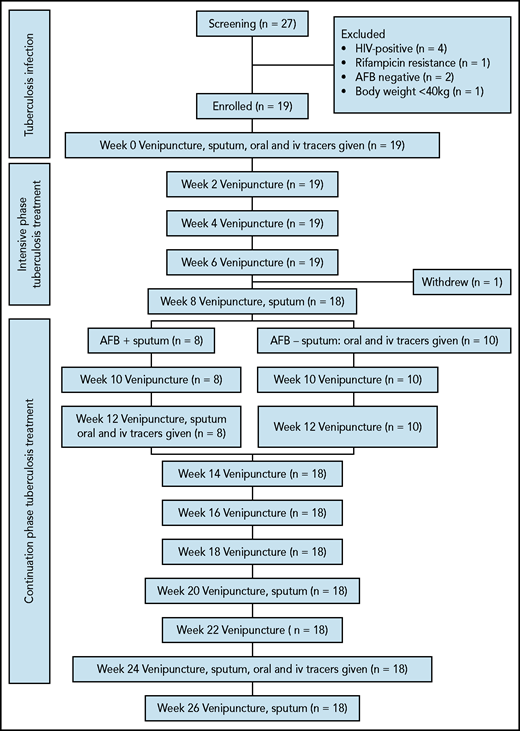
Overview of the study design. AFB–, acid-fast bacilli negative sputum; AFB+, acid-fast bacilli positive sputum.
Overview of the study design. AFB–, acid-fast bacilli negative sputum; AFB+, acid-fast bacilli positive sputum.
Determination of iron absorption and utilization
Iron absorption and utilization were assessed by using stable isotope techniques in which the incorporation of an oral 57Fe-dose and intravenous doses of 58Fe or 54Fe into erythrocytes was measured 14 days after administration.28 At baseline, a venous blood sample was drawn after an overnight fast before the participants received a test meal containing 6 mg labeled 57Fe as ferrous sulfate (FeSO4), which was fed under standardized conditions and close supervision (supplemental Material). One hour after the test meal was consumed, an aqueous solution containing 100 μg 54Fe or 58Fe as iron citrate was slowly infused over 50 minutes as previously described.29 No intake of food and fluids was allowed for 4 hours after test meal intake. After 8 weeks (or 12 weeks for participants who were still sputum smear-positive after 8 weeks) and 24 weeks, oral and intravenous administrations of isotopes were repeated.
Preparation of isotopically labeled iron
Isotopically labeled 57FeSO4 was prepared from isotopically enriched elemental iron (57Fe-metal, 96.5% enriched; Chemgas, Boulogne-Billancourt, France) by dissolution in 0.1 mol/L sulfuric acid. The solutions were flushed with argon to keep iron in the +II oxidation state. Iron citrate, enriched with either 54Fe or 58Fe, was prepared for intravenous infusion from elemental 54Fe and 58Fe according to the method previously described.30 The solution was divided in ampoules containing 100 μg Fe, sterilized, and checked for pyrogens. Enrichment of isotopic labels was 99.7% for 54Fe and 58Fe. The isotopic composition of the stable isotope labels was measured by using negative thermal ionization–mass spectrometry28 at ETH Zurich.
Tuberculosis and other parasitologic diagnosis
Sputum samples, collected as duplicates, were decontaminated, pelleted by centrifugation, examined for acid-fast bacilli by using fluorescence microscopy,31 and tested by using the GeneXpert MTB/RIF assay (Cepheid, Sunnyvale, CA). Acid-fast bacilli smear-positive results were graded according to the Centers for Disease Control and Prevention guidelines. Rapid malaria diagnostic pulmonary function tests (MRDT Pf, ICT Diagnostics, Cape Town, South Africa) were used to detect malaria parasitemia during screening. For diagnosis of helminth infections, single stool and urine samples were collected at baseline, and patients with positive results were treated accordingly. The Kato-Katz method (in triplicates), the Baermann technique (in duplicates), and urine filtration (in duplicates) were used to diagnose helminths (Strongyloides stercoralis, Trichuris trichiura, Schistosoma mansoni, Schistosoma haematobium, Ascaris lumbricoides, and hookworms).32-34 Parasitologic assessments were performed at the Ifakara Health Institute.
Blood analysis
Indices of iron metabolism (Hb, reticulocytes, mean cell volumes, mean corpuscular hemoglobin, mean corpuscular hemoglobin concentration, serum ferritin [SF], soluble transferrin receptor [sTfR], serum iron, transferrin saturation [TSAT], ERFE, erythropoietin [EPO], and serum hepcidin) and inflammation (IL-6, C-reactive protein, and α1-acid-glycoprotein) were assessed as detailed in the supplemental Material. DETERMINE HIV-1/2 (Abbott Rapid Diagnostics) was used to detect HIV during screening. In case of a positive test result, Uni-Gold HIV (Trinity Biotech PLC, Bray, Ireland) served as a confirmatory test.
For the isotopic analysis, iron was separated from whole blood as previously described35 and analyzed by multicollector inductively coupled plasma mass spectrometry (Neptune; Thermo Fisher Scientific, Dreieich, Germany) at ETH Zurich. The amount of isotopic label (54Fe, 57Fe, and 58Fe) present in the blood was calculated from isotope dilution.36 Circulating iron was calculated from blood volume based on height, weight, and Hb concentration.37 The amount of stable isotope administered was used to calculate fractional 54Fe, 57Fe, and 58Fe incorporation into erythrocytes after 14 days. Iron absorption was calculated by dividing the percentage of erythrocyte incorporation of the oral dose by the fractional erythrocyte incorporation of the intravenous dose.30,38 Concentration of the 54Fe tracer in the circulating iron was obtained from the measured isotopic ratios, using isotopic dilution equations similar to those used to calculate the amount of label. The slope of tracer concentration vs time was calculated by linear regression for the intensive and the continuation treatment phases. The 54Fe tracer was chosen for this calculation because it was administered at baseline and was not given again until the conclusion of the study, making it possible to follow its evolution during the intensive and continuation treatment phases.
Data analysis
We considered a 40% difference in iron absorption would be clinically relevant, and sample size calculations indicated at least 16 participants should be included for paired comparisons based on 80% power to detect such a difference, a standard deviation of 0.2 for log-transformed absorption data calculated from several previous studies from ETH Zurich, and a type I error rate of 5%. We anticipated a dropout rate of 15% to 20% and therefore enrolled 19 participants.
Data were analyzed by using SPSS 26.0 (IBM SPSS Statistics, IBM Corporation, Armonk, NY) and GraphPad Prism 5 (GraphPad Software, Inc, La Jolla, CA). Results are presented as means (95% confidence interval [CI]) if normally distributed or geometric means (95% CI) if non-normally distributed. Normality was tested by using the Kolmogorov-Smirnov test. Non-normally distributed values were logarithmically transformed before statistical analysis. Linear mixed models (LMM) with repeated measures followed by Bonferroni correction for multiple comparisons were used to compare iron absorption and utilization, and iron metabolism and inflammation indices between the 3 time points when the isotopes were administered. Additional LMM with repeated measures followed by Bonferroni correction for multiple comparisons were run for the iron metabolism and inflammation indices including all time points from baseline up to 26 weeks. The repeated covariance type in the LMM (ie, scaled identity, compound symmetry, diagonal or unstructured) was chosen based on the variance at each time point and the covariance between time points.
We used multiple linear regression analyses on hepcidin, reticulocytes, iron utilization, and iron absorption at the beginning of intensive phase treatment (week 0 + 2), during intensive phase treatment (week 4, 6 + 8), and during continuation phase treatment (week 10, 12 + 24). We sequentially added known predictors of the dependent variable to assess the relative strengths of the opposing effects of inflammation (IL-6) and anemia/hypoxia (ERFE). We only added one inflammatory predictor and one iron metabolism/hypoxia predictor to avoid collinearity between predictors. For normally distributed values after log-transformation, Pearson correlations were used. Spearman’s ρ correlations were used for values still non-normally distributed after log-transformation. A value of P < .05 was considered statistically significant.
Results
Twenty-seven patients with recently diagnosed tuberculosis were screened (4 female subjects, 23 male subjects) (Figure 1). Eight subjects were excluded, mainly because of HIV positivity (n = 4). Nineteen subjects were enrolled (3 women and 16 men), and their mean age (range) was 31.1 (18-45) years. At baseline, 5 subjects had strongyloidiasis and 2 had hookworm infection, which were treated. One man withdrew after 7 weeks because he lost interest in the study. Eight subjects were still sputum smear-positive after intensive phase treatment; administration of the second isotope was therefore done at 12 weeks. Two of these patients were still sputum smear-positive at 12 weeks but were smear-negative at 20 weeks. At 20 and 24 weeks, all participants were smear-negative. There was one case of severe malaria between 24 and 26 weeks, which was treated. Eighteen subjects completed the study and were included in the data analyses.
Iron metabolism and inflammation indices when the oral and intravenous iron tracers were administered are shown in Table 1. The pattern of these indices over the study is shown in Figures 2 to 4.
Body mass index, iron metabolism, and inflammation indices in patients with tuberculosis (N = 18) at the 3 time points when oral and intravenous iron tracers were administered
| Indices | Before treatment | After intensive treatment* | Completion of treatment† |
|---|---|---|---|
| Body mass index, kg/m2 | 19.0 (17.2-20.9) | 20.3 (18.5-22.2)‡ | 21.5 (19.7-23.4)‡,§§ |
| Hemoglobin, g/dL | 11.1 (10.2-12.0) | 12.8 (11.8-13.7)‡ | 13.9 (12.8-15.0)‡‡, †† |
| Anemia‖, n (%) | 16 (89%) | 9 (50%) | 4 (22%) |
| Iron-deficiency anemia¶, n (%) | 5 (28%) | 4 (22%) | 3 (17%) |
| Anemia of inflammation#, n (%) | 11 (61%) | 5 (28%) | 1 (6%) |
| Reticulocytes, % | 0.98 (0.81-1.17) | 0.92 (0.73-1.14) | 0.83 (0.69-1.00) |
| MCV, fL | 74.1 (69.8-78.4) | 75.8 (72.4-79.1) | 77.3 (73.8-80.8)** |
| MCH, pg | 24.2 (22.5-25.9) | 24.5 (22.9-26.1) | 25.7 (23.9-27.5)**, †† |
| MCHC, g/dL | 32.6 (31.7-33.5) | 32.3 (31.2-33.4) | 33.1 (31.9-34.3) |
| Serum ferritin, μg/L | 160.7 (128.8-200.6) | 73.1 (44.3-120.6)‡ | 51.7 (32.2-82.9)‡ |
| Soluble TfR, mg/L | 7.3 (6.3-8.4) | 6.9 (5.9-8.0) | 6.9 (5.5-8.8) |
| Serum iron, μg/mL | 0.34 (0.26-0.45) | 0.50 (0.40-0.63) | 0.76 (0.57-1.01)‡, §§ |
| Transferrin saturation, % | 10.9 (8.4-14.3) | 15.0 (11.4-19.7) | 21.3 (16.4-27.8)** |
| Hepcidin, nM | 21.4 (14.7-31.2) | 3.3 (1.5-7.2)‡ | 1.6 (0.8-3.3)‡ |
| EPO, mIU/mL | 14.4 (10.3-20.0) | 9.4 (6.7-13.4)‡‡ | 9.4 (6.2-14.4)‡‡ |
| ERFE, pg/mL | 130.1 (65.2-259.6) | 45.4 (22.6-91.5)** | 41.2 (16.2-104.5)** |
| IL-6, pg/mL | 34.8 (22.2-54.5) | 6.0 (3.7-9.8)‡ | 1.8 (1.1-2.9)‡, §§ |
| IL-6 >8.87 pg/mL, n (%) | 16 (89%) | 10 (56%) | 1 (6%) |
| C-reactive protein, mg/L | 62.5 (37.4-104.7) | 10.3 (4.8-22.3)‡ | 2.3 (1.2-4.4)‡, §§ |
| C-reactive protein >5 mg/L, n (%) | 17 (94%) | 13 (72%) | 6 (33%) |
| α1-glycoprotein, g/L | 3.5 (3.0-4.0) | 1.0 (0.8-1.4)‡ | 0.6 (0.5-0.7)‡,§§ |
| α1-glycoprotein >1 g/L, n (%) | 18 (100%) | 12 (67%) | 3 (17%) |
Values are geometric mean (95% CI) except for hemoglobin, mean corpuscular volume (MCV), mean corpuscular hemoglobin (MCH) and mean corpuscular hemoglobin concentration (MCHC), which are mean (95% CI) or unless otherwise stated. P values derived from LMM with repeated measures followed by Bonferroni correction for multiple-comparison testing.
TfR, transferrin receptor.
Patients who were tuberculosis sputum-negative at the end of the intensive phase received the second iron isotope administration at study week 8. Patients who were still tuberculosis sputum-positive at study week 8 received the second iron isotope administration at study week 12.
Completion of treatment was at study week 24.
P < .001significantly different from before treatment.
Anemia defined as Hb <120 g/L in female subjects and <130 g/L in male subjects.
Iron-deficiency anemia was defined as Hb <120 g/L (female subjects) or <130 g/L (male subjects) and sTfR >8.3 μg/mL and/or SF <30 μg/L, although these indexes were likely confounded by inflammation.
Anemia of inflammation defined as Hb <120 g/L in female subjects and <130 g/L in male subjects and sTfR <8.3 μg/mL and SF >30 μg/L.
P < .01 significantly different from before treatment.
P < .05 significantly different from after intensive treatment.
P < .05 significantly different from before treatment.
P < .001; significantly different from after intensive treatment.

Inflammation indices in patients treated for tuberculosis (N = 18) before (0 weeks) and during intensive (2-8 weeks) and continuation (10-24 weeks) phase antituberculosis treatment, as well as after a 2-week follow-up (26 weeks). (A) IL-6. (B) C-reactive protein. (C) α1-acid-glycoprotein. Graphs show geometric mean and 95% CI. Different time points were compared by using LMM with repeated measures followed by Bonferroni correction for multiple-comparison testing. Time points without any common letter significantly differ from each other (P < .05).
Inflammation indices in patients treated for tuberculosis (N = 18) before (0 weeks) and during intensive (2-8 weeks) and continuation (10-24 weeks) phase antituberculosis treatment, as well as after a 2-week follow-up (26 weeks). (A) IL-6. (B) C-reactive protein. (C) α1-acid-glycoprotein. Graphs show geometric mean and 95% CI. Different time points were compared by using LMM with repeated measures followed by Bonferroni correction for multiple-comparison testing. Time points without any common letter significantly differ from each other (P < .05).
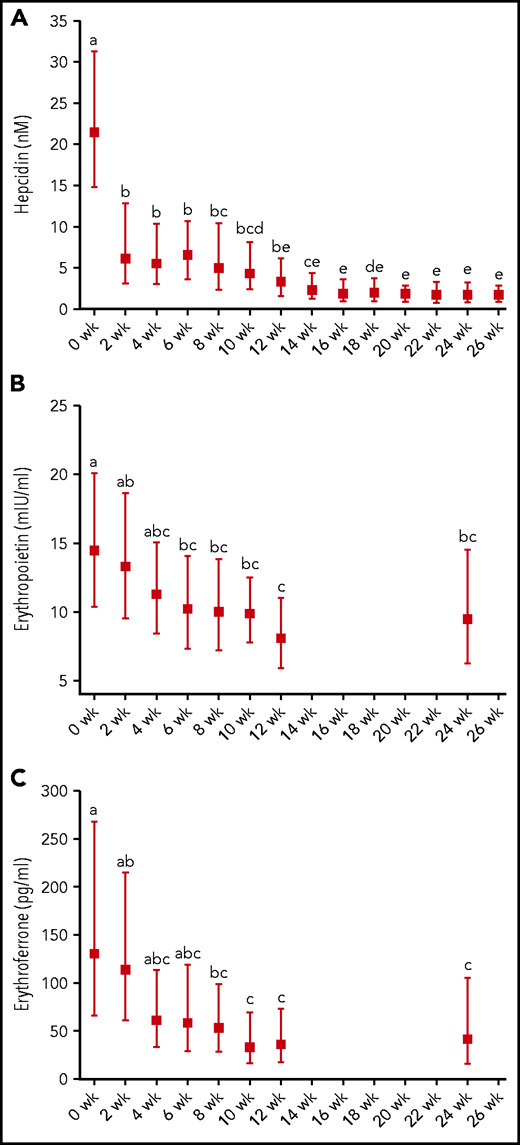
Hepcidin, EPO, and ERFE concentrations in patients treated for tuberculosis (N = 18) before (0 weeks) and during intensive (2-8 weeks) and continuation (10-24 weeks) phase antituberculosis treatment as well as after a 2-week follow-up (26 weeks). (A) Hepcidin. (B) Erythropoietin. (C) Erythroferrone. Graphs show geometric mean and 95% CI. Different time points were compared by using LMM with repeated measures followed by Bonferroni correction for multiple-comparison testing. Time points without any common letter significantly differ from each other (P < .05).
Hepcidin, EPO, and ERFE concentrations in patients treated for tuberculosis (N = 18) before (0 weeks) and during intensive (2-8 weeks) and continuation (10-24 weeks) phase antituberculosis treatment as well as after a 2-week follow-up (26 weeks). (A) Hepcidin. (B) Erythropoietin. (C) Erythroferrone. Graphs show geometric mean and 95% CI. Different time points were compared by using LMM with repeated measures followed by Bonferroni correction for multiple-comparison testing. Time points without any common letter significantly differ from each other (P < .05).
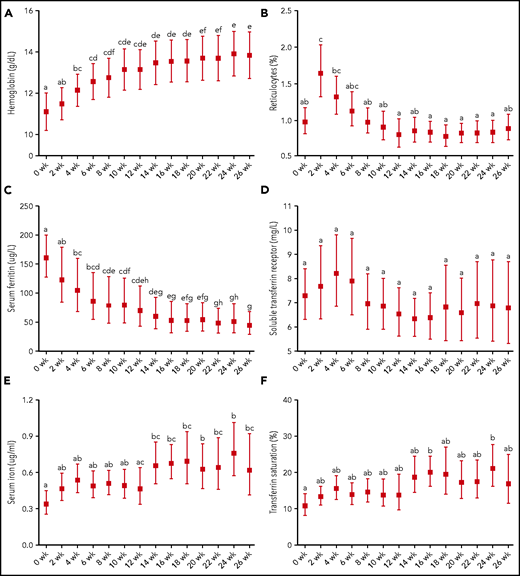
Hb, reticulocytes, and iron status indices in patients treated for tuberculosis (N = 18) before (0 weeks) and during intensive (2-8 weeks) and continuation (10-24 weeks) phase antituberculosis treatment as well as after a 2-week follow-up (26 weeks). (A) Hemoglobin. (B) Reticulocytes. (C) Serum ferritin. (D) Soluble transferrin receptor. (E) Serum iron. (F) Transferrin saturation. Graphs show geometric mean and 95% CI, except for Hb, which is presented as mean 95% CI. Different time points were compared by using LMM with repeated measures followed by Bonferroni correction for multiple-comparison testing. Time points without any common letter significantly differ from each other (P < .05).
Hb, reticulocytes, and iron status indices in patients treated for tuberculosis (N = 18) before (0 weeks) and during intensive (2-8 weeks) and continuation (10-24 weeks) phase antituberculosis treatment as well as after a 2-week follow-up (26 weeks). (A) Hemoglobin. (B) Reticulocytes. (C) Serum ferritin. (D) Soluble transferrin receptor. (E) Serum iron. (F) Transferrin saturation. Graphs show geometric mean and 95% CI, except for Hb, which is presented as mean 95% CI. Different time points were compared by using LMM with repeated measures followed by Bonferroni correction for multiple-comparison testing. Time points without any common letter significantly differ from each other (P < .05).
At baseline, all participants had inflammation (Table 1). α1-acid-glycoprotein, C-reactive protein (both P < .05), and IL-6 (P < .001) decreased significantly at 2 weeks, and inflammation further resolved during treatment (Figure 2).
Hepcidin was markedly high before treatment, decreased by ∼70% after only 2 weeks of treatment (P < .001), and more gradually decreased during the remainder of treatment (Figure 3). EPO and ERFE were also elevated at baseline and began falling during early treatment, but in contrast to hepcidin, did not exhibit a statistically significant decrease until 6 and 8 weeks, respectively (both P < .05); afterward, EPO and ERFE did not show a significant further decrease.
The majority of patients were anemic at baseline (Table 1). Hb significantly increased at 4 weeks (P < .05) and continued to increase until treatment completion (Figure 4). Reticulocytosis peaked at 2 weeks (P < .01). SF fell steadily over the study and was significantly lower after intensive phase treatment and at completion of treatment compared with baseline (P < .001). In contrast, there were no significant differences in sTfR over the study, but variability was high. After 14 weeks, serum iron significantly increased (P < .001). TSAT was increased at treatment completion compared with baseline (P < .01).
Before treatment, geometric mean (95% CI) fractional iron absorption (percentage) was negligible, at 0.8 (0.5-1.4) (Figure 5). After intensive phase treatment and at completion of treatment, fractional iron absorption (percentage) increased 10-fold and nearly 20-fold, to 8.0 (4.6-13.2) and 15.2 (10.5-21.8), respectively (both P < .001 compared with baseline). In contrast, geometric mean (95% CI) erythrocyte iron utilization (percentage), although 15% higher during baseline infection, did not significantly differ at these 3 time points: values were 80.2 (71.4-89.9), 68.3 (54.8-85.0), and 69.9 (63.0-77.7). Following the concentration of 54Fe (administered at baseline; n = 15) in blood over the remainder of the study, the mean (95% CI) slope of the tracer concentration (parts per million/week) was significantly steeper during the intensive phase treatment, at −2.6 (−3.7 to −1.5) than during the continuation phase, at −0.1 (−1.3 to 1.1) (P < .01). This indicates greater dilution of the tracer concentration by native iron entering the red blood cell mass during enhanced erythropoiesis in the intensive phase. The slope during the continuation phase was not significantly different from 0 (P = .8).
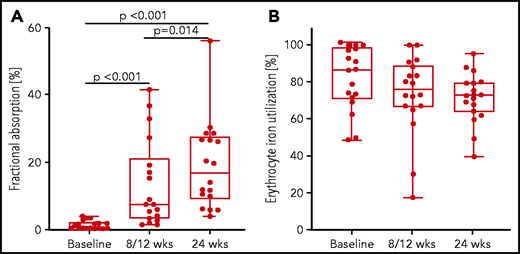
Fractional iron absorption and erythrocyte iron utilization in patients with tuberculosis (N = 18) before (baseline), after intensive antituberculosis treatment (8/12 weeks), and after completion of antituberculosis treatment (24 weeks). Box plots show the median and 25th and 75th percentiles with whiskers representing the highest and lowest values. Iron absorption and utilization at the different time points were compared by using LMM with repeated measures followed by Bonferroni correction for multiple comparisons.
Fractional iron absorption and erythrocyte iron utilization in patients with tuberculosis (N = 18) before (baseline), after intensive antituberculosis treatment (8/12 weeks), and after completion of antituberculosis treatment (24 weeks). Box plots show the median and 25th and 75th percentiles with whiskers representing the highest and lowest values. Iron absorption and utilization at the different time points were compared by using LMM with repeated measures followed by Bonferroni correction for multiple comparisons.
The main opposing determinants of hepcidin concentrations during infection and treatment were ERFE and IL-6 concentrations (Table 2). In regressions, ERFE was negatively associated (P < .05) and IL-6 was positively associated (P < .02) with hepcidin at the beginning of the intensive phase treatment (R2= 0.438) and during intensive phase treatment (R2= 0.329) and during the continuation phase treatment (R2= 0.280). Notably, compared with the beginning of the intensive phase treatment, during treatment, as inflammation resolved, the association with IL-6 weakened, while the association with ERFE strengthened.
Associations between IL-6 (reflecting inflammation), ERFE (likely reflecting tissue hypoxia), serum hepcidin, and reticulocytosis in patients with tuberculosis (N = 18) at the beginning of intensive phase antituberculosis treatment, and during intensive and continuation phases of antituberculosis treatment
| B | Standard error of B | Standardized β | |
|---|---|---|---|
| Beginning of intensive phase treatment | |||
| Hepcidin: R2 = 0.438 | |||
| ERFE | −0.347 | 0.167 | −0.357 (P = .046) |
| IL-6 | 0.955 | 0.198 | 0.830 (P < .001) |
| Reticulocytes: R2 = 0.411 | |||
| ERFE | 0.271 | 0.064 | 0.757 (P < .001) |
| IL-6 | −0.319 | 0.076 | −0.750 (P < .001) |
| During intensive phase treatment | |||
| Hepcidin: R2 = 0.329 | |||
| ERFE | −0.323 | 0.143 | −0.315 (P = .028) |
| IL-6 | 0.829 | 0.167 | 0.690 (P < .001) |
| Reticulocytes: R2 = 0.176 | |||
| ERFE | 0.138 | 0.048 | 0.440 (P = .006) |
| IL-6 | −0.014 | 0.056 | −0.038 |
| During continuation phase treatment | |||
| Hepcidin: R2 = 0.280 | |||
| ERFE | −0.471 | 0.109 | −0.540 (P < .001) |
| IL-6 | 0.329 | 0.136 | 0.302 (P = .019) |
| Reticulocytes: R2 = 0.039 | |||
| ERFE | 0.057 | 0.039 | 0.208 |
| IL-6 | −0.022 | .049 | −0.065 |
Analyzed using linear regression analyses with serum hepcidin and reticulocytes as dependent variables. R2= variance explained by the predictor variables.
During baseline infection, hepcidin was negatively correlated with serum iron (rs = –0.481; P = .003), indicating iron sequestration, and showed a weak correlation with TSAT (rs = –0.322; P = .059). Subsequently, during intensive phase treatment and continuation phase treatment, there were no significant correlations between hepcidin and serum iron or TSAT.
Elevated ERFE concentrations during intensive phase treatment were associated with greater reticulocytosis and Hb repletion. At weeks 2, 4, and 6, ERFE positively correlated with the peak of reticulocytosis (rs = 0.423, P = .091; rs = 0.481, P = .043; and rs = 0.466, P = .051, respectively). In regressions controlling for inflammation (IL-6) (Table 2), ERFE was positively associated with reticulocytosis at the beginning of the intensive phase treatment (P < .001) and during intensive phase treatment (P = .006). Moreover, ERFE at baseline and at 2 weeks positively correlated with the slope of the Hb increase over the intensive phase treatment (rs = 0.479, P = .044; and rs = 0.479, P = .052). In regressions, hepcidin was significantly correlated with iron absorption at all 3 measured time points (β = –0.817, P < .001; β = –0.783, P < .001; and β = –0.619, P = .006) explaining 66.7%, 61.3%, and 38.3% of the variability in iron absorption.
Discussion
Our study provides new insights into iron homeostasis during tuberculosis-associated anemia of inflammation and its resolution. Our 3 main findings are: (1) in anemic patients with tuberculosis, inflammation predominates over tissue hypoxia and resulting high EPO and ERFE concentrations, to drive up hepcidin, resulting in iron sequestration and negligible dietary iron absorption but without affecting erythrocyte iron utilization; (2) treatment of tuberculosis rapidly reduces inflammation and decreases hepcidin, and reduces ERFE and EPO, but ERFE and EPO remain mildly elevated for several weeks during reticulocytosis and Hb recovery; and (3) dietary iron absorption partially recovers but remains reduced after intensive phase treatment and only fully recovers at completion of treatment.
The baseline profile in our anemic subjects (hypoferremia and low transferrin saturation but elevated SF and elevated hepcidin concentrations) is characteristic of anemia of inflammation.39 The main opposing determinants of hepcidin during infection were ERFE and IL-6, but at baseline inflammation predominated, and hepcidin was high. After only 2 weeks of treatment, there was a sharp drop in inflammation signaling to hepcidin, as indicated by significant decreases in IL-6 and hepcidin. This finding is consistent with previous studies in which tuberculosis treatment decreased inflammation and hepcidin.7 The resulting mobilization of sequestered iron allowed a surge in reticulocytosis at 2 weeks, and by 4 weeks, there was a significant rise in Hb. A reduction in the inflammatory suppression of erythropoiesis may have also contributed to anemia recovery. Notably, there was no statistically significant decrease in EPO or ERFE until week 6 and 8, respectively. Higher ERFE during treatment was negatively correlated with hepcidin and positively correlated with reticulocytosis and Hb repletion. These findings are consistent with a role for ERFE in the resolution of anemia of inflammation, as EPO stimulates synthesis of ERFE and ERFE suppresses hepcidin.16,40 To our knowledge, this is the first time an increase in ERFE has been described in anemia of inflammation due to chronic infection in humans. It is also consistent with data from a mouse model of anemia of inflammation caused by heat-killed Brucella abortus, in which iron mobilization and increased absorption mediated by ERFE suppression of hepcidin had a net beneficial effect by promoting erythropoiesis and recovery from anemia.17 Thus, during treatment, maintaining elevated ERFE concentrations for several weeks after resolution of inflammation may help suppress hepcidin, ensuring iron mobilization for recovery from anemia of inflammation. Hepcidin modestly decreased after week 8, suggesting other factors beyond ERFE, such as depletion of iron stores, also contributed.
The current study is the first to directly quantify human dietary iron absorption and erythrocyte iron utilization during active tuberculosis and its resolution. The remarkable near absence of dietary iron absorption during active tuberculosis, despite anemia and hypoxia, suggests systemic signaling to the enterocyte through the hepcidin–ferroportin axis induced by inflammation10,12 predominates over local enterocyte regulation through intestinal hypoxia-inducible factor-2α,41 resulting in negligible iron efflux from enterocytes. We anticipated lower rates of utilization, as inflammatory cytokines and hypoferremia can directly suppress EPO synthesis and erythropoiesis and reprogram myelopoiesis,15,42,43 and in our data, IL-6 was negatively correlated with utilization during infection. However, there was no significant difference in the fraction of available iron used for erythropoiesis during active tuberculosis compared with after completion of treatment. This suggests that the anemia in our subjects was primarily due to insufficient iron reaching the bone marrow, likely due to hepcidin-mediated iron sequestration, proportionally decreasing erythropoiesis.
Our data provide evidence for guidelines on iron treatment of tuberculosis-associated anemia. A challenge in care of anemic tuberculosis patients is deciding if (and when) they should be provided additional iron. Increased dietary iron uptake may promote tuberculosis growth and increase morbidity,25 but iron deficiency and anemia may reduce treatment efficacy3 and increase mortality.26,27 In our study, iron absorption during active tuberculosis was negligible (<1%) and was still reduced 50% after intensive treatment. Despite this, mobilization of sequestered iron was able to support a rapid increase in erythropoiesis during early treatment, as indicated by reticulocytosis, dilution of the circulating tracer concentration, and Hb repletion. Only at completion of treatment did fractional iron absorption increase to a level that would allow iron to be well absorbed (15% of the dose was absorbed).44 Despite no iron treatment, only 4 subjects remained mildly anemic at treatment completion. Our results suggest that iron supplementation before and during treatment of tuberculosis is likely to be ineffective, and, at least in our patients, unnecessary, as mobilization of sequestered iron provided ample iron for erythropoiesis and Hb recovery, as in previous studies.7,45 In a previous placebo-controlled trial of iron supplementation in anemic tuberculosis patients given treatment, Hb and red blood cell indices significantly improved in the iron groups after 1 month compared with placebo, but this effect disappeared after 2 and 6 months of treatment with no differences between the placebo and iron groups.45 In that study, there were no indications that iron supplementation worsened clinical outcomes or that better hematologic indices at 1 month improved disease outcomes. Our results also argue against recommendations to begin supplementation after intensive phase treatment when sputum smears turn negative, because in our study, iron absorption at that point was still reduced. Our data suggest that iron supplementation should only be given to tuberculosis patients who remain anemic after completion of treatment. Similarly, in a previous study in Beninese women, iron absorption, but not iron utilization, improved significantly after treatment of afebrile malaria, showing that infection-related inflammation is a major determinant of iron absorption.29 Providing iron-rich foods, particularly those containing well-absorbed heme iron,47 may also be important in Hb recovery during treatment of tuberculosis, and our data suggest these dietary sources of iron might be better absorbed and particularly useful during the later stages of treatment.
We assume that most of the intravenous tracer was incorporated in the first few days after administration. However, because we used an incorporation period of 14 days, this approach may have allowed the treatment to already greatly lower inflammation and may have reduced our ability to detect a potential effect of active infection on iron utilization. Our findings suggest that intravenous iron might be more effective than oral iron supplements in anemic, iron-deficient tuberculosis patients. Intravenous iron may be effective in the treatment of combined anemia of inflammation and iron-deficiency anemia in other inflammatory disorders.46,47 However, considering observational studies showing increased tuberculosis mortality with elevated splenic iron48 and mice studies in which iron excess enhanced Mycobacterium growth,23,24 further research on the risks and benefits of oral and intravenous iron given during treatment are needed. Because Mycobacterium can acquire iron from intracellular and extracellular sources,49,50 both iron sequestration and restricting intracellular iron may be important in reducing iron-related promotion of Mycobacterium growth.25-27,48
Our study has several strengths. Using a prospective design, we intensively studied a well-defined group of tuberculosis patients free of HIV. We performed assessments of iron metabolism every 2 weeks, including measurement of ERFE, over 6 months of treatment. Compared with previous studies,7,45 these repeated measurements provide greater granularity in describing the time course of iron metabolism indices during resolution of tuberculosis-associated anemia of inflammation. We administered oral and intravenous stable isotopes to quantify iron absorption and erythrocyte iron utilization during infection and twice during treatment. Our study also has limitations. We studied a small number of subjects, but our sample size met the requirements of our power calculation and was large enough to clearly distinguish changes in iron homeostasis during treatment. Nevertheless, larger studies may be required to detect how much longer ERFE remains elevated compared with hepcidin, and the iron dynamics reported in this study may not necessarily apply to other infections or inflammatory disorders. We suggest iron supplements would be of little value until completion of treatment based on our isotopic studies, but we did not verify this with a trial of iron supplements to judge efficacy.
In summary, our study documents the dynamic changes in iron status indices, hepcidin, ERFE, EPO, inflammation, and erythropoiesis during resolution of anemia of inflammation caused by tuberculosis. Our data suggest a potential role for ERFE in recovery from tuberculosis-associated anemia of inflammation, but further experimental studies are needed to clarify the role of ERFE in this regard. Our findings may help inform evidence-based guidelines for rational iron treatment of tuberculosis-related anemia. However, further clinical trials are needed to determine the risks, benefits, and optimal timing of iron supplementation in tuberculosis patients with both anemia of inflammation and iron-deficiency anemia.
Acknowledgments
The authors thank the subjects for their participation. At the Bagamoyo Research and Training Center (Ifakara Health Institute), they thank Beno Mbeya, Edwin Mutabazi, and Tresphory Zumba in their role as physicians taking care of the subjects during the visits; Martha Kiiya, Rehema Dangwa, and Faith Akut in their role as study nurses responsible for the biological sampling and administration of isotopic tracers, Florence Makame in her role as study administrator, Mwanaidi Ramadhani for preparing the test meals, Eusebio Tiberius Lusuva in his role as study driver transporting the subjects to the visits, and the laboratory staff for their assistance. They also thank Adam Krzystek (ETH Zurich) for laboratory assistance, and Elizabeta Nemeth and Tomas Ganz (University of California Los Angeles) for the measurement of ERFE.
Funding for the study was provided by ETH Zurich.
Authorship
Contribution: C.I.C., D.M., L.F., and M.B.Z. designed research; C.I.C., T.Z., F.M., and J.H. conducted research; C.I.C., C.Z., D.W.S., N.U.S., and M.B.Z. analyzed data; C.I.C., N.U.S., and M.B.Z. wrote the first draft of the paper; C.I.C. and M.B.Z. had primary responsibility for final content; and all authors edited the paper and approved the final version of the paper.
Conflict-of-interest disclosure: The authors declare no competing financial interests.
Correspondence: Michael Zimmermann, Human Nutrition, ETH Zurich, Schmelzbergstrasse 7, LFV D20, 8092 Zurich, Switzerland; e-mail: michael.zimmermann@hest.ethz.ch.
Requests for original data may be submitted to the corresponding author (Michael Zimmermann; e-mail: michael.zimmermann@hest.ethz.ch).
The online version of this article contains a data supplement.
There is a Blood Commentary on this article in this issue.
The publication costs of this article were defrayed in part by page charge payment. Therefore, and solely to indicate this fact, this article is hereby marked ”advertisement“ in accordance with 18 USC section 1734.

This feature is available to Subscribers Only
Sign In or Create an Account Close Modal