Key Points
Spontaneously regressed tumors are composed of a formerly proliferating CLL clone that has transitioned into a quiescent state.
A microenvironmental stimulation change on an indolent genomic background state underpins clonal attrition in spontaneous CLL regression.

Abstract
Spontaneous regression is a recognized phenomenon in chronic lymphocytic leukemia (CLL) but its biological basis remains unknown. We undertook a detailed investigation of the biological and clinical features of 20 spontaneous CLL regression cases incorporating phenotypic, functional, transcriptomic, and genomic studies at sequential time points. All spontaneously regressed tumors were IGHV-mutated with no restricted IGHV usage or B-cell receptor (BCR) stereotypy. They exhibited shortened telomeres similar to nonregressing CLL, indicating prior proliferation. They also displayed low Ki-67, CD49d, cell-surface immunoglobulin M (IgM) expression and IgM-signaling response but high CXCR4 expression, indicating low proliferative activity associated with poor migration to proliferation centers, with these features becoming increasingly marked during regression. Spontaneously regressed CLL displayed a transcriptome profile characterized by downregulation of metabolic processes as well as MYC and its downstream targets compared with nonregressing CLL. Moreover, spontaneous regression was associated with reversal of T-cell exhaustion features including reduced programmed cell death 1 expression and increased T-cell proliferation. Interestingly, archetypal CLL genomic aberrations including HIST1H1B and TP53 mutations and del(13q14) were found in some spontaneously regressing tumors, but genetic composition remained stable during regression. Conversely, a single case of CLL relapse following spontaneous regression was associated with increased BCR signaling, CLL proliferation, and clonal evolution. These observations indicate that spontaneously regressing CLL appear to undergo a period of proliferation before entering a more quiescent state, and that a complex interaction between genomic alterations and the microenvironment determines disease course. Together, the findings provide novel insight into the biological processes underpinning spontaneous CLL regression, with implications for CLL treatment.
Introduction
Spontaneous tumor regression, manifested by a sustained reduction or disappearance of the malignant clone without treatment, is an uncommon but intriguing phenomenon.1-6 In chronic lymphocytic leukemia (CLL), spontaneous disease regression is estimated to occur in 1% to 2% of patients,7,8 although CLL cells do remain at a low level despite the resolution of clinical features.7-9 Several case reports of spontaneous CLL regression have been published,9-11 as well as 2 case series that together describe a total of 19 cases.7,8
Spontaneous tumor regression has been linked in some cases to infection, blood transfusion, or secondary malignancy, and it has been suggested that these may reflect induction of a proinflammatory state.2,11 However, these associations are uncommon and, as such, the etiology of spontaneous regression is unclear. A study of 9 cases of spontaneously regressing CLL showed that tumors lacked CD38 and ζ-chain-associated protein kinase 70 expression, and all 7 cases that underwent IGHV sequencing revealed an IGHV-mutated genotype with IGHV3 usage in 6 of these.8
Improved understanding of the biological basis underlying spontaneous CLL regression is important for elucidating CLL pathobiology and could help to inform therapeutic management. Multiple lines of evidence now suggest that the clinical outcomes for patients with CLL is shaped both by the biological properties of the malignant clone and its interaction with the microenvironment.12 Disease progression is often accompanied by increased CLL migration to proliferation centers with resultant B-cell receptor (BCR) engagement and clonal proliferation.13-15 Moreover, the emergence of mutations and genomic complexity may result in the outgrowth of CLL cells with greater proliferative and survival advantage.16-18 These changes, facilitated by impaired tumor immunity and a microenvironment conducive to CLL proliferation and apoptotic evasion,19-23 may shift the balance of CLL turnover in favor of clonal expansion. As such, we postulated that spontaneous CLL regression may reflect the integration of a range of processes including BCR signaling and proliferation, apoptosis, genetic heterogeneity, and host immunity.
To evaluate this hypothesis, we analyzed sequential samples from 20 patients who had undergone spontaneous CLL regression. Our analysis revealed unique features providing insight into the biology of this phenomenon.
Patients, material, and methods
Patient samples
We reviewed all 1425 patients with untreated CLL who attended 4 UK hemato-oncology centers between 2010 and 2016. We identified complete spontaneous CLL regression on the basis of a sustained reduction in absolute lymphocyte count (ALC) to below 4 × 10⁹/L with complete resolution of CLL-related symptoms, anemia, thrombocytopenia, and clinically detectable adenopathy. Identification of partial spontaneous regression was based on sustained reduction of lymphocytosis by ≥50% from the highest level, with regressing nodal disease. We excluded subjects with concurrent infections or second malignancies, or those who were receiving myelosuppressive or immunosuppressive therapies, including systemic corticosteroids, for any indication immediately preceding or coinciding with the onset of CLL regression. In 2 individuals, the onset of CLL regression predated the diagnosis of a second malignancy by ≤5 years (CLL18-19), which could impact immune responses contributing to CLL regression. However, upon subsequent analysis, no distinctive features were apparent between these 2 and other patients, thus, they were incorporated into the rest of the cohort.
For comparison, CLL treatment-naive, Binet stage–, age- and sex-matched indolent CLL patients as well as age- and sex-matched progressive CLL patients and healthy controls were recruited. Indolent cases were further cytomegalovirus status matched for T-cell studies. To reflect real-world CLL populations, groups were not matched for IGHV mutational status. However, subgroup analysis excluding the IGHV unmutated indolent cases did not affect the results. Indolent disease and healthy controls were recruited locally, whereas progressive samples were sourced from multicenter trials and obtained immediately before treatment (supplemental Table 1, available on the Blood Web site). Indolent CLL was defined as Binet stage A disease with a ≥2-year lymphocyte doubling time monitored over ≥5 years. Samples were obtained with written patient consent and institutional ethical approval.
Cell separation
CLL cells (>95% CD19+CD5+ cells; supplemental Table 2), for all non–fluorescence-activated cell sorting (FACS)-based assays, were isolated using a magnetic-activated cell sorting procedure (Miltenyi Biotec, Surrey, United Kingdom), as detailed in supplemental Methods.
Flow cytometry
Extracellular and intracellular staining procedures are detailed in supplemental Methods and supplemental Table 3.
Nucleic acid extraction
Telomere length, genomic, and transcriptomic studies were performed on DNA and messenger RNA (mRNA) extracted from isolated CLL cells.
Telomere length, telomerase, and replicative senescence assays
XpYp chromosome-specific single-telomere length analysis was performed as previously described.24 Telomerase activity was assessed using the TeloTAGGG telomerase polymerase chain reaction enzyme-linked immunosorbent assay (Roche, Sussex, United Kingdom). Replicative senescence was evaluated using β-galactosidase staining (Cell Signaling Technology, Beverly, MA). Details are in supplemental Methods.
IGH sequencing
IGH sequencing was performed as described in supplemental Methods.25
Single-nucleotide polymorphism array analysis, WES, and RNA sequencing
Single-nucleotide polymorphism array analysis and whole-exome sequencing (WES) was performed on CLL cells, with isolated granulocyte26 or T-cell fraction as germline control. There was no detectable IGHV rearrangement in the germline fractions (supplemental Figure 1). Details of sample preparation, bioinformatics analysis, and result validation are provided in supplemental Methods.
Results
Spontaneous disease regression occurs in <2% of patients with CLL and is seen exclusively in tumors with mutated IGHV
We identified 20 individuals who fulfilled the criteria for spontaneous CLL regression, a prevalence of 1.4%, which approximates well with reported frequencies.7,8 Eleven subjects underwent complete spontaneous regression (CLL01-11) and 6 underwent partial regression (CLL12-17). In 2 individuals, onset of CLL regression predated the diagnosis of a second malignancy by ≤5 years (CLL18-19). In addition, 1 patient (CLL20) exhibited complete CLL regression for 14 years but subsequently relapsed (Figure 1; Table 1).
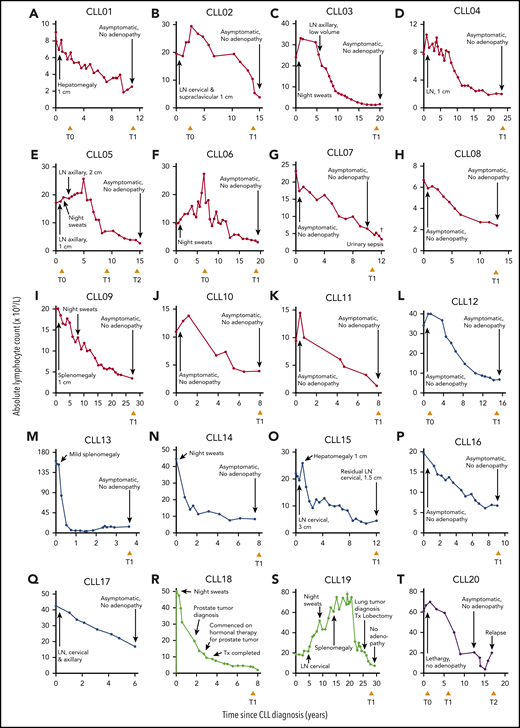
Clinical features of 20 spontaneous CLL regression cases. Spontaneous CLL regression cases were categorized into 4 groups: (A-K) complete spontaneous regression (red curves), (L-Q) partial spontaneous regression (blue curves), (R-S) spontaneous regression occurring prior to a second malignancy (green curves), and (T) relapsed spontaneous regression (purple curves). The ALC for each patient is plotted against the time elapsed from the date of diagnosis. Clinical features are annotated, and the time of peripheral blood sampling is displayed at the bottom each chart. T0 represents the diagnostic time point, whereas T1 and T2 represent the regression time points, except in CLL20 where T2 represents the relapse time point. LN, lymphadenopathy (the measurement displayed corresponds to the size of the largest palpable node); Tx, treatment.
Clinical features of 20 spontaneous CLL regression cases. Spontaneous CLL regression cases were categorized into 4 groups: (A-K) complete spontaneous regression (red curves), (L-Q) partial spontaneous regression (blue curves), (R-S) spontaneous regression occurring prior to a second malignancy (green curves), and (T) relapsed spontaneous regression (purple curves). The ALC for each patient is plotted against the time elapsed from the date of diagnosis. Clinical features are annotated, and the time of peripheral blood sampling is displayed at the bottom each chart. T0 represents the diagnostic time point, whereas T1 and T2 represent the regression time points, except in CLL20 where T2 represents the relapse time point. LN, lymphadenopathy (the measurement displayed corresponds to the size of the largest palpable node); Tx, treatment.
Patients were followed for a median of 15.2 years (range, 3.6-30 years). Among complete regressors, CLL regression occurred over a median of 8.6 years (range, 5.3-26 years). At the time of study, lymphocytosis and CLL-related clinical features had been absent for a median of 2.7 years (range, 0.9-12 years) and were consistent with the significantly reduced tumor load; T-cell and natural killer (NK) numbers resembled normal levels (Table 2). There was no association between onset of regression and initiation of non-CLL-related medication for any patient (Table 1). None of the patients were taking nonprescriptive medication known to influence CLL course, immediately preceding or coinciding with the onset of CLL regression, nor were they frequent green tea consumers. However, the potential contribution of other lifestyle factors, holistic or dietary, to regression cannot be discounted. All subjects except 1 (CLL07) were alive at the time of analysis. Importantly, a residual B-lymphocyte population with a CLL phenotype was identifiable by flow cytometry in all of the regression samples accounting for a median of 92.5% of total B cells (range, 71.6% to 99.8%; Figure 2A; Table 2).27
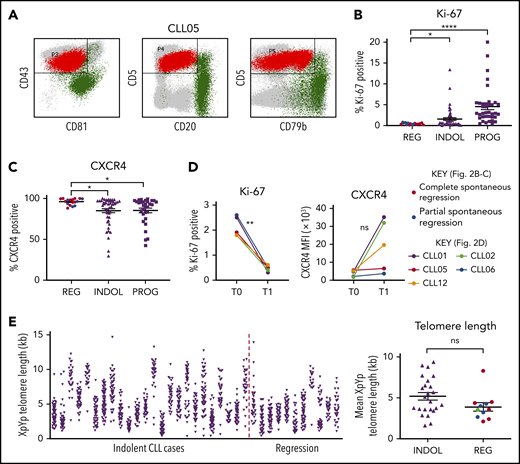
Spontaneously regressed CLL tumors are composed of a nonproliferating CLL clone that has previously undergone substantial cell division. (A) A CD19 gate was applied to the peripheral blood mononuclear cells (PBMCs) to select for CD19+ B lymphocytes (not shown). The CLL population (shown in red) could be distinguished from the nonmalignant B-lymphocyte population (shown in green) by their immunophenotype, as demonstrated by the example of CLL05. CLL cells exhibit high CD5 and CD43 but low CD20, CD79b, and CD81 expression, whereas nonmalignant B lymphocytes exhibit high CD20, CD79b, and/or CD81 expression. This methodology was used to determine the proportion of CLL cells within the B-lymphocyte population, the results of which are displayed in Table 2. (B-C) The gated CLL population of PBMCs was analyzed for the expression of Ki-67 and CXCR4. For each comparison, 17 spontaneous regression cases (REG) from the regression time point (T1) were compared against 54 indolent (INDOL) and 40 progressive (PROG) cases. Complete and partial spontaneous regression cases are represented by red and blue dots, respectively, as shown. Statistical significance was determined using 1-way analysis of variance (ANOVA) with Bonferroni post hoc analysis for cohort comparison and the 2-tailed paired Student t test for time point comparison. Statistical significance is indicated by *P < .05, **P < .01, and ****P < .0001. (D) Expression of Ki-67 and CXCR4 was compared between 2 sequential time points in individual spontaneous regression cases. T0 and T1 represent the diagnostic and the regression time point, respectively. Each colored line represents a specific case as indicated. (E) XpYp single-telomere length analysis was performed on sorted CD19+CD5+ CLLs to assess the telomere length of chromosomes Xp and Yp of CLL cells. Left panel, The telomere length distribution of the CD19+CD5+ sorted CLL Xp and Yp chromosomes in each case. Right panel, The mean CLL XpYp telomere length was compared between spontaneously regressed and indolent cases. Complete and partial spontaneous regression cases are represented by red and blue dots, respectively, as shown. Statistical significance was determined using the Student t test. ns, comparisons that are not statistically significant.
Spontaneously regressed CLL tumors are composed of a nonproliferating CLL clone that has previously undergone substantial cell division. (A) A CD19 gate was applied to the peripheral blood mononuclear cells (PBMCs) to select for CD19+ B lymphocytes (not shown). The CLL population (shown in red) could be distinguished from the nonmalignant B-lymphocyte population (shown in green) by their immunophenotype, as demonstrated by the example of CLL05. CLL cells exhibit high CD5 and CD43 but low CD20, CD79b, and CD81 expression, whereas nonmalignant B lymphocytes exhibit high CD20, CD79b, and/or CD81 expression. This methodology was used to determine the proportion of CLL cells within the B-lymphocyte population, the results of which are displayed in Table 2. (B-C) The gated CLL population of PBMCs was analyzed for the expression of Ki-67 and CXCR4. For each comparison, 17 spontaneous regression cases (REG) from the regression time point (T1) were compared against 54 indolent (INDOL) and 40 progressive (PROG) cases. Complete and partial spontaneous regression cases are represented by red and blue dots, respectively, as shown. Statistical significance was determined using 1-way analysis of variance (ANOVA) with Bonferroni post hoc analysis for cohort comparison and the 2-tailed paired Student t test for time point comparison. Statistical significance is indicated by *P < .05, **P < .01, and ****P < .0001. (D) Expression of Ki-67 and CXCR4 was compared between 2 sequential time points in individual spontaneous regression cases. T0 and T1 represent the diagnostic and the regression time point, respectively. Each colored line represents a specific case as indicated. (E) XpYp single-telomere length analysis was performed on sorted CD19+CD5+ CLLs to assess the telomere length of chromosomes Xp and Yp of CLL cells. Left panel, The telomere length distribution of the CD19+CD5+ sorted CLL Xp and Yp chromosomes in each case. Right panel, The mean CLL XpYp telomere length was compared between spontaneously regressed and indolent cases. Complete and partial spontaneous regression cases are represented by red and blue dots, respectively, as shown. Statistical significance was determined using the Student t test. ns, comparisons that are not statistically significant.
The sequence of the clonal IGHV rearrangement was determined in 19 tumors and found to be IGHV-mutated (M-CLL) in all instances (Table 2). A range of IGHV usage was observed, including IGHV3 in 12 cases, IGHV4 in 5 cases, and a single case each of IGHV1 and IGHV2. None exhibited stereotyped BCR usage.
Spontaneous regressed CLL tumors have undergone substantial cell division but gradually acquired a low proliferative phenotype
We analyzed the phenotypic features of the residual CLL clone in spontaneously regressed (n = 17), indolent (n = 54), and progressive (n = 40) tumors. We also examined for phenotypic changes occurring during spontaneous regression by comparing paired diagnostic and regression samples (n = 5). The relative accumulation or regression of a tumor reflects the balance between cellular proliferation and apoptosis.13,28 We therefore focused initially on the proliferative activity of the CLL clone. Spontaneously regressed CLL contained significantly fewer Ki-67–expressing tumor cells (<1%) than either indolent (median, 2.5%; P ≤ .05) or progressive (median, 5%; P ≤ .0001) CLL, indicating a very low level of clonal proliferation (Figure 2B). CLL cells that have recently exited proliferation centers and stopped receiving proliferation stimuli have low CXCR4 levels, which rapidly recover in the circulation.29-31 Consistent with 3.46-fold lower Ki-67 expression, we found significantly higher (1.12-fold; P ≤ .05) CXCR4 positivity on the CLL cells in spontaneously regressed compared with indolent cases (Figure 2C; supplemental Figure 2). In contrast, no significant differences were observed in the surface expression of CXCR5, CCR6, and CCR7 (supplemental Figure 3).
To investigate the proliferation history of spontaneously regressed CLL, we compared Ki-67 expression from paired diagnosis and regression samples. Ki-67 expression significantly reduced from diagnostic levels in all 5 patients with concomitant increased surface CXCR4 in 3 cases, suggesting the possibility of a lower proliferation rate during regression (Figure 2D). Additionally, the mean telomere length of spontaneously regressed CLL was found to be comparable to that of nonregressing indolent CLL and was generally <5 kb (Figure 2E), suggesting previous proliferation consistent with prior diagnosis of bona fide CLL.24,32 The clonal composition of the tumor was also assessed by IGH sequencing and revealed a single clonal population in each case (Table 2). This remained stable between diagnosis and regression, as evidenced by identical IGHV-D-J sequence and similar telomere length distribution (supplemental Figure 4). Taken together, our results demonstrate that spontaneously regressed CLL tumors comprise clones that have previously undergone substantial cell division but have subsequently acquired a phenotype of low proliferation.
CLL tumors undergoing spontaneous regression display weak BCR-signaling responses but retain high levels of Bcl-2
Clonal attrition is likely to occur when the rate of CLL cell death exceeds that of CLL proliferation. Given the dominant role of positive BCR signaling in driving CLL proliferation, we asked whether CLL regression might reflect an attenuation of BCR-signaling responses. All spontaneously regressed tumors were ζ-chain-associated protein kinase 70 negative (supplemental Figure 5). We analyzed BCR levels and signaling responses in 14 cell-surface immunoglobulin M (IgM; sIgM) sIgM/sIgD+ spontaneously regressed tumors (Figure 3). Anti-IgM–mediated responses were lower in indolent M-CLL than in IGHV-unmutated (UM)-CLL, consistent with previous studies.33-36 However, responses were further reduced to undetectable levels in spontaneously regressed CLL (Figure 3B). In contrast, substantial IgD responses were retained, although they appeared lower in spontaneously regressed CLL compared with indolent M-CLL and UM-CLL (Figure 3C). Indeed, IgD signaling accounted for almost all residual signaling upon combined IgM/IgD stimulation in spontaneously regressed CLL (Figure 3D), with reduced IgM signaling being associated with low sIgM expression (Figure 3E-F). All regressed tumors expressed similar sIgM levels to indolent M-CLL, which were lower than indolent UM-CLL (Figure 3E-F). Class switch recombination, evident by IgG expression, was responsible for the negligible sIgM expression only in a single case (CLL19; data not shown). Thus, the sIgM levels potentially suggest an anergic state for the majority of regression cases. Furthermore, comparison of sequential spontaneous regression samples revealed 5.01-fold increased CXCR4 and significant (P ≤ .005) 4.61-fold reduced surface immunoglobulin expression (Figures 2D and 3G), suggesting reduced antigen engagement within proliferation centers and positive BCR signaling over time, consistent with development of a more quiescent state, potentially anergy.35,37 Corroborating these findings, spontaneously regressed CLL exhibited other anergic features such as twofold higher levels of basal Erk phosphorylation (pERK) than healthy B cells (Figure 4A).38 Also basal pErk38 and B-cell inhibitory receptor leukocyte-associated immunoglobulin like receptor 1 (LAIR1)39 levels were significantly elevated in regressed CLL compared with indolent M-CLL and UM-CLL (P ≤ .05), whereas basal Akt phosphorylation was similar (Figure 4A-B).
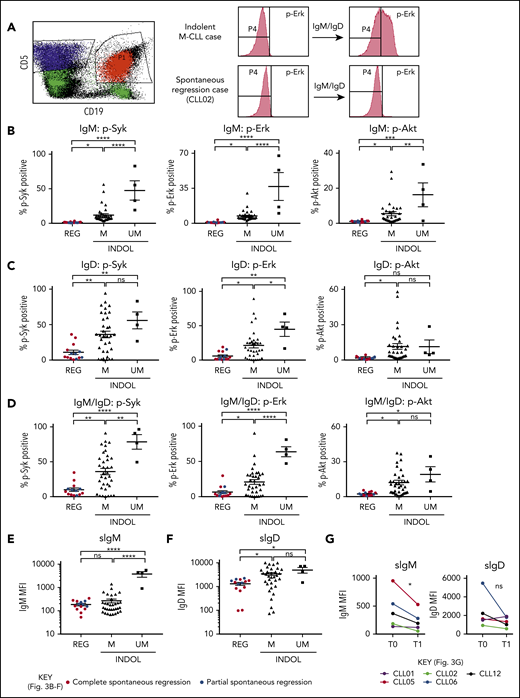
Spontaneously regressed CLL tumors are characterized by weak BCR-signaling response and sIgM expression. FACS analysis of the gated CLL fraction of PBMCs. BCR-signaling responses to IgM and IgD stimulation were assessed by phosphoflow using fresh blood samples. Cells were stimulated with anti-human IgM and/or IgD F(ab′)2 antibodies prior to acquisition on a flow cytometer. Combined IgM and IgD stimulation reflects BCR stimulation in vivo, whereas separate IgM and IgD stimulation allows dissection of the relative contribution of IgM and IgD responses to the overall BCR-signaling response in each comparator group. (A) Left panel, The CD19+CD5+ CLL population (shown in red) was gated and analyzed for the phosphorylation of Syk, Erk, and Akt, with the CD19−CD5+ T-cell population (shown in blue) being used as the internal negative control. The positive vs negative gate for p-Syk, p-Erk, and p-Akt was set such that 99% of unstimulated cells would fall within the negative gate. Right panel, Example histograms showing results of a typical indolent M-CLL case and a spontaneous regression case with combined IgM/IgD stimulation. Phosphoprotein response to (B) IgM, (C) IgD, or (D) combined IgM and IgD BCR stimulation, as well as CLL cell-surface (E) IgM (sIgM) and (F) IgD (sIgD) expression. Spontaneous regression cases (REG; n = 14) from the regression time point (T1) were compared against indolent (INDOL) M-CLL (n = 35) and UM-CLL (n = 4) cases. Complete and partial spontaneous regression cases are represented by red and blue dots, respectively, as shown. (G) Expression of sIgM and sIgD was compared between 2 sequential time points in individual spontaneous regression cases. T0 and T1 represent the diagnostic and the regression time point, respectively. Each colored line represents a specific case as indicated. Statistical significance was determined using 1-way ANOVA with Bonferroni post hoc analysis for cohort comparison and the 2-tailed paired Student t test for time point comparison. Statistical significance is indicated by *P < .05, **P < .01, ***P < .001, and ****P < .0001. MFI, mean fluorescence intensity; ns, comparisons that are not statistically significant.
Spontaneously regressed CLL tumors are characterized by weak BCR-signaling response and sIgM expression. FACS analysis of the gated CLL fraction of PBMCs. BCR-signaling responses to IgM and IgD stimulation were assessed by phosphoflow using fresh blood samples. Cells were stimulated with anti-human IgM and/or IgD F(ab′)2 antibodies prior to acquisition on a flow cytometer. Combined IgM and IgD stimulation reflects BCR stimulation in vivo, whereas separate IgM and IgD stimulation allows dissection of the relative contribution of IgM and IgD responses to the overall BCR-signaling response in each comparator group. (A) Left panel, The CD19+CD5+ CLL population (shown in red) was gated and analyzed for the phosphorylation of Syk, Erk, and Akt, with the CD19−CD5+ T-cell population (shown in blue) being used as the internal negative control. The positive vs negative gate for p-Syk, p-Erk, and p-Akt was set such that 99% of unstimulated cells would fall within the negative gate. Right panel, Example histograms showing results of a typical indolent M-CLL case and a spontaneous regression case with combined IgM/IgD stimulation. Phosphoprotein response to (B) IgM, (C) IgD, or (D) combined IgM and IgD BCR stimulation, as well as CLL cell-surface (E) IgM (sIgM) and (F) IgD (sIgD) expression. Spontaneous regression cases (REG; n = 14) from the regression time point (T1) were compared against indolent (INDOL) M-CLL (n = 35) and UM-CLL (n = 4) cases. Complete and partial spontaneous regression cases are represented by red and blue dots, respectively, as shown. (G) Expression of sIgM and sIgD was compared between 2 sequential time points in individual spontaneous regression cases. T0 and T1 represent the diagnostic and the regression time point, respectively. Each colored line represents a specific case as indicated. Statistical significance was determined using 1-way ANOVA with Bonferroni post hoc analysis for cohort comparison and the 2-tailed paired Student t test for time point comparison. Statistical significance is indicated by *P < .05, **P < .01, ***P < .001, and ****P < .0001. MFI, mean fluorescence intensity; ns, comparisons that are not statistically significant.

Spontaneously regressed CLL tumors express weak surface CD49d but retain high levels of Bcl-2. FACS analysis of the gated CLL population of PBMCs. The gated CLL population was analyzed for (A) basal Erk and Akt phosphorylation and (B) cell-surface LAIR1 expression. Spontaneous regression cases (REG; n = 14) from the regression time point (T1) were compared against indolent (INDOL) M-CLL (n = 35) and UM-CLL (n = 4) cases. Basal Erk and Akt phosphorylation in CLL cells was normalized to B cells from 3 age-matched healthy donors, and expressed as fold change compared with these controls. CLL expression of (C) ROR1, (D) CD38, (E) CD62L, and (F) CD49d on spontaneous regression cases (REG, n = 17) from the regression time point (T1) compared with indolent (INDOL; n = 54) and progressive (PROG; n = 40) cases. (G) Expression of CD49d and CD38 was compared between sequential diagnostic (T0) and regression (T1) time points in individual spontaneous regression cases. The gated CLL population was analyzed for the expression of (H) FasR, (I) Bcl-2, and (J) Mcl-1. For all comparisons except Mcl-1, 17 spontaneous regression cases (REG) from the regression time point (T1) were compared against 54 indolent (INDOL) and 40 progressive (PROG) CLL cases. For Mcl-1, 11 spontaneous regression cases from the regression time point (T1) were compared against 20 indolent and 29 progressive cases. In panels A to F and H to J, complete and partial spontaneous regression are represented by red and blue dots, respectively. Statistical significance is indicated by *P < .05, **P < .01, ***P < .001, and ****P < .0001. In panel G, each colored line represents a specific case and 5% expression is indicated (- - -). ns, comparisons that are not statistically significant.
Spontaneously regressed CLL tumors express weak surface CD49d but retain high levels of Bcl-2. FACS analysis of the gated CLL population of PBMCs. The gated CLL population was analyzed for (A) basal Erk and Akt phosphorylation and (B) cell-surface LAIR1 expression. Spontaneous regression cases (REG; n = 14) from the regression time point (T1) were compared against indolent (INDOL) M-CLL (n = 35) and UM-CLL (n = 4) cases. Basal Erk and Akt phosphorylation in CLL cells was normalized to B cells from 3 age-matched healthy donors, and expressed as fold change compared with these controls. CLL expression of (C) ROR1, (D) CD38, (E) CD62L, and (F) CD49d on spontaneous regression cases (REG, n = 17) from the regression time point (T1) compared with indolent (INDOL; n = 54) and progressive (PROG; n = 40) cases. (G) Expression of CD49d and CD38 was compared between sequential diagnostic (T0) and regression (T1) time points in individual spontaneous regression cases. The gated CLL population was analyzed for the expression of (H) FasR, (I) Bcl-2, and (J) Mcl-1. For all comparisons except Mcl-1, 17 spontaneous regression cases (REG) from the regression time point (T1) were compared against 54 indolent (INDOL) and 40 progressive (PROG) CLL cases. For Mcl-1, 11 spontaneous regression cases from the regression time point (T1) were compared against 20 indolent and 29 progressive cases. In panels A to F and H to J, complete and partial spontaneous regression are represented by red and blue dots, respectively. Statistical significance is indicated by *P < .05, **P < .01, ***P < .001, and ****P < .0001. In panel G, each colored line represents a specific case and 5% expression is indicated (- - -). ns, comparisons that are not statistically significant.
CLL proliferation is dependent on the migration of CLL cells from the peripheral blood to the lymph nodes. We evaluated CD49d,40,41 CD62L,42 CD38,41 and receptor tyrosine kinase like orphan receptor 1 (ROR1)43 expression, molecules important for migration. Although no significant difference was observed in ROR1, CD38, or CD62L levels, surface CD49d expression was significantly lower between spontaneously regressed CLL and indolent tumors, being expressed on <2% of tumor cells in most cases (Figure 4C-F; supplemental Figure 2). Concurrent with the attenuation of BCR signaling during regression, regressed samples exhibited reduced CD38 (2.44-fold) and CD49d (6.93-fold) expression compared with diagnosis but only in cases with diagnostic expression on >5% CLL cells (Figure 4G). As CD49d was the only downregulated chemokine receptor, reduced CD49d-mediated trafficking may contribute to CLL regression.
We next assessed the expression of apoptosis-related proteins in CLL cells. Relative to indolent CLL, spontaneously regressing CLL displayed significantly higher Fas receptor (FasR) expression at both the mRNA (log fold change [logFC], 0.98; P < .001) and the protein level (Figure 4H, supplemental Figure 2), implicating a potential role of the extrinsic apoptotic pathway in spontaneous regression. In contrast, comparable levels of the antiapoptotic proteins B-cell lymphoma 2 (Bcl-2) and myeloid cell leukemia 1 (Mcl-1) was seen in spontaneously regressed and indolent tumors (Figure 4I-J). Spontaneously regressed CLL continue to express Bcl-2 (Figure 4I), which could potentially contribute to the persistence of residual disease along with the concurrent upregulation of chemokines such as interleukin 8 (IL-8)/CXCL8 and CXCL2 (Table 3).44-46
We hypothesized that the very low rate of proliferation in spontaneously regressed CLL clones could also be due to replicative senescence secondary to telomere erosion. To investigate this, we measured telomerase activity and β-galactosidase expression, a marker of replicative senescence, within tumor cells. However, telomerase activity was higher in spontaneously regressed CLL tumors relative to nonregressing tumors and no evidence of β-galactosidase staining was observed (supplemental Figure 6). As such, there is no evidence to support replicative senescence as an explanation for decreased CLL proliferation during spontaneous regression.
Taken together, these results indicate that reduced BCR signaling, coupled with potentially curtailed migration to proliferation centers, leads to a very low proliferation rate in spontaneously regressed tumors. Consistent with a low metabolic, quiescent state, RNA-sequencing (RNA-seq) analysis of 15 spontaneously regressed CLL tumors demonstrated downregulation of pathways involved in RNA metabolism, mRNA translation, protein biosynthesis and oxidative phosphorylation compared with age-matched indolent M-CLL (n = 17) (Figure 5A-B; supplemental Table 4). Furthermore, MYC; an important gene promoting survival and proliferation33 was 1 of the top 5 downregulated genes in regressors and was associated with reduced Myc target gene expression (Figure 5C). Upon both principal component analysis (PCA) and multidimensional unsupervised hierarchical clustering analysis of the entire RNA-seq data set, which also included age-matched progressive M-CLL, UM-CLL, and healthy controls, spontaneously regressed CLL segregated into a cluster that overlapped with the indolent M-CLL cluster (Figure 5D-E). This is consistent with spontaneously regressed CLL having a transcriptomic profile that bears the closest resemblance to indolent M-CLL. Together, these data potentially indicate that prior to regression, an indolent genomic state is maintained that may render susceptibility to regression following an alteration of microenvironmental stimulation.
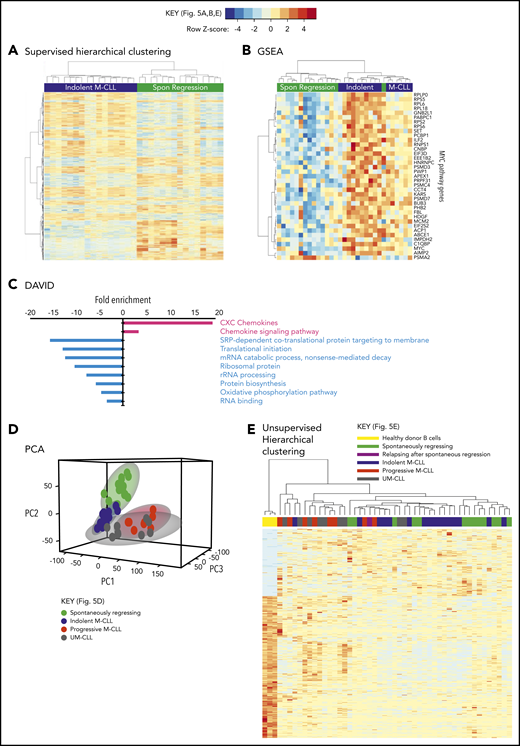
Spontaneously regressed CLL tumors exhibit a distinct transcriptomic profile. RNA-seq was carried out on sorted CD19+CD5+ CLL cells from subjects with spontaneous CLL regression (n = 15, from the regression time point), indolent M-CLL (n = 16), progressive M-CLL (n = 8) and UM-CLL (n = 8), or on isolated B cells from healthy donors (n = 3). (A) Gene-expression profiles of spontaneously (Spon) regressed tumors were compared against that of age-matched indolent M-CLL tumors, by 1-way ANOVA with Tukey post hoc analysis. Hierarchical clustering analysis demonstrates differential gene expression between spontaneously regressed and indolent M-CLL. (B) Gene set enrichment analysis (GSEA) showing differential expression of MYC and Myc target genes in spontaneously regressed vs indolent M-CLL tumors. (C) Database for Annotation, Visualization, and Integrated Discovery (DAVID) analysis showing enrichment of biological processes in spontaneously regressed CLL relative to indolent M-CLL. Biological processes that are upregulated in spontaneously regressed CLL are indicated in red, whereas those that are downregulated in these tumors are indicated in blue. (D) Multidimensional principal component analysis (PCA) of all samples by partial least squares discrimination (PLS-DA) showing distinct clustering of spontaneous regression cases. (E) Unsupervised hierarchical clustering analysis of all samples showing clustering of spontaneous regression cases overlapping with indolent M-CLL cases. rRNA, ribosomal RNA; SRP, signal-recognition particle.
Spontaneously regressed CLL tumors exhibit a distinct transcriptomic profile. RNA-seq was carried out on sorted CD19+CD5+ CLL cells from subjects with spontaneous CLL regression (n = 15, from the regression time point), indolent M-CLL (n = 16), progressive M-CLL (n = 8) and UM-CLL (n = 8), or on isolated B cells from healthy donors (n = 3). (A) Gene-expression profiles of spontaneously (Spon) regressed tumors were compared against that of age-matched indolent M-CLL tumors, by 1-way ANOVA with Tukey post hoc analysis. Hierarchical clustering analysis demonstrates differential gene expression between spontaneously regressed and indolent M-CLL. (B) Gene set enrichment analysis (GSEA) showing differential expression of MYC and Myc target genes in spontaneously regressed vs indolent M-CLL tumors. (C) Database for Annotation, Visualization, and Integrated Discovery (DAVID) analysis showing enrichment of biological processes in spontaneously regressed CLL relative to indolent M-CLL. Biological processes that are upregulated in spontaneously regressed CLL are indicated in red, whereas those that are downregulated in these tumors are indicated in blue. (D) Multidimensional principal component analysis (PCA) of all samples by partial least squares discrimination (PLS-DA) showing distinct clustering of spontaneous regression cases. (E) Unsupervised hierarchical clustering analysis of all samples showing clustering of spontaneous regression cases overlapping with indolent M-CLL cases. rRNA, ribosomal RNA; SRP, signal-recognition particle.
Spontaneous CLL regression occurs in the context of low genomic complexity and intraclonal equilibrium
The genomic landscape of individual CLL clones is believed to be a major determinant of biological behavior.16,17 Analyses of spontaneously regressed CLL tumors at various time points (n = 27) identified 12 to 57 somatic single-nucleotide variations (SNVs) per sample (supplemental Table 5). Furthermore, at the point of maximal spontaneous regression, validated variants of potential functional significance (n = 18) revealed a pattern of low mutational burden and an absence of genomic complexity among spontaneously regressed CLL, with a median of 1 somatic copy-number variation (CNV; range 0-3) and 2 SNVs (range, 0-5) per case (Figure 6A; Table 4). The most frequent CNV, del(13q14), was present in 11 tumors (61%), and was clonal in most cases, consistent with it being an early genomic event and a likely driver of the initial proliferative phase before regression onset. Mutations involving known CLL drivers were seen in 4 cases (22%): a subclonal HIST1H1B mutation in 1 case, and clonal or subclonal TP53 mutations in 3 cases (Figure 6A). All 3 TP53 alterations were reported missense variants, considered to be damaging by both Polymorphism Phenotyping (Polyphen) and Sorting Intolerant From Tolerant (SIFT) in silico prediction tools. Variant allelic frequencies (VAFs) ranged from 11.83% to 100%. The alteration TP53_g13804G>A has been reported multiple times in CLL, whereas all other alterations have been reported in other malignancies (Catalogue Of Somatic Mutations In Cancer [COSMIC]; cancer.sanger.ac.uk/cosmic). Only 1 (CLL13) occurred concurrently with 17p deletion (supplemental Table 6).
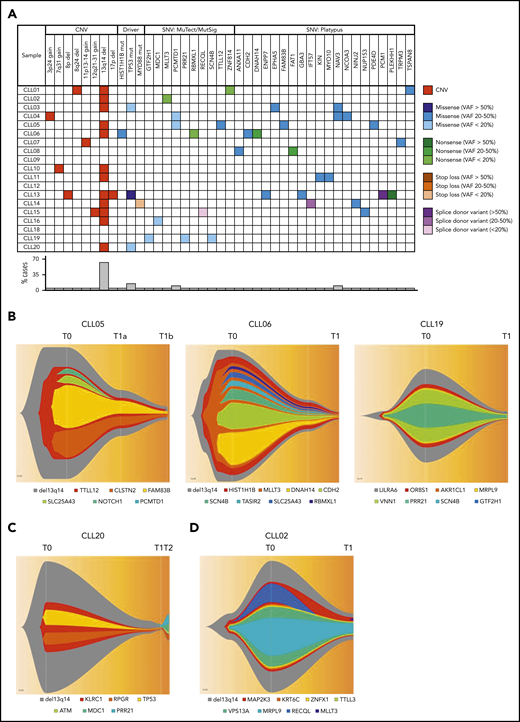
Genomic landscape of spontaneously regressing CLL tumors. WES data initially analyzed using standard bioinformatics criteria, subsequently underwent further selection to minimize artifacts and focus on variants of potential functional significance. The selected variants were predicted to be truncating or frameshift, missense mutations predicted to be deleterious, variant allele frequency ≥ 20% and could be validated by Sanger or RNA-seq. (A) The genomic landscape of 18 spontaneously regressed sorted CD19+CD5+ CLL tumors is displayed. The CNV data of each spontaneous regression case is combined with their respective SNV data obtained from WES. Different types of genomic events are represented by different colors, with the color code displayed adjacent to the table. The frequency of each genomic event is represented in the bar chart beneath the table. (B-D) Fish plots of somatic variants in sorted CD19+CD5+ CLL cells from (B) CLL05, CLL06, and CLL19 showing clonal equilibrium during the course of spontaneous regression, (C) CLL20 showing clonal equilibrium followed by clonal evolution during CLL relapse after spontaneous regression, and (D) CLL02 showing clonal fluctuation during regression. T0, T1, and T2 represent the diagnostic, regression, and relapse time points, respectively.
Genomic landscape of spontaneously regressing CLL tumors. WES data initially analyzed using standard bioinformatics criteria, subsequently underwent further selection to minimize artifacts and focus on variants of potential functional significance. The selected variants were predicted to be truncating or frameshift, missense mutations predicted to be deleterious, variant allele frequency ≥ 20% and could be validated by Sanger or RNA-seq. (A) The genomic landscape of 18 spontaneously regressed sorted CD19+CD5+ CLL tumors is displayed. The CNV data of each spontaneous regression case is combined with their respective SNV data obtained from WES. Different types of genomic events are represented by different colors, with the color code displayed adjacent to the table. The frequency of each genomic event is represented in the bar chart beneath the table. (B-D) Fish plots of somatic variants in sorted CD19+CD5+ CLL cells from (B) CLL05, CLL06, and CLL19 showing clonal equilibrium during the course of spontaneous regression, (C) CLL20 showing clonal equilibrium followed by clonal evolution during CLL relapse after spontaneous regression, and (D) CLL02 showing clonal fluctuation during regression. T0, T1, and T2 represent the diagnostic, regression, and relapse time points, respectively.
To determine the pattern of subclonal dynamics during spontaneous CLL regression, we analyzed genomic data from sequential diagnostic and regression samples (n = 5), including 2 complete regression cases (CLL05, CLL06). Intraclonal equilibrium was a predominant feature at the point of regression in 4 subjects, indicated by similar subclonal representation across sequential time points and no major clonal selection or evolution (Figure 6B-C). A degree of clonal evolution involving 3 genes was evident in a single case (Figure 6D). These observations indicate that in similarity to monoclonal B-cell lymphocytosis,47 clonal expansion of spontaneously regressed CLL is absent, even in cases harboring driver mutations. This is consistent with the notion that mutational burden alone is insufficient to drive malignancy and that sustained clonal expansion requires an interplay between mutational burden, potential genomic instability, and microenvironmental signals. To investigate this, we revisited our RNA-seq data set. In addition to downregulation of metabolic and proliferative processes, several genes involved in DNA repair and telomere maintenance were upregulated in spontaneously regressing CLL compared with indolent M-CLL (Table 5). The upregulation of the DNA repair genes was confirmed by quantitative polymerase chain reaction (supplemental Figure 7). Notwithstanding the presence of genomic aberrations, these features may potentially contribute to the absence of genome instability in spontaneously regressing CLL.
Tumor immunity represents another mechanism that could suppress CLL proliferation in spontaneously regressing disease. CLL regression was accompanied by significantly reduced PD-1, LAG3, and CD160 expression on CD8+ T cells compared with indolent cases (P ≤ .05), whereas CD244 levels were unchanged (Figure 7A; supplemental Figure 2). Furthermore, PD-1 levels decreased from diagnosis on both CD4+ (twofold) and CD8+ (threefold) T cells (Figure 7B). T-cell proliferation also significantly (P ≤ .05) increased in comparison with their respective diagnostic time point and indolent CLL (Figure 7C). This indicates reversal of T-cell exhaustion possibly due to reduced tumor burden, which may result in improved cytotoxicity against CLL cells.21 Furthermore, established CLL is associated with impaired immune function including elevated numbers of T and NK cells,19-22 and regression was associated with normalization of T-cell and NK-cell number (Table 2, supplemental Figure 8). However, T-cell subset distribution was not significantly altered in spontaneously regressed CLL compared with indolent CLL, and CD4-to-CD8 inversion persisted in some cases.
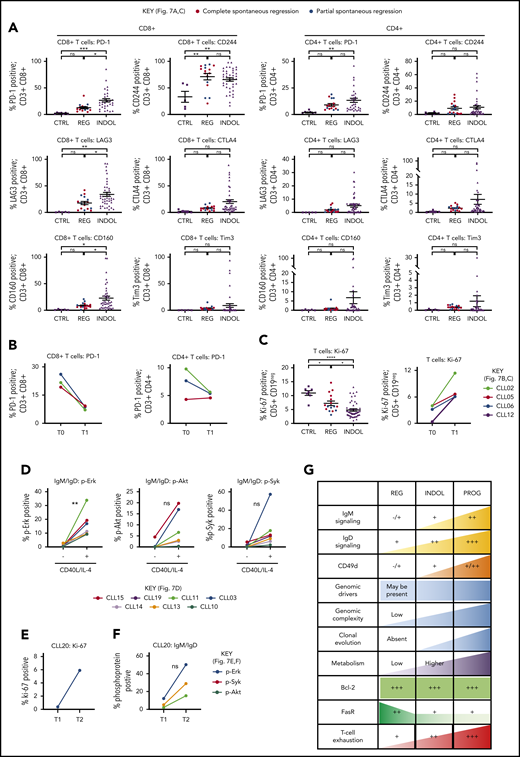
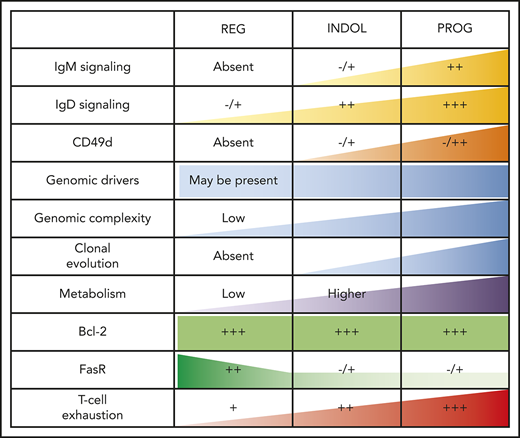
T-cell phenotypic features of spontaneously regressing tumors, reactivation of BCR signaling associated with relapse following spontaneous CLL regression, and biological processes underpinning spontaneous CLL regression. FACS analysis of the gated T-cell population of CLL PBMCs. (A) PD-1, LAG3, CD160, CD244, CTLA4, and Tim3 expression on CD4+ and CD8+ T cells in spontaneous regression cases (REG; n = 16) from the regression time point (T1) was compared against indolent cases (INDOL; n = 31) and age-matched healthy controls (CTRL; n = 6). (B) PD-1 expression in T cells was compared between the diagnostic (T0) and regression (T1) time points in individuals with spontaneous CLL regression. (C) Ki-67 expression in T cells of spontaneous regression cases (CTRL; n = 16) from the regression time point (T1) was compared against indolent cases (INDOL; n = 31) and age-matched healthy controls (CTRL; n = 6) and also between the diagnostic (T0) and regression (T1) time points in individuals with spontaneous CLL regression. (D) PBMCs from spontaneously regressed cases at maximal regression (n = 7) were incubated at 37°C for 48 hours in the presence and absence of CD40L-expressing fibroblasts and IL-4 (25 ng/mL), after which the CLL population was analyzed for Erk, Akt, and Syk phosphorylation in response to combined IgM/IgD BCR stimulation. Expression of (E) Ki-67 and (F) phosphoprotein response to combined BCR stimulation of PBMCs with anti-human IgM and IgD F(ab′)2 antibodies were compared between the regression (T1) and relapse (T2) time points of CLL20. (G) Schematic diagram illustrating the key biological processes underpinning spontaneous CLL regression (REG) and key differences as compared with nonregressing indolent (INDOL) and progressive (PROG) CLL. Statistical significance was determined using 1-way ANOVA with Bonferroni post hoc analysis between CLL cohorts and the paired Student t test between time points or stimulus. Statistical significance is indicated by *P < .05, **P < .01, ***P < .001, and ****P < .0001. ns, comparisons that are not statistically significant.
T-cell phenotypic features of spontaneously regressing tumors, reactivation of BCR signaling associated with relapse following spontaneous CLL regression, and biological processes underpinning spontaneous CLL regression. FACS analysis of the gated T-cell population of CLL PBMCs. (A) PD-1, LAG3, CD160, CD244, CTLA4, and Tim3 expression on CD4+ and CD8+ T cells in spontaneous regression cases (REG; n = 16) from the regression time point (T1) was compared against indolent cases (INDOL; n = 31) and age-matched healthy controls (CTRL; n = 6). (B) PD-1 expression in T cells was compared between the diagnostic (T0) and regression (T1) time points in individuals with spontaneous CLL regression. (C) Ki-67 expression in T cells of spontaneous regression cases (CTRL; n = 16) from the regression time point (T1) was compared against indolent cases (INDOL; n = 31) and age-matched healthy controls (CTRL; n = 6) and also between the diagnostic (T0) and regression (T1) time points in individuals with spontaneous CLL regression. (D) PBMCs from spontaneously regressed cases at maximal regression (n = 7) were incubated at 37°C for 48 hours in the presence and absence of CD40L-expressing fibroblasts and IL-4 (25 ng/mL), after which the CLL population was analyzed for Erk, Akt, and Syk phosphorylation in response to combined IgM/IgD BCR stimulation. Expression of (E) Ki-67 and (F) phosphoprotein response to combined BCR stimulation of PBMCs with anti-human IgM and IgD F(ab′)2 antibodies were compared between the regression (T1) and relapse (T2) time points of CLL20. (G) Schematic diagram illustrating the key biological processes underpinning spontaneous CLL regression (REG) and key differences as compared with nonregressing indolent (INDOL) and progressive (PROG) CLL. Statistical significance was determined using 1-way ANOVA with Bonferroni post hoc analysis between CLL cohorts and the paired Student t test between time points or stimulus. Statistical significance is indicated by *P < .05, **P < .01, ***P < .001, and ****P < .0001. ns, comparisons that are not statistically significant.
Enhanced costimulation can overcome inhibition of BCR signaling in vitro and disease acceleration may be driven by clonal evolution
To determine the clinical significance of the residual disease that remains after spontaneous CLL regression, we examined whether the quiescent state of BCR unresponsiveness in spontaneously regressed CLL could be reversed. We compared BCR responses with and without CD40L and IL-4 coculture as this has previously been shown to reverse clonal anergy.48,49 Provision of costimulation with CD40L/IL-4 resulted in a recovery of BCR responses (elevation of pErk, 13.76-fold,; pAkt, 9.38-fold; and pSyk, 14.31-fold) in spontaneously regressed CLL (Figure 7D), indicating that BCR unresponsiveness is reversible, and likely due to chronic antigenic stimulation in the absence of tissue IL-4. This substantiates the proposition that CLL cells in regression cases were confined to the peripheral circulation for prolonged periods. We compared sequential CLL20 samples, a case characterized by CLL relapse following complete spontaneous regression. Disease relapse coincided with recovery of BCR responses and CLL proliferation (Figure 7E-F). Moreover, relapse was accompanied by clonal evolution in which the subclone harboring TP53, KLRC1, and RPGR mutations, dominant at the time of spontaneous regression, was replaced by another with ATM, MDC1, and PRP21 mutations at relapse (Figure 6C). Collectively, these findings demonstrate that CLL cells from cases of spontaneous CLL regression remain susceptible to enhanced costimulation and this may potentially represent 1 mechanism of disease progression following clonal evolution.
Discussion
In this study, we present the largest cohort of spontaneous CLL regression cases analyzed to date. To investigate the natural history and biological processes underpinning spontaneous CLL regression, these cases underwent extensive characterization. This involved sequential time points, and integration of flow cytometric, functional, transcriptomic, and genomic analyses, which distinguishes this study from previously published reports.
Our results support a model in which spontaneously regressed CLL arises from a CLL clone that has undergone extensive prior proliferation, but subsequently transitioned to a limited proliferative state with hyporesponsiveness to IgM BCR stimulation. The residual CLL clone is likely to be concentrated within peripheral blood due to reduced expression of CD49d, which mediates adhesion and transendothelial migration, important for CLL cell trafficking to proliferation centers. However, it ultimately remains viable because of sustained Bcl-2 expression. Clonal quiescence, possibly together with increased DNA repair activity, enables maintenance of genome stability and intraclonal equilibrium despite the presence, in some cases, of biologically relevant mutations. Such a model highlights the interdependence of genetic and microenvironmental factors in determining the clinical course of patients with CLL (Figure 7G). We postulate that under conditions of low genomic complexity and genome stability, mutations alone, in the absence of BCR signaling and other microenvironmental interactions, are insufficient for CLL progression or to sustain disease. Thus, it appears that an indolent genomic state is a required background in most CLLs, on which an alteration of microenvironmental/BCR stimulation may lead to regression and, conversely, subsequent relapse in combination with genetic alterations. Both intrinsic and extrinsic factors are likely to contribute to these changes and therefore probably determine the balance between CLL quiescence and proliferation. The order of events and the causative factors may be case-dependent and could depend on unknown environmental factors.
This model explains the efficacy of BCR-signaling inhibitors in producing durable remissions in the frontline setting, where genomic complexity is typically low even in the presence of genetic alterations such as TP53 mutations.17,18 In these cases, the effect of treatment with BCR signaling inhibitors bears resemblance to spontaneous CLL regression. In contrast, in relapsed or refractory CLL with high intrinsic levels of genomic complexity and instability, BCR-signaling inhibition alone may be insufficient in preventing disease relapse arising from clonal evolution, and therapeutic strategies targeting both genetic and microenvironmental drivers may be required. Our findings also underscore the significance of detectable residual CLL following clinical regression, the outcome of which is dependent upon the dynamic interplay between factors that promote continued clonal regression and others that promote clonal expansion. This lends support to therapeutic strategies aiming at complete CLL eradication, particularly in patients with high-risk biological features.
Two findings from our study are of particular interest. First, IgM BCR signaling promotes CLL survival and growth,33 and hence its reduction to unmeasurable levels in spontaneously regressing cases suggests a quiescent, possibly anergic state that may lead irreversibly to cell death. Interestingly, although measurable signals remained, sIgD expression and IgD signaling were also reduced in the residual circulating tumor cells from spontaneously regressed CLL patients. Although the significance of these changes remains to be determined, a similar reduction of sIgD has been observed in circulating CLL cells of patients receiving ibrutinib therapy that were unable to return to their protective niche within lymph nodes. In these cells, the reduced sIgD levels and IgD-signaling capacity were likely consequent to ongoing autophagy, possibly reflecting an ultimate attempt of the CLL cells to survive.50 Second, CLL cells are thought to be resistant to Fas-mediated apoptosis,51,52 in part through overexpression of TOSO, which inhibits procaspase 8 activation.53 The significance of high FasR expression in spontaneously regressing CLL is therefore intriguing. We did not find a difference in TOSO expression between spontaneously regressed and indolent M-CLL from our RNA-seq analysis. However, there remains a possibility that spontaneously regressing CLL could have an intrinsic sensitivity to Fas-mediated apoptosis. Alternatively, absent IgM signaling may potentially contribute to an increased sensitivity, and future studies will need to clarify this.
Our study identified multiple determinants of spontaneous clonal regression, some of which are intrinsic to the CLL clone (eg, genetics), whereas others appear to be acquired (eg, BCR unresponsiveness). Important questions remain as to how the acquired features are developed, and why some CLL tumors, but not others, develop these. One possibility relates to the divergent outcome of different BCR-antigen interactions, some of which may produce sustained responses, whereas others may elicit responses that decline over time with repeated interactions.54 Another possibility may reflect potential differences in immunogenicity, with more immunogenic tumors eliciting stronger T-cell responses that result in clonal attrition. Although our preliminary investigation did not reveal significant differences in the expression of T-cell costimulatory molecules such as CD80, CD86, and CD40 between regressing and nonregressing CLL, further studies are required to explore these hypotheses.
Finally, complete and partial spontaneous regression cases displayed similar biological features. This suggests that partial regression cases may represent an earlier stage of regression, and with time, complete remission could become apparent. In conclusion, our study into the biological basis of spontaneous regression provides a unique perspective on the processes underpinning CLL pathogenesis, with treatment implications.
The raw WES and RNA-seq data reported in this article are available in the National Center for Biotechnology Information Sequence Read Archive (accession number PRJNA535508; www.ncbi.nlm.nih.gov/bioproject/PRJNA535508).
The online version of this article contains a data supplement.
The publication costs of this article were defrayed in part by page charge payment. Therefore, and solely to indicate this fact, this article is hereby marked “advertisement” in accordance with 18 USC section 1734.
Acknowledgments
The authors thank all patients at Queen Elizabeth Hospital Birmingham, Birmingham Heartlands Hospital, St. James’s University Hospital, and Pinderfields General Hospital who participated in this study. The authors also acknowledge Ingo Ringshausen and Mark Drayson for discussion and critical review of this work, and Jamie Beaumont and Jusveen Rai for technical support.
This work was supported by Leukaemia & Lymphoma Research (Bloodwise) clinical research training fellowship 13059 (M.K.) and a National Institute for Health Research clinical lectureship (M.K.). Bioinformatics analysis was supported by Bloodwise programme grant 11045 (T.S.). Telomere length analysis was supported by Cancer Research UK grant C17199/A18246 (D.M.B.).
Authorship
Contribution: M.K. conceived, designed, and directed this study; T.S., P.H., P. Moss, and A.C.R. provided mentorship and guidance to M.K., and supervised this work; M.K., C.O., A.C.R., R.E.J., S. Drennan, A.A., P.E., E.S., S. Dalal, J.M., N.G., and M.H. performed experimental work and/or data analysis; A.G., G. Papatzikas, A.S.-O., R.H., and J.-B.C. performed bioinformatics analysis; A.C.R., N.J.D., A.D.B., A.M.R.T., F.F., and D.M.B. provided scientific expertise; M.K., H.P., T.M., P. Moreton, S.P., G. Pratt, P. Moss, and P.H. recruited patients and/or provided patient care; M.K. wrote the manuscript; and all authors revised and approved the final version of the manuscript.
Conflict-of-interest disclosure: The authors declare no competing financial interests.
Correspondence: Marwan Kwok, Institute of Cancer and Genomic Sciences, University of Birmingham, Institute for Biomedical Research, Vincent Dr, Edgbaston, Birmingham, United Kingdom; e-mail: m.kwok@bham.ac.uk; or Tatjana Stankovic, Institute of Cancer and Genomic Sciences, University of Birmingham, Institute for Biomedical Research, Vincent Dr, Edgbaston, Birmingham, United Kingdom; e-mail: t.stankovic@bham.ac.uk.