Key Points
Human HSCs show higher tonic signaling activity in multiple pathways than MPPs.
Growth factor–activated AKT and β-catenin in human HSCs regulate their survival and mitogenesis.
Abstract
Several growth factors (GFs) that together promote quiescent human hematopoietic stem cell (HSC) expansion ex vivo have been identified; however, the molecular mechanisms by which these GFs regulate the survival, proliferation. and differentiation of human HSCs remain poorly understood. We now describe experiments in which we used mass cytometry to simultaneously measure multiple surface markers, transcription factors, active signaling intermediates, viability, and cell-cycle indicators in single CD34+ cord blood cells before and up to 2 hours after their stimulation with stem cell factor, Fms-like tyrosine kinase 3 ligand, interleukin-3, interleukin-6, and granulocyte colony-stimulating factor (5 GFs) either alone or combined. Cells with a CD34+CD38−CD45RA−CD90+CD49f+ (CD49f+) phenotype (∼10% HSCs with >6-month repopulating activity in immunodeficient mice) displayed rapid increases in activated STAT1/3/5, extracellular signal-regulated kinase 1/2, AKT, CREB, and S6 by 1 or more of these GFs, and β-catenin only when the 5 GFs were combined. Certain minority subsets within the CD49f+ compartment were poorly GF-responsive and, among the more GF-responsive subsets of CD49f+ cells, different signaling intermediates correlated with the levels of the myeloid- and lymphoid-associated transcription factors measured. Phenotypically similar, but CD90−CD49f− cells (MPPs) contained lower baseline levels of multiple signaling intermediates than the CD90+CD49f+ cells, but showed similar response amplitudes to the same GFs. Importantly, we found activation or inhibition of AKT and β-catenin directly altered immediate CD49f+ cell survival and proliferation. These findings identify rapid signaling events that 5 GFs elicit directly in the most primitive human hematopoietic cell types to promote their survival and proliferation.
Introduction
Growth factors (GFs) represent a cornerstone of most hematopoietic stem cell (HSC) manipulations for experimental and clinical purposes. HSC expansion strategies, including recent reports of significant improvements using small molecule supplemented cultures, generally rely on the concomitant effects of GFs to promote HSC survival and mitogenesis.1-4 GF stimulation is also used to optimize viral-based transduction efficiency for both investigative and therapeutic studies.5-7 Mutations leading to constitutive GF production, receptor activity, or downstream signaling are common in both hematopoietic and other malignancies.8-13 Thus, understanding the intracellular molecular mechanisms by which GFs elicit or block changes in the biological properties of human HSCs has important implications. Stem cell factor (SCF) was 1 of the first GFs implicated in the control of HSC behavior in mice based on the effects of mutations in this gene and its receptor.14-16 Fms-like tyrosine kinase 3 ligand (FLT3L), interleukin-3 (IL-3) and IL-6, granulocyte colony-stimulating factor (G-CSF), and thrombopoietin (TPO) have also been found to contribute to the in vitro expansion of a variety of primitive human hematopoietic cell populations.17-20
In model systems, SCF, FLT3L, IL-3, IL-6, and G-CSF (5 GFs) have been found to converge on a number of pathways, including the MAPK, JAK-STAT, and AKT pathways (GenomeNet, Kyoto Encyclopedia of Genes and Genomes - Pathway database http://www.genome.jp/kegg/pathway.html). We have previously demonstrated a high degree of heterogeneity in the long-term regenerative activity displayed by clonally assessed human CD34+ cord blood (CB) cells in vivo21 and hence anticipated heterogeneity in the GF responses in vitro of the subsets reported to have long-term regenerative activity in vivo. We therefore designed experiments to enable effects on 43 parameters to be measured simultaneously in individual cells of the subsets of interest using mass cytometry.22 The results show highly GF-specific activation of predicted pathways in CD34+CD38−CD45RA−CD90+CD49f+ cells (CD49f+ cells; ∼10% pure human HSCs),23 and the additional activation of β-catenin in these cells only by all 5 GFs together. We also provide evidence that AKT and β-catenin play a requisite role in the regulation of the survival and cycling state of this HSC subset.
Methods
Human CB cells
Anonymized heparinized CB collections were obtained from consenting mothers undergoing normal full-term deliveries in accordance with procedures approved by the Research Ethics Board of the University of British Columbia. Samples obtained on the same day were immediately pooled, and low-density (<1.077g/mL) cells then isolated by centrifugation on Lymphoprep; a CD34+ cell-enriched fraction of these (>50% purity) were obtained using EasySep reagents (STEMCELL Technologies). These cells were then viably cryopreserved in dimethyl sulfoxide (DMSO) and fetal bovine serum (FBS, STEMCELL Technologies) and then thawed as required.
Mass cytometric analysis
Cryopreserved CB cells enriched in their CD34+ cell content were thawed in Iscove modified Dulbecco medium with 10% FBS and 10 µg/mL DNase I (Sigma Aldrich), centrifuged, suspended at 106 cells/mL in serum-free medium (SFM = Iscove medium plus BIT, 40 µg/mL low-density-lipoprotein, 100 U/mL penicillin, 100 µg/mL streptomycin, and 2 mM glutamine from STEMCELL Technologies, and 10−4 M β-mercaptoethanol from Sigma) and exposed to 10 µM cisplatin (an indicator of cell viability; Sandoz) for 1 minute at 37°C. Cells were then resuspended in fresh SFM with 1 µM 5-Iodo-2′-deoxyuridine (an indicator of cycling/S-phase cells, Sigma Aldrich) at a concentration of 0.5 1 × 10⁶ cells/mL and incubated at 37°C, usually for a total of 3 hours with GFs added as indicated for the final 5 to 120 minutes. In 1 experiment, cells were instead left in SFM for 60 minutes followed by GF stimulation for 5, 15, or 120 minutes. At the end of this time, cells were processed using a protocol similar to that described by Bendall et al,22 consisting of a first fixation in paraformaldehyde, surface staining (see supplemental Table 1, available on the Blood Web site), permeabilization in methanol, and labeling of intracellular components (supplemental Table 1; supplemental Methods). Following staining, cells were resuspended in 0.5 µM 103Rh in PBS with 2% FBS at a cell concentration of 106 cells/mL, left overnight at 4°C in the dark, and then washed twice with milli-Q “ultrapure” H2O (Millipore). EQ Four Element Calibration Beads (DVS Sciences) were added at a concentration of 3.3 × 10⁴ beads/mL to the cells in milli-Q H2O at a cell concentration not exceeding 0.5 × 10⁶ cells/mL. Cells were then filtered and analyzed in a CyTOF 2 using a flow speed of 0.045 mL/minute, a 30-second acquisition delay, and a 10-second detector stability delay.
Single-cell cultures of CD49f+ cells
To isolate the CD49f+ cells used to initiate single-cell cultures, thawed suspensions of CD34+ cell-enriched cells were first incubated with 1.5 µg/mL of the anti-human CD32 antibody (Clone IV.3; STEMCELL Technologies) to block nonspecific staining, and then incubated for 1 to 2 hours with anti-CD49f (GoH3)-eFluor-450, anti-CD90 (5E10)-phycoerythrin, anti-CD45RA (HI100)-fluorescein isothiocyanate (all from eBiosciences), anti-CD38 (HIT2; BD Pharmingen)-fluorescein isothiocyanate, and anti-CD34 (581; BioLegend)-AlexaFluor-647. CD49f+ cells were then isolated using a BD FACSAria II, III, or Fusion sorter (Becton Dickinson) in single-cell mode to deposit single cells into the individual wells of 72-well Terasaki plates (Greiner Bio-One) preloaded with SFM plus the indicated GFs with or without specific small molecule inhibitors (Cayman Chemical) (supplemental Table 2). Plates were assessed an hour later to identify wells that contained only 1 refractile cell. Wells were examined twice daily thereafter to determine the number of viable (refractile) cells present. GFs used were SCF (gifted by Amgen), FLT3L (gifted by Immunex), both at 100 ng/mL; and IL-3 (gifted by Novartis), IL-6 (gifted by Cangene), and G-CSF (from STEMCELL Technologies), all at 20 ng/mL; as well as TPO from STEMCELL Technologies) at 50 ng/mL in 1 series of experiments. No culture contained >0.1%, DMSO, which was also added to SFM+5 GFs or FLT3L in control cultures (no inhibitor added). Inhibitors were pretested on the OCI-AML5 cell line24 (gift of M. Minden, University of Toronto) to identify an optimal effective and specific inhibitory activity (supplemental Methods).
Data analysis
All statistical testing and data analysis was performed in R. Flow cytometric and CyTOF data were analyzed using the package flowCore together with custom scripts (see also supplemental Methods).
Results
Different GFs activate distinct signaling pathways in CD49f+ CB cells
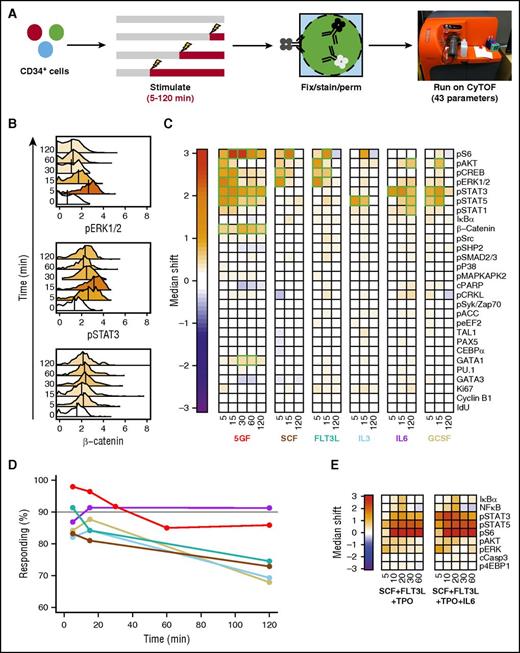
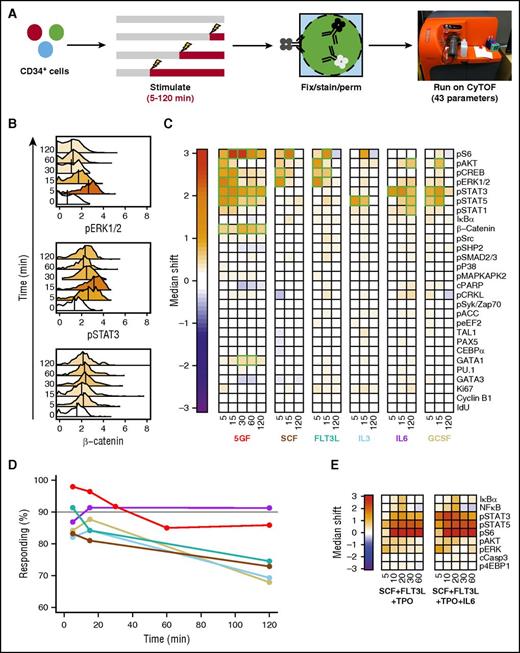
To identify molecular pathways that are activated in individual cells from the CD49f+ (HSC) and CD38−CD45RA−CD90−CD49f− (MPP) compartments of CD34+ human CB, we used mass cytometry to simultaneously measure their content of 43 markers before and after different periods of GF stimulation. Thirteen of these markers were surface antigens to allow the responses of specific phenotypes to be distinguished (supplemental Figure 1).23,25 The others included 18 activated forms of cell signaling intermediates, 6 transcription factors (TFs), 2 markers of cell viability, and 4 indicators of cell-cycling state. These were selected based on their potential involvement and the availability of validated reagents with the high specificity required for their detection using CyTOF. Cells were examined after being incubated for a total of 3 hours either with no, a single, or 5 GFs for the last 5, 15, 30, 60, or 120 minutes (Figure 1A) because all responses peaked within the first 30 minutes (Figure 1B).
Different GF combinations activate different signaling responses in CD49f+ CB cells. (A) Experimental design for cells examined (B-D). (B) Representative histograms of signal intensity over time for pERK1/2 (top), pSTAT3 (middle), and active (nonphosphorylated) β-catenin (bottom) following stimulation of CD49f+ cells with 5 GFs. Histogram colors indicate the median shift in the stimulated cells relative to the unstimulated cells. The color scale is indicated by the color bar in panel C. (C) Median asinh (signal intensity/5) differences in signal activation in the CD49f+ cells compared with unstimulated cells. Significant differences are indicated in green. (D) Frequency of CD49f+ cells surpassing the 95th percentile of the unstimulated sample in any intracellular marker following GF stimulation. (E) Signal activation shown as differences in median asinh values measured in CD49f+ cells exposed to either SCF + FLT3L + TPO or SCF + FLT3L + TPO + IL-6 for the times shown (in minutes) after a preliminary hour in SFM alone relative to CD49f+ cells incubated in SFM for equivalent times without GFs.
Different GF combinations activate different signaling responses in CD49f+ CB cells. (A) Experimental design for cells examined (B-D). (B) Representative histograms of signal intensity over time for pERK1/2 (top), pSTAT3 (middle), and active (nonphosphorylated) β-catenin (bottom) following stimulation of CD49f+ cells with 5 GFs. Histogram colors indicate the median shift in the stimulated cells relative to the unstimulated cells. The color scale is indicated by the color bar in panel C. (C) Median asinh (signal intensity/5) differences in signal activation in the CD49f+ cells compared with unstimulated cells. Significant differences are indicated in green. (D) Frequency of CD49f+ cells surpassing the 95th percentile of the unstimulated sample in any intracellular marker following GF stimulation. (E) Signal activation shown as differences in median asinh values measured in CD49f+ cells exposed to either SCF + FLT3L + TPO or SCF + FLT3L + TPO + IL-6 for the times shown (in minutes) after a preliminary hour in SFM alone relative to CD49f+ cells incubated in SFM for equivalent times without GFs.
Analysis of the responses of the CD49f+ cell compartment revealed rapid median increases in the per-cell level of several expected activated signaling intermediates, but many signaling intermediates were not affected (Figure 1B-C). Because CD49f+ cells are known to be both phenotypically and functionally heterogeneous,23 we examined the total percentage of GF-stimulated CD49f+ cells that displayed a significant change in at least 1 of the intracellular markers tracked (Figure 1D). A total of 98% of the CD49f+ cells showed a detectable response to the 5-GF stimulus, demonstrating that at least a majority of functional HSCs are affected. FLT3L and IL-6 alone elicited responses in 91% of the CD49f+ cells, with slightly lower numbers for SCF, IL-3, or G-CSF alone (83% to 88% responsive CD49f+ cells).
SCF or FLT3L alone elicited parallel transient increases in several activated MAPK pathway intermediates (ie, extracellular signal-regulated kinase 1/2 [ERK1/2], AKT, CREB, and S6; Figure 1C; supplemental Figure 2). In contrast, IL-3 alone stimulated a more selective activation of STAT5, and, to a lesser extent, S6. Either IL-6 or G-CSF alone caused a rapid (within 5-15 minutes) and strong activation of STAT3. IL-6 alone also showed activation of STAT1/5 and AKT, but a little later. The rapidity of the IL-6–stimulated activation of STAT3 in CD49f+ cells is notable because this finding appears to contradict previous studies suggesting a lack of expression of the α subunit of the IL-6 receptor on primitive human hematopoietic cells.26
The signaling response profile stimulated by the 5 GFs in combination was similar to that predicted by the sum of the effects of the individually tested GFs (Figure 1C). However, the 5 GFs together also stimulated a significant accumulation of active β-catenin not evident in the responses to single GFs (Figure 1B). Cells stimulated with all 5 GFs together also showed a decrease in cleaved PARP, an apoptotic marker, although this did not reach significance. Analysis of responses of CD49f+ CB cells to 2 TPO-containing (but otherwise overlapping) GF cocktails commonly used in published ex vivo HSC expansion experiments1,3,4 showed activation of many of the same pathways (Figure 1E). Interestingly, most responsive markers showed considerable specificity in the precise timing of their peak increases. For example, all GF-stimulated increases in phosphorylated ERK1/2 had already reached a peak within 5 minutes, whereas peak increases in phospo-STAT3 were consistently attained after 15 minutes of stimulation. Peak levels of activated (nonphosphorylated) β-catenin were attained even later (after 30-60 minutes of stimulation), suggesting that this latter response may be a secondary one.
Subsets within the CD49f+ population show different molecular responses to GFs
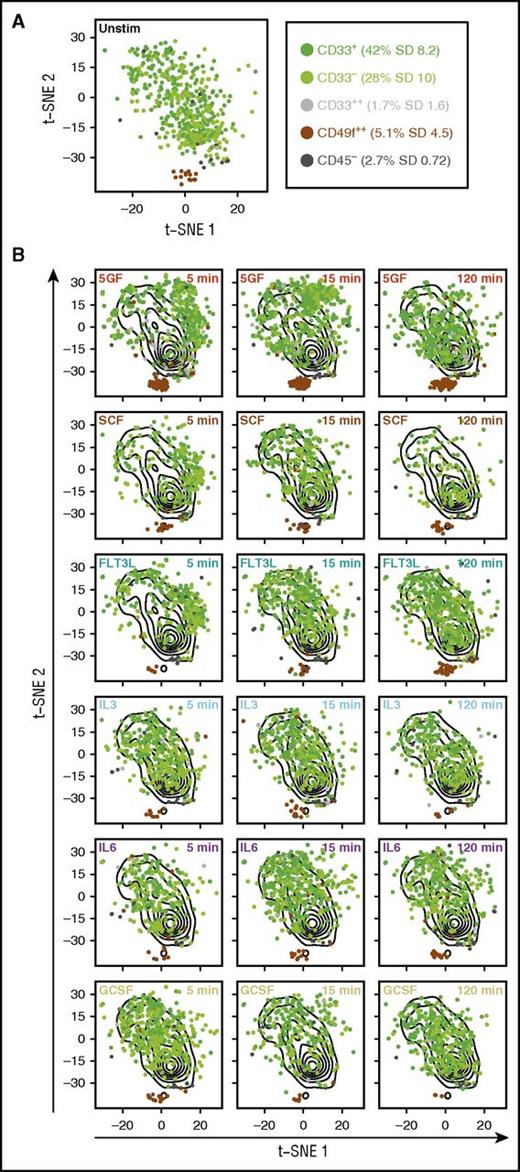
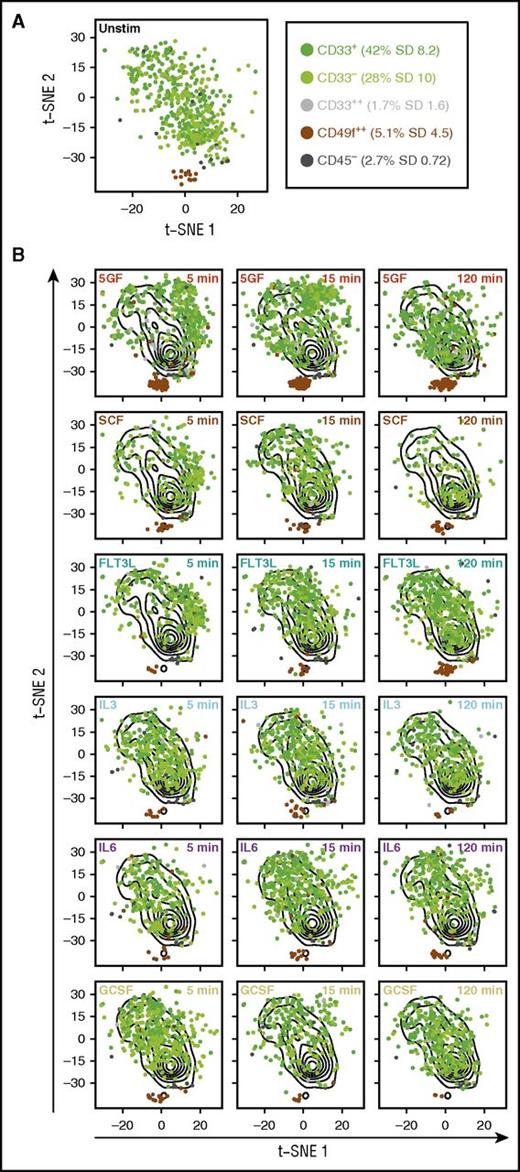
We next examined the responses of subsets within the total CD49f+ cell population that we recently identified as having different HSC functional activities in transplanted mice (D.J.F.H.K., C.A.H, N.A., P.H.M., Michelle Moksa, Michael VanInsberghe, Gabrielle M. Rabu, P.A.B., D.P., R.K.H., C.H., Martin Hirst, S.C.B., G.P.N., and C.J.E., manuscript submitted June 2016). Accordingly, we performed a t-SNE analysis of all CD49f+ cell data across multiple subsets and for all times and conditions of GF stimulation (Figure 2A). This analysis showed that both the CD45+CD33+CD49f+ cells (that display serial repopulating activity) and the CD45+CD33−CD49f+ cells (that display only primary repopulating activity) exhibited similar overall molecular responses, both to one another and to the total CD49f+ population in which they are the predominant phenotypes (Figure 2B). However, the CD45− and CD45+CD33++ subsets (which lack detectable in vivo regenerative activity), as well as the rare CD34lowCD133− subset of CD49f+ cells, showed little or no response to stimulation by any or all of the GFs.
Subsets within the CD49f+ compartment exhibit different molecular responses to GFs. Dimensionality reduction using t-SNE was performed on the data obtained for all intracellular markers from all CD49f+ cells after scaling the data from each CyTOF run. Subsets of the CD49f+ compartment are shown as different colors and their frequencies are listed in the figure. Cells that fell in between gates are not shown. (A) The distribution of unstimulated (unstim) cells from all subsets in t-SNE space. (B) The overall distributions of all unstimulated cells are shown as contours on all plots. Results for each subset of CD49f+ cells following the indicated GF exposure are shown in t-SNE space.
Subsets within the CD49f+ compartment exhibit different molecular responses to GFs. Dimensionality reduction using t-SNE was performed on the data obtained for all intracellular markers from all CD49f+ cells after scaling the data from each CyTOF run. Subsets of the CD49f+ compartment are shown as different colors and their frequencies are listed in the figure. Cells that fell in between gates are not shown. (A) The distribution of unstimulated (unstim) cells from all subsets in t-SNE space. (B) The overall distributions of all unstimulated cells are shown as contours on all plots. Results for each subset of CD49f+ cells following the indicated GF exposure are shown in t-SNE space.
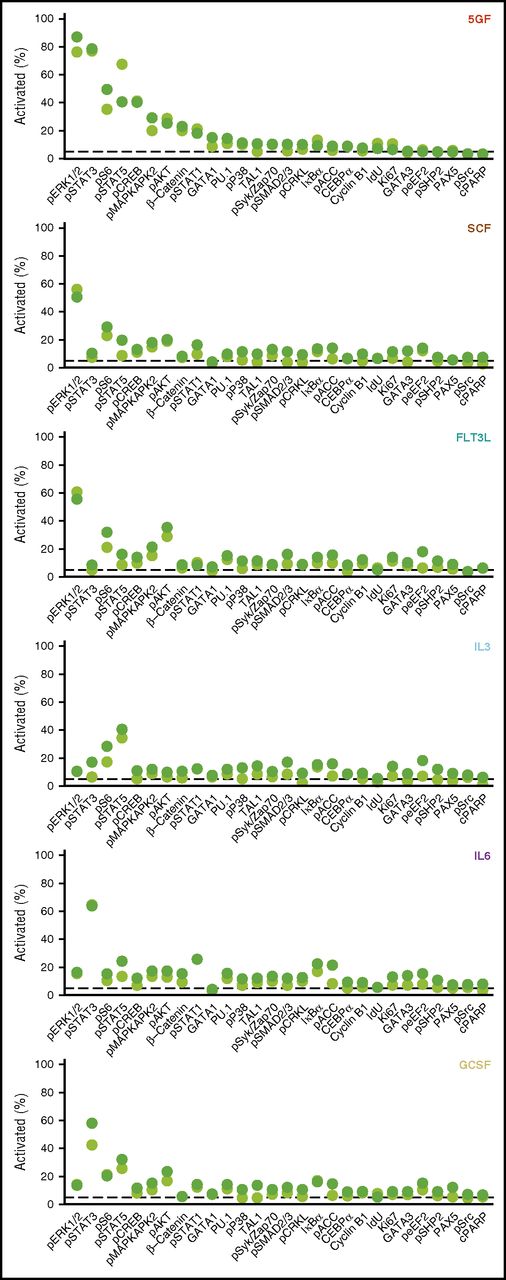
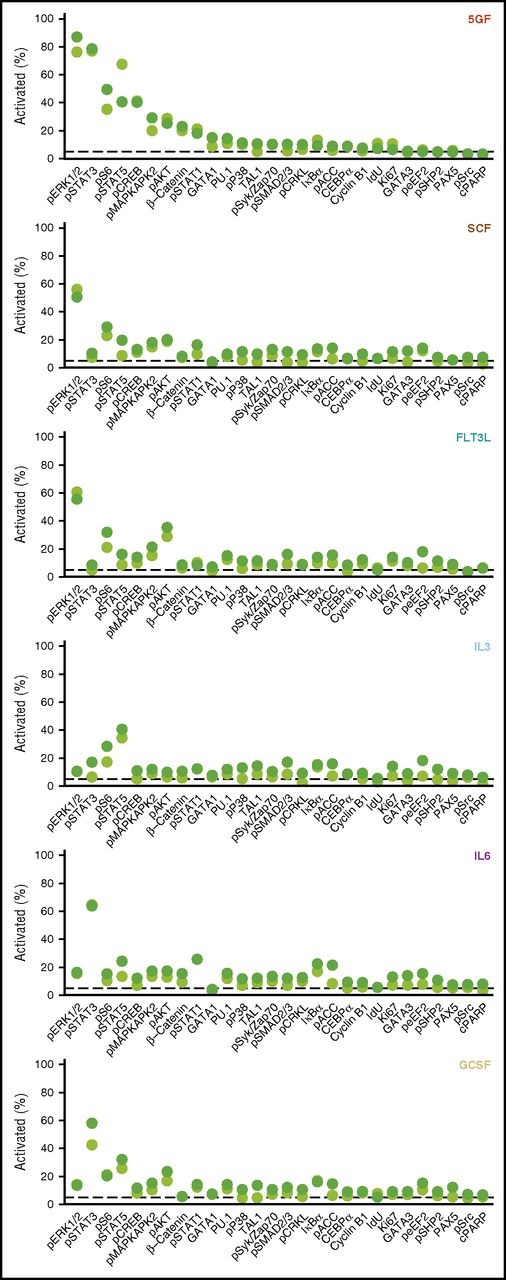
Measurement of the proportion of different subsets of CD49f+ cells that exhibited a response to each individual intracellular marker monitored (levels >95th quantile of the unstimulated cells) showed an increase in phospho-ERK1/2 to be the most frequent change seen (in 87% of the CD33+CD49f+ cells). The second most prevalently affected intermediates in the 5 GF–stimulated cells were STAT3, S6, STAT5, and CREB (40% to 79% activation, Figure 3). In cells stimulated by the 5 GFs, the corresponding values for activated AKT and β-catenin were only 23% and 25%, respectively. Frequencies of cells showing a detectable response to single factors were generally lower than those elicited by all 5 GFs combined. Maximal frequencies of activation to any single marker following single GF stimulation in the CD33+ subset ranged from 41% to 64%, with similar values in the CD33− subset (Figure 3).
Frequencies of CD33+ and CD33− subsets of CD49f+ CB cells exhibiting different GF-activated signaling responses. Cells were defined as activated when the measured levels were greater than the 95th quantile of unstimulated CD49f+ cells. The displayed frequency represents the maximum at any time point following stimulation with the indicated GF.
Frequencies of CD33+ and CD33− subsets of CD49f+ CB cells exhibiting different GF-activated signaling responses. Cells were defined as activated when the measured levels were greater than the 95th quantile of unstimulated CD49f+ cells. The displayed frequency represents the maximum at any time point following stimulation with the indicated GF.
Lineage-associated TF levels correlate with specific signaling events
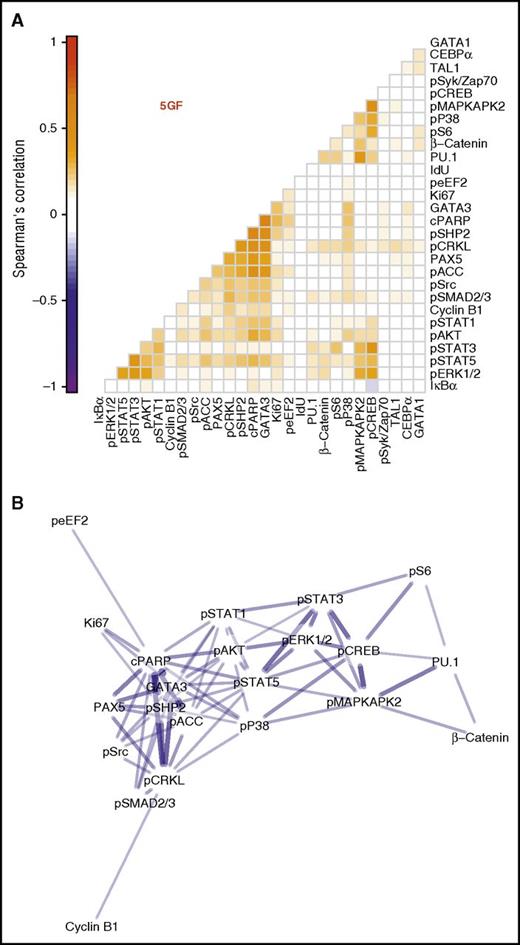
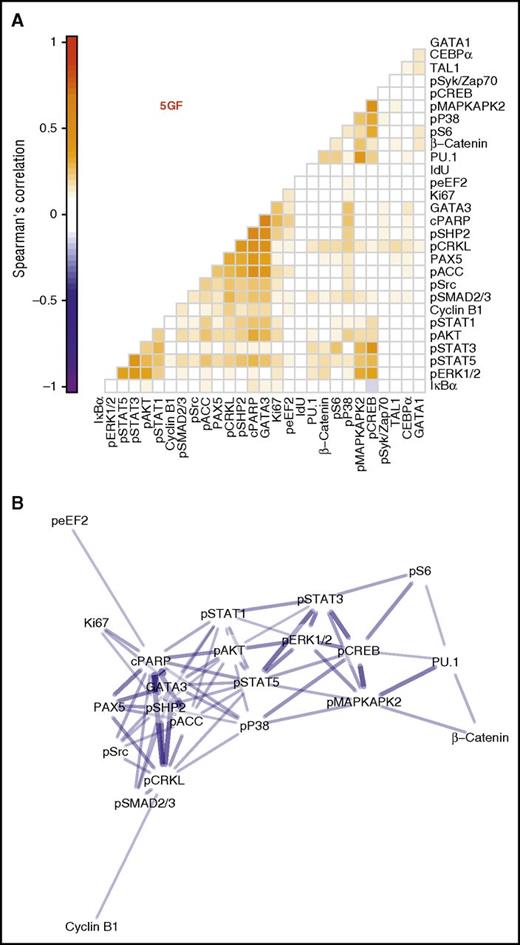
We next compared the kinetics of the 5 GF–stimulated effects on each of the intracellular markers examined in the CD33+ subset of the CD49f+ cells. This analysis involved calculating pairwise correlations for all periods of incubation of the cells with or without 5 GFs to achieve a spread of cells spanning all levels of change of all intracellular markers measured. Significant correlations were obtained between the levels of phosphorylated STAT1/3/5, ERK1/2, CREB, and AKT detected. This suggests that the 5 GFs activate the same pathways in parallel in responsive CD49f+ cells (Figure 4A; Spearman ρ = 0.17 to 0.41, Holm-corrected P values < .001).
Three distinct clusters of intracellular marker activation seen in the CD33+ subset of CD49f+ cells. Spearman correlations were calculated between each intracellular marker pair for all cells in the CD33+ subset of the CD49f+ cells following their stimulation with or without 5 GFs. (A) Pairwise correlations are shown between each marker with the color intensity indicating degree of correlation. Markers are ordered based on hierarchical clustering. (B) A network model with edges based on the correlation. Edges were included only when Holm-corrected P values were ≤.01 and the absolute value of Spearman ρ was ≥0.2. Node layout was calculated using the Fruchterman-Reingold algorithm with edge weights of 102abs(ρ).
Three distinct clusters of intracellular marker activation seen in the CD33+ subset of CD49f+ cells. Spearman correlations were calculated between each intracellular marker pair for all cells in the CD33+ subset of the CD49f+ cells following their stimulation with or without 5 GFs. (A) Pairwise correlations are shown between each marker with the color intensity indicating degree of correlation. Markers are ordered based on hierarchical clustering. (B) A network model with edges based on the correlation. Edges were included only when Holm-corrected P values were ≤.01 and the absolute value of Spearman ρ was ≥0.2. Node layout was calculated using the Fruchterman-Reingold algorithm with edge weights of 102abs(ρ).
Similar results were also obtained for the cells stimulated with just 1 of the 5 GFs (supplemental Figure 3). Interestingly, these data appeared to organize into 3 main clusters based on their pairwise correlations (Figure 4A). These included 1 cluster of activated signaling intermediates (STAT1/3/5, ERK1/2, AKT); another containing the myeloid TF, PU.1, as well as β-catenin, phospho-CREB, S6, p38, and MAPKAPK2; and a final cluster that contained the 2 lymphoid TFs, PAX5 and GATA3, together with cleaved PARP, phospho-SHP2, CRKL, ACC, Src, and SMAD2/3. Interestingly, when these are organized into a network, the myeloid TF-containing and lymphoid TF-containing clusters are separated, with both linking to the activated signaling cluster (Figure 4B). These results suggest GF-mediated signaling occurs coordinately within the CD33+ subset of CD49f+ cells and that specific signaling events may herald lineage fate decisions in very primitive human hematopoietic cells.
MPPs have lower tonic signaling than CD49f+ cells
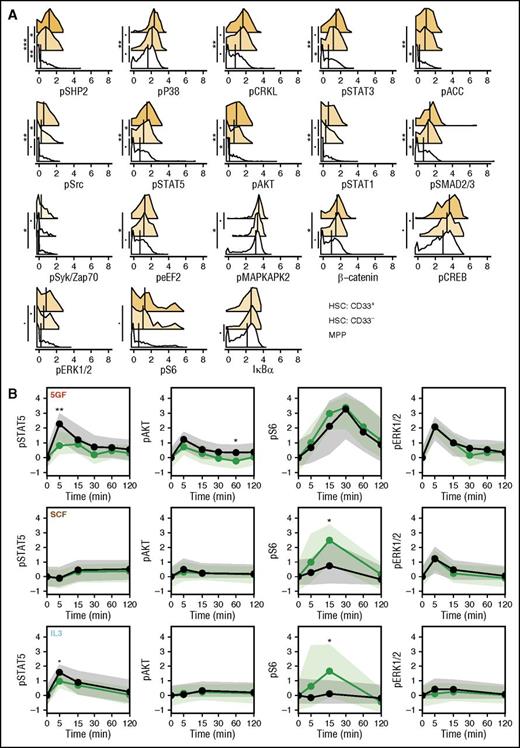
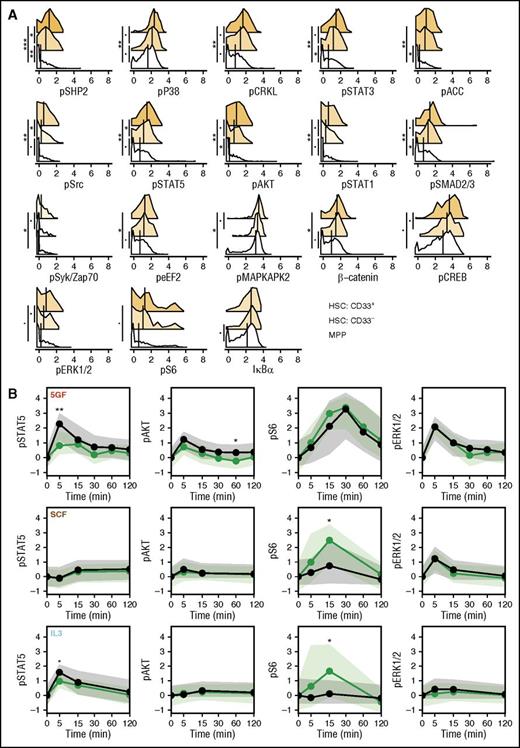
To gain further understanding of how GF-stimulated signaling responses may relate to the durability of repopulating ability in xenotransplantation models, we compared the CD33+ and CD33- subsets of the CD49f+ cells, with cells in the phenotypically defined MPP compartment. Analysis of the levels of all signaling markers in unstimulated MPPs revealed that these were generally lower than in the unstimulated CD49f+ cells (Figure 5A). A number of these (including phospho-SHP2 and STAT5) were also higher in the CD33+ subset of CD49f+ cells than in the matching CD33- subset (Figure 5A). However, for most conditions, the molecular responses of the MPPs were similar to those of the CD33+CD49f+ cells (after being corrected for their different baseline values; Figure 5B; supplemental Figure 4). However, the MPPs did show some differential GF-induced responses. These included slightly higher increases in activated STAT5 levels following stimulation with 5 GFs or IL-3, slightly higher increases in activated AKT levels following stimulation with 5 GFs, and reduced increases in activated S6 levels following stimulation with SCF or IL-3 (bootstrapped probabilities <0.05; Figure 5B).
CD49f+ cells have higher level of tonic signaling than MPPs. (A) Levels of each signaling intermediate are shown for the unstimulated cells in the CD33+ and CD33− subsets of the CD49f+ compartment and in the MPP compartment. Median values are shown as black lines. Histogram colors indicate the relative difference from the MPP compartment. (B) Median levels of phospho-STAT5, AKT, S6, and ERK1/2 over time corrected for the unstimulated values are shown as lines for the CD33+ subset (green) and the MPPs (black). Shaded areas indicate the interquartile ranges. Points are placed at each time. Bootstrapped probabilities are indicated as follows: •P = .1; *P = .05; **P = .01; ***P ≤ .001.
CD49f+ cells have higher level of tonic signaling than MPPs. (A) Levels of each signaling intermediate are shown for the unstimulated cells in the CD33+ and CD33− subsets of the CD49f+ compartment and in the MPP compartment. Median values are shown as black lines. Histogram colors indicate the relative difference from the MPP compartment. (B) Median levels of phospho-STAT5, AKT, S6, and ERK1/2 over time corrected for the unstimulated values are shown as lines for the CD33+ subset (green) and the MPPs (black). Shaded areas indicate the interquartile ranges. Points are placed at each time. Bootstrapped probabilities are indicated as follows: •P = .1; *P = .05; **P = .01; ***P ≤ .001.
AKT and β-catenin signaling regulate CD49f+ cell survival and mitogenesis
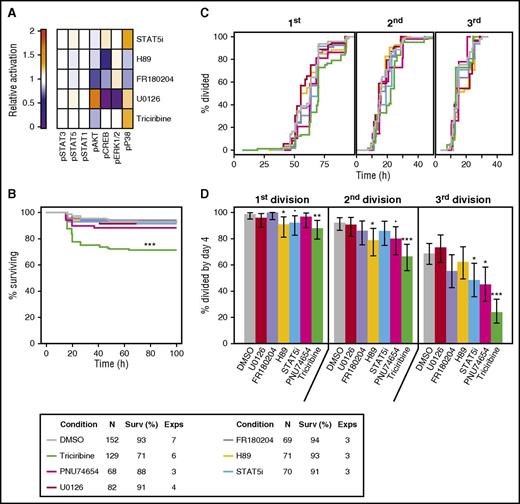
We next undertook a series of experiments to determine whether any of the GF-activated signaling pathways identified in the mass cytometry analyses are connected to specific biological responses of CD49f+ CB cells. Accordingly, we first tested known inhibitors for their optimal dose-specific effects on OCI-AML5 cells (a human acute myeloid leukemia [AML]-derived hematopoietic cell line24 that we found shows a similar profile of GF-activated molecular responses as the CD49f+ CB cells). The inhibitors thus selected were: triciribine for AKT, U0126 and FR18024 for ERK, H89 for PKA/CREB, STAT5i for STAT5, and PNU74654 for β-catenin (Figure 6A). We then initiated cultures of single CD49f+ cells and tracked their survival and division kinetics in the presence of 5 GFs, with or without these inhibitors at doses found to be optimal on OCI-AML5 cells. Only triciribine (the AKT inhibitor) showed a significant effect on CD49f+ cell survival (false discovery rate [FDR] < 0.001, Figure 6B) and, among the survivors, cell division was significantly delayed (fewer cells completing a first division within a 4-day follow-up period, FDRs ≤ 0.005, Figure 6C, and FDRs < 0.001, Figure 6D). The STAT5 inhibitor caused a slight decrease in the number of cells that completed a third division (FDR = 0.03, Figure 6C), as anticipated by the delay incurred in the timing of the first and second divisions (FDRs = 0.001 and 0.009, respectively, Figure 6D). The β-catenin inhibitor also produced slight decreases in the numbers of cells completing 2 and 3 divisions (FDR = 0.06 and 0.01, respectively, Figure 6C). In contrast, the inhibitors of PKA, MEK, and ERK had little effect on the 5-GF–stimulated division of CD49f+ cells, despite effects on GF-stimulated OCI-AML5 cells (Figure 6).
Inhibition of AKT, β-catenin, and STAT5 signaling blocks 5 GF effects on CD49f+ CB cell survival and proliferation. (A) Mean signaling differences from DMSO control in OCI-AML5 following stimulation with 5 GFs, determined after 5 minutes in the presence of triciribine or U0126, and after 15 minutes in the presence of the other inhibitors. (B) Kaplan-Meier survival curves for single CD49f+ cells cultured in either 5 GFs ± 1 µM U0126 (a MEK inhibitor), 3.1 µM FR180204 (an ERK1/2 inhibitor), 1.5 µM H89 (a PKA inhibitor), 15 µM STAT5 inhibitor (STAT5i), 50 µM PNU74654 (a β-catenin inhibitor), or 400 nM triciribine (an AKT inhibitor). (C) Percent of viable single cells observed to undergo 1, 2, and 3 cell divisions in the presence of 5 GFs ± the indicated inhibitors. (D) Cumulative distribution functions of the timing of the first, second, and third cell divisions of single CD49f+ cells cultured in 5 GFs ± the indicated inhibitors, where the second and third divisions were calculated for each clone individually. Median division times are indicated by the dotted lines. Statistical significance was tested compared with 5 GFs + DMSO. An FDR correction for multiple testing was applied. •P = .1; *P = .05; **P = .01; ***P ≤ .001. The legend in the top right indicates the color corresponding to each condition tested.
Inhibition of AKT, β-catenin, and STAT5 signaling blocks 5 GF effects on CD49f+ CB cell survival and proliferation. (A) Mean signaling differences from DMSO control in OCI-AML5 following stimulation with 5 GFs, determined after 5 minutes in the presence of triciribine or U0126, and after 15 minutes in the presence of the other inhibitors. (B) Kaplan-Meier survival curves for single CD49f+ cells cultured in either 5 GFs ± 1 µM U0126 (a MEK inhibitor), 3.1 µM FR180204 (an ERK1/2 inhibitor), 1.5 µM H89 (a PKA inhibitor), 15 µM STAT5 inhibitor (STAT5i), 50 µM PNU74654 (a β-catenin inhibitor), or 400 nM triciribine (an AKT inhibitor). (C) Percent of viable single cells observed to undergo 1, 2, and 3 cell divisions in the presence of 5 GFs ± the indicated inhibitors. (D) Cumulative distribution functions of the timing of the first, second, and third cell divisions of single CD49f+ cells cultured in 5 GFs ± the indicated inhibitors, where the second and third divisions were calculated for each clone individually. Median division times are indicated by the dotted lines. Statistical significance was tested compared with 5 GFs + DMSO. An FDR correction for multiple testing was applied. •P = .1; *P = .05; **P = .01; ***P ≤ .001. The legend in the top right indicates the color corresponding to each condition tested.
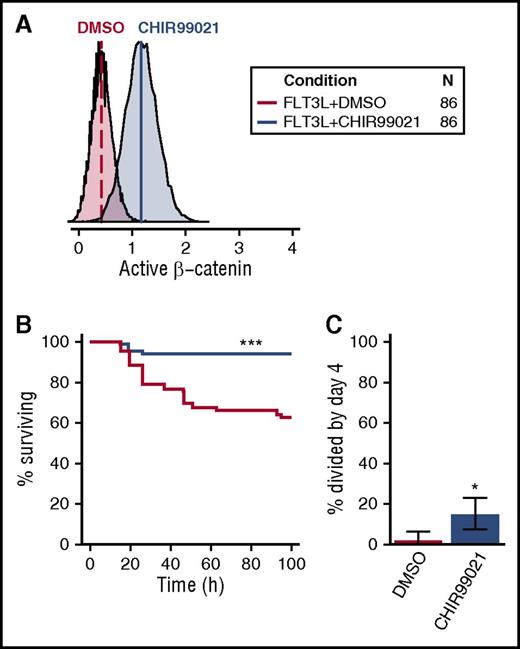
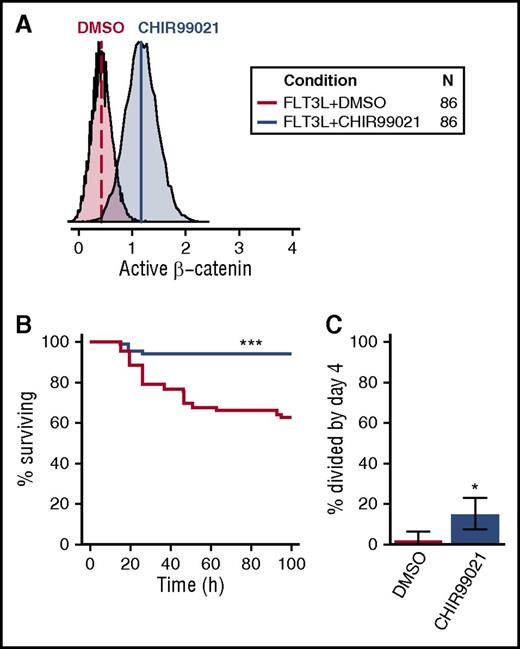
Given the selective activation of β-catenin in CD49f+ cells by all 5 GFs (Figure 5B), we asked whether CHIR99021, an activator of β-catenin signaling, would mimic its effect (Figure 7A). CHIR99021 stimulates β-catenin signaling by inhibiting GSK3β, a negative regulator of β-catenin. These experiments were carried out in cultures containing FLT3L because FLT3L activates AKT/MAPK signaling but not β-catenin (Figure 1B). Notably, the addition of CHIR99021 to FLT3L enabled a nearly complete maintenance of CD49f+ cell survival for 4 days, significantly improving that obtained with FLT3L alone (FDR < 0.001, Figure 7B). In addition, this treatment significantly enhanced the proportion of CD49f+ cells recruited into division in the same time frame (P = .015; Figure 7C). These results reinforce the likelihood that β-catenin contributes to both CD49f+ cell survival and their mitogenesis in a combinatorial fashion.
Activation of β-catenin promotes human CD49f+ CB cell survival and proliferation. (A) Activation of β-catenin following overnight exposure of OCI-AML5 to 3 µM CHIR99021. (B) Kaplan-Meier survival curves for single CD49f+ cells cultured in FLT3L ± 3 µM CHIR99021. (C) Percent of surviving CD49f+ cells recruited into division in FLT3L ± CHIR99021 (binomial 95% confidence intervals are shown). Statistical significance was tested compared with FLT3L + DMSO. An FDR correction for multiple testing was applied where relevant. •P = .1; *P = .05; **P = .01; ***P ≤ .001. The legend in the top right indicates the color corresponding to each condition tested and the total number of cells analyzed (in 4 independent experiments).
Activation of β-catenin promotes human CD49f+ CB cell survival and proliferation. (A) Activation of β-catenin following overnight exposure of OCI-AML5 to 3 µM CHIR99021. (B) Kaplan-Meier survival curves for single CD49f+ cells cultured in FLT3L ± 3 µM CHIR99021. (C) Percent of surviving CD49f+ cells recruited into division in FLT3L ± CHIR99021 (binomial 95% confidence intervals are shown). Statistical significance was tested compared with FLT3L + DMSO. An FDR correction for multiple testing was applied where relevant. •P = .1; *P = .05; **P = .01; ***P ≤ .001. The legend in the top right indicates the color corresponding to each condition tested and the total number of cells analyzed (in 4 independent experiments).
Discussion
Human HSCs exhibit rapid and direct pathway-specific molecular responses to GF stimulation
Despite the advances that have occurred in understanding key events that GFs elicit, their biological and molecular effects on human HSCs with long-term regenerative activity in vivo have not been defined. Here, we took advantage of recently developed analytical methods to enable the responses of single CD49f+ CB cells of sufficient purity to ensure that the responses measured included cells with functionally demonstrable long-term HSC activity. We found responses of CD49f+ cells to be highly GF-specific, generally involving predicted pathways. For example, MAPK and AKT activation followed SCF or FLT3 stimulation,27,28 STAT5 followed IL-3 stimulation,29 and STAT3 followed both IL-6 and G-CSF stimulation.30-32 However, a number of pathways predicted to act downstream of these GFs based on data from model systems were not seen in either human HSCs or MPPs. These include activation of STATs, SHP2, and Src by SCF,27,33,34 activation of Src, STAT1 and STAT3 by IL-3,29 and activation of SHP2 by FLT3L.28 The lack of activation of these pathways highlights the context dependence of the specific mechanisms by which GFs mediate their effects and hence the importance of investigating the specific signaling events they trigger directly in the cell type of interest. Interestingly, IL-6 induced rapid activation of STAT3, and later AKT, STAT1, and STAT5. This suggests that CD49f+ CB cells are, in fact, competent to respond directly to IL-6 despite older reports that the α subunit of the IL-6 receptor could not be detected on human HSCs.26 The present findings could, however, still reflect sequentially ordered responses that involve changes in IL-6 receptor expression or activity. Importantly, we also observed activation of β-catenin exclusively in response to all 5 GFs combined. In summary, these results highlight the risks in extrapolating signaling events from model systems, and the nonadditive nature of some downstream effects.
The synergy of 5 GFs in activating β-catenin in CD49f+ cells suggests downstream interactions between the pathways stimulated. ERK, AKT, and S6 kinase have all been shown to phosphorylate GSK3β, which inhibits its activity (and would thus be expected to increase the level of active β-catenin).35-37 AKT has also been shown to directly phosphorylate β-catenin resulting in increased transcriptional activity.35 STAT3 has been shown to stimulate expression of β-catenin and repress GSK3β transcription.38-40 Such mechanisms would thus be likely candidates to explain the observed synergistic activation of β-catenin in human CD49f+ CB cells exposed to the 5 GFs studied here.
AKT and β-catenin signaling regulate human HSC survival and proliferation
Our inhibitor experiments point to AKT as a primary regulator of human CD49f+ CB cell survival. However, dual activation of β-catenin (by exposure to a GSK3β inhibitor) and AKT (by exposure to FLT3L) produced a much greater survival stimulus than FLT3L alone, suggesting an additional pro-survival role of β-catenin. Thus, we speculate that the pro-survival activity of GFs that do not strongly activate AKT results from their activation of compensatory pathways in CD49f+ CB cells. At the same time, it is known that GSK3β can act on more than 100 targets, including the blockade of events activated by CREB.37 Thus, the present findings do not rule out a self-modulating effect of GSK3β inhibition on the signaling state of FLT3L-stimulated CD49f+ cells. On the other hand, the negative effect of inhibiting β-catenin on CD49f+ cell proliferation, strongly suggests that this response is directly modulated by β-catenin rather than an alternate downstream target of GSK3β.
Our findings also implicate a role of AKT, β-catenin, and, to a lesser extent, STAT5, in the GF-induced mitogenesis of human CD49f+ CB cells. The effect of AKT is consistent with studies of mouse HSCs in which activation of AKT induced their cycling41 and in which deleting it enforced their quiescence.42 Support for an involvement of AKT in the regulation of human HSCs also comes from its demonstrated increased activity in CD34+ CB cells in which a dominant-negative isoform of Ikaros (IK6) was used to stimulate expansion of transplantable HSCs in immunodeficient mice.43 β-catenin signaling has been associated with activation of a mouse HSC proliferative response,44 and an ability of AKT and β-catenin to promote HSC cycling in the human system is supported by the recently reported stimulatory effects of suppressing miR-126, which targets both AKT and β-catenin, and the opposite effects of forced microRNA-126 (miR-126) overexpression.45 The finding of increased STAT5 in chronic myeloid leukemia that has been pushed to an accelerated phase-like state by overexpression of IK6 also supports a role of STAT5 in regulating the proliferation of human HSCs.46
Cell signaling and blockade of HSC differentiation
How signaling events affect the maintenance of the stem cell state of human HSCs remains an unanswered question. In mice, enforced activation of AKT results in engraftment defects, HSC exhaustion, and leukemia.41 However, combined activation of AKT and β-catenin has been found to expand HSC numbers in vivo and to improve their maintenance in vitro.47 These results suggest that activation of both pathways may be necessary to block HSC differentiation; thus, the regenerative properties of HSCs may be differently regulated. Indeed, in studies modulating miR-126 in human HSCs, a loss of repopulating ability was not seen when miR-126 was suppressed (hence activating AKT and β-catenin).45 Activation of β-catenin in vitro in the absence of GFs but with mTOR inhibition has also been reported to maintain human HSC numbers,48 although this study did not rule out possible induced survival benefits.
The higher tonic signaling of CD49f+ cells compared with MPPs further suggests that some threshold level of signaling down multiple pathways plays a role in maintaining the human HSC state. Interestingly, gene ontology analysis of published transcriptome data (GSE29105)23 shows significant upregulation of terms including “cytokine-mediated signaling pathway,” “cell-cell signaling,” “intracellular signal transduction,” and “signal transduction” in CD49f+ cells compared with MPPs (P ≤ .005). In addition, 1 of the most underexpressed genes in CD49f+ cells compared with MPPs is the protein tyrosine phosphatase, PTPRD,23 consistent with the concept that CD49f+ cells have a higher basal signaling state.
We also found a number of signaling events in CD49f+ cells that correlated with their levels of either PU.1, a myeloid TF, or PAX5 and GATA3, 2 lymphoid TFs. Each of these clusters showed correlations with a third cluster defined by the levels of activated MAPK, AKT, and JAK-STAT intermediates. Notably, some of the signaling responses that correlated with PU.1 levels were activated by GFs that also activated CREB, S6, and β-catenin, whereas those that correlated with PAX5 and GATA3 levels were not activated by the same GFs.
In summary, we report the feasibility of performing a multiparameter screen of changes in activated signaling intermediates in single human CD49f+ CB cells stimulated by GFs that together promote HSC survival and proliferation and retain their regenerative activity. The results identify both additive and nonadditive effects of the 5 GFs tested alone and in combination. Functional analyses subsequently revealed activated AKT and β-catenin as critical, but not exclusive determinants of the survival and proliferation response of these cells. These findings set the stage for future development of improved strategies to manipulate human HSCs and elucidate pathways that are deregulated in leukemic stem cells.
The online version of this article contains a data supplement.
The publication costs of this article were defrayed in part by page charge payment. Therefore, and solely to indicate this fact, this article is hereby marked “advertisement” in accordance with 18 USC section 1734.
Acknowledgments
The authors thank Margaret Hale and Glenn Edin for technical assistance and the British Columbia Cancer Agency Stem Cell Assay Laboratory for assistance in the processing and cryopreservation of CB samples.
This work was supported by a Terry Fox Foundation New Frontiers Program Project Grant, the Stem Cell Network of Centres of Excellence, the Canadian Institutes of Health Research (CIHR) Collaborative Health Research Project (C.J.E.); the Human Frontier Science Program, the Leukemia and Lymphoma Society of Canada, the Ministry of Research and Innovation of Ontario, and the University of Toronto Canada Research Chair in Stem Cell Bioengineering (P.W.Z.);a CIHR Vanier Scholarship (D.J.H.F.K.); a CIHR Frederick Banting and Charles Best Canada Doctoral Scholarship (P.H.M.); a CIHR fellowship (N.A.); Ontario Graduate Scholarships and a National Science and Engineering Research Council postgraduate scholarship (W.Q.); and an Ontario Stem Cell Initiative postdoctoral fellowship (W.W.).
Authorship
Contribution: D.J.H.F.K. and C.J.E. designed the experiments and wrote the manuscript; D.J.H.F.K. and C.A.H. performed the experiments; D.J.H.F.K. performed the final data analysis; P.H.M., P.A.B., R.K.H., C.H., G.S., and P.W.Z. assisted with experimental designs and interpretation; N.A., D.P., and K.S. helped with data analysis and interpretation; S.C.B. and G.P.N. assisted with the design of the CyTOF panel and experiments; W.Q. and W.W. performed CyTOF experiments on alternative GF cocktails; and all authors read and approved the final manuscript.
Conflict-of-interest disclosure: The authors declare no competing financial interests.
Correspondence: Connie J. Eaves, Terry Fox Laboratory, BC Cancer Research Centre, 675 West 10th Ave, Vancouver, BC V5Z 1L3, Canada; e-mail: ceaves@bccrc.ca.

