

Key Points
The majority of TCLs are clonotypically oligoclonal, although the patterns of oligoclonality are varied.
TCR rearrangements in TCL show a biased usage of V and J segments and presentation of public CDR3 sequences shared across unrelated patients.

Abstract
Mature T-cell lymphomas (TCLs) are rare, clinically heterogeneous hematologic cancers with high medical need. TCLs have an inferior prognosis which is attributed to poor understanding of their pathogenesis. On the basis of phenotypic similarities between normal and neoplastic lymphocytes, it has been assumed that TCLs develop in the periphery, directly from various subtypes of normal T cells. To address the debated question of the cell of origin in TCLs, we attempted to identify the highly variable complementarity-determining regions (CDRs) of T-cell receptors (TCRs) to trace the clonal history of the T cells. We have collected previously published whole-genome, whole-exome, and whole-transcriptome sequencing data from 574 patients with TCL. TCR clonotypes were identified by de novo assembly of CDR3 regions of TCRα, TCRβ, and TCRγ. We have found that the vast majority of TCLs are clonotypically oligoclonal, although the pattern of oligoclonality varied. Anaplastic large-cell lymphoma was the most diverse comprising multiple clonotypes of TCRα, TCRβ, and TCRγ, whereas adult TCL or leukemia and peripheral TCLs often showed monoclonality for TCRβ and TCRγ but had diverse TCRα clonotypes. These patterns of rearrangements indicated that TCLs are initiated at the level of the lymphoid precursor. In keeping with this hypothesis, TCR rearrangements in TCLs resembled the pattern seen in the human thymus, which showed biased usage of V (variable) and J (joining) segments of high combinatorial probability resulting in recurrent public CDR3 sequences shared across unrelated patients and different clinical TCL entities. Clonotypically diverse initiating cells may seed target tissues that are then responsible for disease relapses after therapy.
Introduction
T-cell lymphomas (TCLs) are a heterogenous group of 29 malignancies that make up ∼10% of non-Hodgkin lymphomas, and their incidence is about 6000 cases per million.1,2 Most TCLs are classified as mature TCLs because malignant cells phenotypically resemble mature T cells and harbor rearranged T-cell receptor (TCR) variable (V), diversity (D), and joining (J) genes; many express the TCR αβ heterodimer.3,4 Striking similarities between subsets of normal T cells and the malignant cells in TCLs (eg, to T-regulatory cells in adult TCL or leukemia or central memory T cells to Sezary syndrome [SS]) led to the general acceptance of the theory that different subsets of mature T cells are the cells of origin in mature lymphomas.5
TCR gene sequences are excellent markers of T-cell lineage, because TCRγ, TCRβ, and TCRα loci are sequentially rearranged during different stages of intrathymic maturation of T cells from a diverse pool of V(D)J genes. The TCRβ locus contains 47 V (TRBV), 2 D (TRBD), and 13 J (TRBJ) segments, whereas the TCRα locus comprises 42 TRAV and 61 TRAJ segments, which recombine to yield unique DNA sequences that are retained in genomes of all daughter cells.6 This diversity of the unique DNA sequences is enhanced by the insertion of random palindromic sequences during the recombination step of V(D)J or VJ. Analysis of the complementarity determining region 3 (CDR3), the most diverse fragment of the TCR chain coded by the V(D)J joining region and involved in antigen recognition, has long been used in the molecular diagnosis of TCLs and leukemias. The repertoire of normal human TCRs is in the range of 106 to 107 clonotypes (unique CDR3 sequences defining a T-cell clone),7-9 whereas in mature TCLs, it is dominated by a single clonotype, representing the clonally expanded malignant cells (ie, malignant clonotypes).10
Clonotypic analyzes of TCLs and leukemias are not only useful for diagnostic purposes but might also provide important clues to the pathogenesis. Transformation of the mature T cell would result in perfect monoclonality in all TCR loci because TCR rearrangement does not occur in mature T cells, and TCRα and TCRβ clonotypes would be inherited from the cell of origin. A different pattern of TCR rearrangement will be seen if the transformation occurs during earlier stages of T-cell development, before the completion of the final TCRα rearrangement. Assuming that early oncogenic mutations do not arrest cell development at the early stages (as is the case in T-cell acute lymphoblastic leukemia [T-ALL]), the T-cell is able to sequentially rearrange TCR, and one would expect oligoclonal or polyclonal patterns of clonotypes, characteristic of the stage in which the transformation happened. Indeed, our previous analyses of malignant T-cell clonotypes in cutaneous TCL revealed an oligoclonal pattern of TCRα and TCRβ but monoclonality of TCRγ, which suggests that original malignant transformation occurred at the stage of a double-negative thymocyte after rearrangement of the TCRγ locus.11,12 A similar pathogenic scenario involving early thymocytes has been proposed for anaplastic large-cell lymphoma (ALCL),13,14 but it is unclear whether other TCLs might also be derived from immature T cells.
During analysis of our CTCL sequencing data, we were puzzled by the finding that certain malignant clonotypes were repeatedly found in samples from unrelated patients; because of the vastness of the TCR repertoire, we had expected that malignant clonotypes would be unique for each patient. We have noted a preferential usage of certain Vα and Vβ segments in cutaneous TCLs11 and were intrigued by the finding that similar biases in V-segment usage was reported in T-ALL, which is derived from lymphoid precursors arrested at various stages of development.15,16
In this study, we used the previously optimized bioinformatic pipeline for de novo assembly of CDR3 regions using paired-end RNA sequencing, whole-genome DNA sequencing (WGS), and whole-exome DNA sequencing (WES)11 to analyze malignant TCR clonotypes in 574 samples that make up 8 major subtypes of TCL. We propose that TCR rearrangement patterns across different clinical TCL entities are incompatible with the mature T-cell transformation hypothesis and support the immature lymphoid progenitor as the cell of origin.
Methods
TCL data collection and tumor cell fraction analysis
The graphical summary of the methods is shown in Figure 1. Raw fastq files of WES, WGS, and whole-transcriptome sequencing (WTS) were collected from 13 different studies (574 patients).17-29 Ethics clearance to access the human genome data from restricted databases such as Database of Genotype and Phenotype (dbGaP) and European Genome-phenome Archive (EGA) was provided by the Health Research Ethics Board of the Alberta Cancer Committee under ethics ID-HREBA.CC-20-0118. In addition, samples from 50 healthy controls were also obtained.30 The accession numbers of the studies are listed in supplemental Table 1, and the diagnostic groupings are listed in supplemental Table 2. Tumor cell fraction (TCF) was determined on the basis of copy number aberrations (CNAs) using Titan CNA (v. 1.17.1)31 and/or Ichor CNA (v. 0.2.0)32 in the 368 samples for which DNA sequencing data were available (supplemental Table 3). Data sets from Crescenzo et al29 (SRP044708) lacked control DNA and therefore, a panel of normal, as recommended in the Genome Analysis Toolkit (GATK) pipeline,33 was created to analyze the TCF for samples from that study. The majority of transcriptome data were not obtained from the same samples as their exome counterparts; therefore, TCF data calculated using the DNA sequencing was not applicable to the TCRs identified from the RNA sequencing.
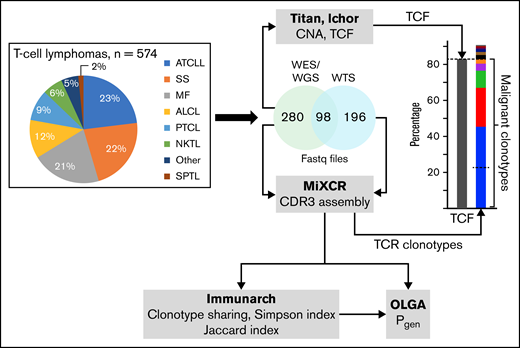
Summary of the methodological approach to TCR analysis in TCLs. The pie chart represents the percentage of sequencing samples collected from different subtypes of TCLs that were analyzed for TCF and the TCR clonotypes. Details for the diagnostic groupings are provided in supplemental Table 2. TCF was estimated on the basis of the chromosomal aberration identified using TitanCNA or IchorCNA. TCR clonotypes were identified using MiXCR. The diversity index (inverse Simpson), clonotype sharing (Jaccard index), and probability of clonotype generation (Pgen) were analyzed using Immunarch and OLGA pipelines, as described in “Methods.” SPTL, subcutaneous panniculitic TCL.
Summary of the methodological approach to TCR analysis in TCLs. The pie chart represents the percentage of sequencing samples collected from different subtypes of TCLs that were analyzed for TCF and the TCR clonotypes. Details for the diagnostic groupings are provided in supplemental Table 2. TCF was estimated on the basis of the chromosomal aberration identified using TitanCNA or IchorCNA. TCR clonotypes were identified using MiXCR. The diversity index (inverse Simpson), clonotype sharing (Jaccard index), and probability of clonotype generation (Pgen) were analyzed using Immunarch and OLGA pipelines, as described in “Methods.” SPTL, subcutaneous panniculitic TCL.
TCR clonotype identification and quantification
TCR clonotypes were identified and quantified using MiXCR (v. 3.0.3 or 3.1.0).34 We used superscript letters to indicate whether the clonotype was identified by the DNA, RNA, or amino acid (aa) sequence (eg, TCRαDNA). Default recommendations for analysis of exome and transcriptome data were used with the exception of eliminating the assembly of short reads to identify additional TCR clonotypes. Short- and long-read alignments were included for WTS; however, for WES data, partial reads were filtered out because they might be the captures of only V or J sequences. After clonotypes were identified, further elimination of clonotypes based on mutational positions was performed and best predictive VJ combinations were included in further analyses. When TCFs were available, the malignant clonotypes (ie, clonotypes of the malignant T cells) were determined by including the most abundant clonotypes to match the TCFs of the sample (Figure 1). Shared clonotype identification was based on TCRβaa and was used to calculate clonotype sharing (Jaccard index) with Immunarch (v. 0.6.6).35 An estimate of the diversity was limited to malignant clonotypes. To estimate the number of malignant TCRβ clonotypes, the clonotypes of the cumulative frequency matching TCFs from every sample were counted and averaged. On the basis of the average number of clonotypes of 9.4, the 10 most frequent clonotypes from every sample were used for the inverse Simpson index. Probability of generation (Pgen) of CDR3 was calculated using OLGA (v. 1.2.3)36 for the TCL samples and samples from the 50 healthy controls. Immunarch, Graphpad Prism (v. 9), and Excel (v. 16.16.27) were used for data representation.
Results
Clonotypic TCRβ diversity in TCLs
We analyzed data from 574 samples from the following TCL diagnoses: mycosis fungoides (MF; a primary cutaneous TCL; n = 122), SS (leukemic form of primary cutaneous TCL; n = 130), ALCL (n = 67), adult TCL or leukemia (ATCLL; n = 135), natural killer TCL (NKTL; n = 25), peripheral TCL (PTCL; n = 55), and subcutaneous panniculitis‐like TCL (SPTL; n = 10). We were unable to classify 30 samples into any of the above categories, which were grouped as “other TCLs” (supplemental Table 2).
To determine the sequences of CDR3, we used the previously described bioinformatic analysis of bulk sequencing data from WES, WGS, and WTS.11 To differentiate between malignant clonotypes (ie, clonotypes derived from malignant T cells) and those contributed from the infiltrating reactive cells, we ranked the TCRDNA clonotypes (clonotypes obtained from DNA sequencing) starting with the most abundant and included only those of the cumulative frequency matching the TCF in the sample (Figure 1).12
Among 378 samples for which genomic data (WES or WGS) was available for calculating TCFs, the majority (75%) showed more than 1 TCRβDNA clonotype attributed to malignant T cells (matching TCF) (Figure 2). We considered 3 rearrangements as evidence of oligoclonality because although ∼60% of T cells rearrange TCRβ on only 1 chromosome, the remaining 40% are biallelic rearrangements (the 60-40 rule).37,38 Oligoclonality of malignant clonotypes was most prevalent in ALCL (43 of 47) and least common in NKTL (12 of 25) (Figure 2).
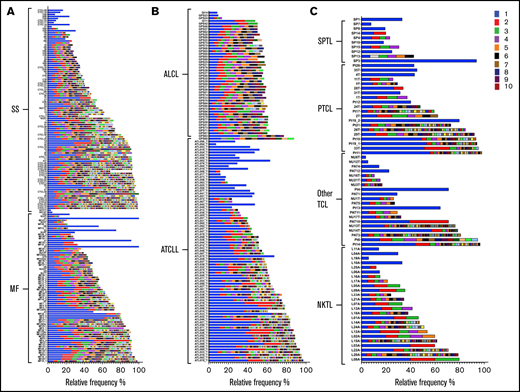
Frequency of TCRβDNA clonotypes in TCLs. A total of 378 DNA samples from 8 subtypes of TCLs were analyzed to identify the frequency of TCF and TCRβDNA clonotypes using WES and WGS data. TCRβDNA clonotypes corresponding to the TCF are indicated by the colored bars in the descending order of relative frequencies (the most abundant, rank 1, is the bright blue bar). The data are split by diagnosis: (A) cutaneous lymphomas: MF, and SS, (B) ALCL and ATCLL, and (C) SPTL, PTCL, Other TCL, and NKTL.
Frequency of TCRβDNA clonotypes in TCLs. A total of 378 DNA samples from 8 subtypes of TCLs were analyzed to identify the frequency of TCF and TCRβDNA clonotypes using WES and WGS data. TCRβDNA clonotypes corresponding to the TCF are indicated by the colored bars in the descending order of relative frequencies (the most abundant, rank 1, is the bright blue bar). The data are split by diagnosis: (A) cutaneous lymphomas: MF, and SS, (B) ALCL and ATCLL, and (C) SPTL, PTCL, Other TCL, and NKTL.
The allelic exclusion of TCRβ locus ensures that a mature T cell expresses only 1 clonotype,37 even in the presence of biallelic rearrangements.39,40 Thus, the single TCRβ clonotype at the level of RNA (TCRβRNA) unequivocally identifies the T-cell clone. TCFs could not be calculated for WTS samples because the matching WES or WGS data were not available; therefore, we analyzed TCRβ clonality by applying the relative frequency threshold of 25%. This threshold has been proposed by other investigators,41,42 and we considered it reasonable to adopt that frequency threshold because the majority (79% of TCL samples) had TCFs of 25% or higher (supplemental Table 3). In 26% of the samples, the most abundant TCRβRNA clonotype had a frequency below 25% (ie, the criterion of monoclonality was not met; Figure 3). In 6 samples. the relative frequency of the second most frequent TCRβRNA clonotype was >25%, and in 38 samples, the frequencies of the first and second clonotypes were comparable (no single dominant clonotype), indicating oligoclonality of malignant clonotypes.
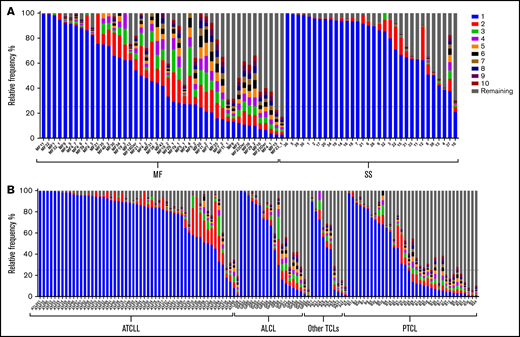
Frequency of TCRβRNA clonotypes in TCLs. A total of 196 RNA samples from 6 subtypes of TCLs were analyzed to identify the frequency of the TCRβRNA clonotypes. The 10 most abundant clonotypes are indicated by using the same color coding as in Figure 2; the remaining clonotypes are merged and their combined frequency is indicated by the gray bars. The data are split by diagnosis: (A) cutaneous lymphomas: MF and SS, (B) ATCLL, ALCL, Other TCLs and PTCL.
Frequency of TCRβRNA clonotypes in TCLs. A total of 196 RNA samples from 6 subtypes of TCLs were analyzed to identify the frequency of the TCRβRNA clonotypes. The 10 most abundant clonotypes are indicated by using the same color coding as in Figure 2; the remaining clonotypes are merged and their combined frequency is indicated by the gray bars. The data are split by diagnosis: (A) cutaneous lymphomas: MF and SS, (B) ATCLL, ALCL, Other TCLs and PTCL.
We further assessed the diversity of the TCRβ clonotypes by using the inverse Simpson index, which varies from 1 (1 clonotype) to the maximum value representing the number of clonotypes (in our analysis, n = 10), taking into account clonotype concentration (supplemental Figure 1). For the TCRβDNA clonotypes, the diversity was highest in SS and ALCL, and lowest in ATCLL. The diversity of TCRβRNA clonotypes had a slightly different pattern with a decrease in diversity for SS and ALCL when compared with TCRβDNA clonotypes. This can be explained by the increase in the relative contribution of the most abundant TCRβRNA clonotype (higher clonotype concentration) relative to TCRβDNA which, in turn, is likely to be caused by a higher proportion of non-productively rearranged TCRβ loci. The mean diversity for MF, ATCLL, and PTCL remain the same for TCRβDNA and TCRβRNA.
Patterns of TCRα, TCRβ, and TCRγ corroborate a branched evolution model of TCLs
The analyses described above suggested that TCR monoclonality is not a constant feature of TCLs, and approximately one-third of all samples display an oligoclonal pattern of malignant TCRβ, which is incompatible with the hypothesis of the mature T-cell origin hypothesis. To explore this further, we analyzed the frequencies of TCRα and TCRγ clonotypes. Unlike TCRβ, TCRα and TCRγ loci are not subjected to allelic exclusion and are usually rearranged at both chromosomes (Figure 4A). Moreover, TCRγ is rearranged before TCRβ, so the cells with the same TCRγ rearrangement may harbor several TCRβ rearrangements. The same is true for TCRα; a single TCRβ clone may comprise several (usually 2-4) TCRα clonotypes because of biallelic rearrangement and secondary rearrangements during expansion of the TCRβ clone (Figure 4A). It is thus possible to deduce the stage of T-cell transformation from the relative frequencies of TCRα, TCRβ, and TCRγ.
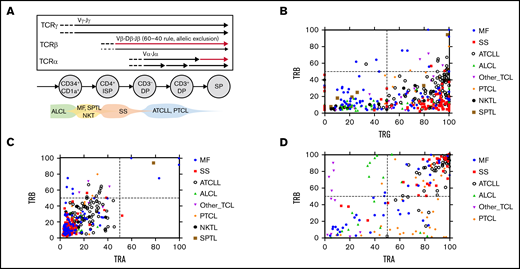
Oligoclonality in TCLs. (A) Schematic presentation of the TCR gene rearrangement during T-cell development. The arrows represent rearrangement on each chromosome mapped to different stages of a normal human thymocyte. The thin arrow for TCRβ symbolizes the 60-40 rule. Predicted time points of the transformation in various subtypes of TCLs are shown at the bottom. (B-C) WES and WGS samples (n = 367) were analyzed to identify the TCRαDNA, TCRβDNA, and TCRγDNA clonotypes. (C) The frequency of the most abundant TCRβDNA clonotype was plotted vs the added frequency of the 2 most frequent TCRγDNA clonotypes or the 2 most abundant TCRαDNA clonotypes for each sample. (D) A similar correlation plot of the frequency of dominant TCRβRNA clonotypes vs the dominant TCRαRNA clonotypes (data from 196 WTS samples). DP, double positive; ISP, immature single positive; SP, single positive.
Oligoclonality in TCLs. (A) Schematic presentation of the TCR gene rearrangement during T-cell development. The arrows represent rearrangement on each chromosome mapped to different stages of a normal human thymocyte. The thin arrow for TCRβ symbolizes the 60-40 rule. Predicted time points of the transformation in various subtypes of TCLs are shown at the bottom. (B-C) WES and WGS samples (n = 367) were analyzed to identify the TCRαDNA, TCRβDNA, and TCRγDNA clonotypes. (C) The frequency of the most abundant TCRβDNA clonotype was plotted vs the added frequency of the 2 most frequent TCRγDNA clonotypes or the 2 most abundant TCRαDNA clonotypes for each sample. (D) A similar correlation plot of the frequency of dominant TCRβRNA clonotypes vs the dominant TCRαRNA clonotypes (data from 196 WTS samples). DP, double positive; ISP, immature single positive; SP, single positive.
Interestingly, most TCL samples showed a clearly monoclonal pattern of TCRγ dominated by 1 or 2 clonotypes (supplemental Figure 2). By plotting the frequency of the dominant (most abundant) TCRβDNA clonotype vs that of the 2 most abundant TCRγ clonotypes (Figure 4B), most of the cases fall into 2 categories. The samples located in the lower left quadrant had low-frequency TCRβDNA and low-frequency TCRγ and represented 32% of samples classified as oligoclonal for both TCRβ and TCRγ. Most ALCL cases were found in this group. The remaining (68%) of the samples showed a high proportion of TCRγ and a disproportionately low frequency of TCRβDNA (lower right quadrant), which indicates TCRγ monoclonality but oligoclonality with respect to TCRβ. Only single cases of TCL were in the right upper quadrant representing the high frequency of TCRβ and TCRγ, which would be characteristic for an expansion of a single mature T-cell clone. A similar plot of the frequencies of the dominant TCRβDNA vs the combined frequencies of the first and second (biallelic) TCRαDNA showed a linear correlation within the lower left quadrant, which represents oligoclonality in both chains (Figure 4C). The samples clustered into 2 major groups: those with the higher frequency of TCRα and TCRβ (mostly ATCLL) and those with a lower frequency occupying the low-frequency portion of the quadrant (Figure 4C). The analysis of the TCRαRNA and TCRβRNA clonotypes helped interpret the findings. As shown in Figure 4D, most ATCLL and SS samples showed monoclonality because they were located in the right upper quadrant, which represents high frequencies of the dominant clonotypes. However, ALCL, PTCL, MF, and other TCLs were scattered in the remaining quadrants, which underscores their oligoclonality not only at the DNA level but also at the level of TCR gene expression.
Although the above described findings showed significant variation in TCR clonality patterns within the same TCL diagnostic entities, general conclusions can be made regarding the putative cell of origin (Figure 4A). ALCL was the most heterogeneous with the clear oligoclonality of TCRα, TCRβ, and TCRγ, which indicated that the transformation takes place in immature thymocytes before the TCRγ recombination step. On the opposite end of the spectrum were SS and ATCLL, which in the majority of cases showed TCRγ monoclonality and high frequency of TCRβ, mapping the transformation event approximately at the TCRβ rearrangement step. However, none of the TCLs exhibited a consistent pattern of monoclonality, defined at the DNA level by a maximum of 2 rearrangements of each TCRγ, TCRβ, and TCRα genes matching the TCF and at the RNA level by a single dominant TCRβ clonotype and a maximum of 2 TCRα clonotypes.
On the basis of the above described results, we hypothesized that TCRβDNA clonotypes may label neoplastic T-cell clones in the sample, and the distribution of those clonotypes is not random but might be a result of the clonal evolution of the disease. Systems comprising objects that grow in size and compete with each other (such as growth of cancer subclones in a tumor) often obey power laws such as Zipf-Mandelbrot law expressed as where S(k) is the size of the species (in our case, the size of the TCRβDNA clonotype) of the rank k, S(1) is the size of the first ranked species, and γ is a scaling constant.43,44 Indeed, the log-log plots in which mean abundance of the TCRβDNA clonotype was plotted vs its rank revealed the expected linear relationship for all TCLs, although the slope of the linear regression line varied from −0.34 for ALCL to −1.21 for ATCLL, which reflects different values of the constant γ for different types of TCLs (supplemental Figure 3). Reproducible linearity of the rank-size TCRβ plots for different TCLs were therefore consistent with zipfian dynamics45 and supported the hypothesis that malignant T-cell clones are dynamically coherent and interactively evolve via neutral clonal evolution,44 as postulated by us for MF.17
Biased V and J usage in TCLs
Previous studies have shown biased rearrangement of certain TCR V and J gene combinations,46,47 but it is not clear whether those findings are generalizable to all TCLs. We calculated the frequencies with which V and J genes are represented in the most abundant clonotype of TCRβ (Figure 5) or the 2 most abundant clonotypes in TCRα and TCRγ (Figure 6). There was a strong preferential usage of certain Vβ and Vα segments across different TCLs. The most striking was Vβ20-1 (TRBV20-1), which was found in a large proportion of clonotypes in MF, SS, ATCLL, ALCL, and NKTL, at the level of both DNA and RNA. Vβ4-1 (TRBV4-1) was overrepresented in ALCL, NKTL, and SPTL. Other Vβ segments were more disease-specific, such as TRBV18, which was was often found in MF and TRBV24-1, which was frequent in PTCL. Biased use of Vα segments was also obvious; for example, Vα16 (TRAV16), Vα35 (TRAV35), Vα41 (TRAV41), and Vα3 (TRAV3) were overrepresented in most TCLs. The Jβ and Jα segments also seemed to be unequally used (eg, TRBJ2-1 and TRBJ2-7 overexpression in all subtypes of TCLs) but because of a small number of J genes, the patterns are less obvious (Figures 5 and 6).
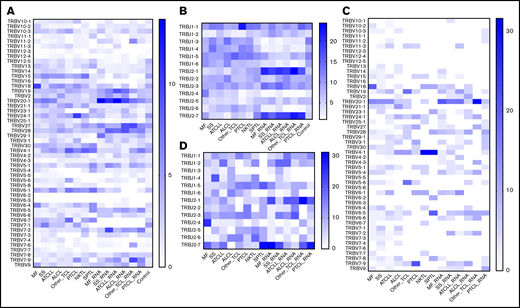
Vβ and Jβ (TRBV/TRBJ) usage in TCLs. The identified TCRβDNA and TCRβRNA clonotypes from WES, WGS, and WTS data for the TCL diagnoses and control blood lymphocytes to identify preferential TRBV and TRBJ segment usage. (A-B) TRBV and TRBJ frequencies, respectively, in the 10 most abundant clonotypes. (C-D) Plots similar to those in panels A and B with the inclusion of the single most abundant clonotype. The control group is absent in panels C and D because of the lack of a high-frequency clonotype in these samples.
Vβ and Jβ (TRBV/TRBJ) usage in TCLs. The identified TCRβDNA and TCRβRNA clonotypes from WES, WGS, and WTS data for the TCL diagnoses and control blood lymphocytes to identify preferential TRBV and TRBJ segment usage. (A-B) TRBV and TRBJ frequencies, respectively, in the 10 most abundant clonotypes. (C-D) Plots similar to those in panels A and B with the inclusion of the single most abundant clonotype. The control group is absent in panels C and D because of the lack of a high-frequency clonotype in these samples.
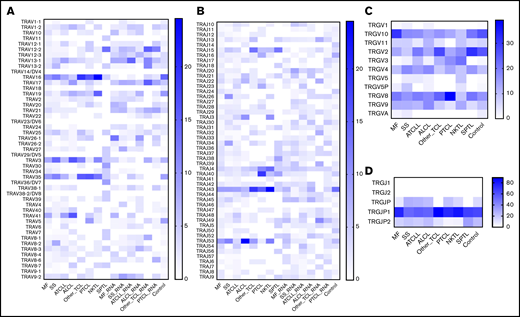
V and J (TRAV, TRAJ, TRGV, and TRGJ) usage in TCLs. The frequency of V and J segments of TCRα and TCRγ clonotypes are plotted as in Figure 7. The 2 most abundant TCRαDNA and TCRγDNA clonotypes from TCLs and control samples were identified, and the frequency of V and J segments were plotted on the heat map. The RNA samples were used only for identification of the TCRαRNA clonotypes. (A-B) TRAV and TRAJ segment usage; (C-D) TRGV and TRGJ segment usage.
V and J (TRAV, TRAJ, TRGV, and TRGJ) usage in TCLs. The frequency of V and J segments of TCRα and TCRγ clonotypes are plotted as in Figure 7. The 2 most abundant TCRαDNA and TCRγDNA clonotypes from TCLs and control samples were identified, and the frequency of V and J segments were plotted on the heat map. The RNA samples were used only for identification of the TCRαRNA clonotypes. (A-B) TRAV and TRAJ segment usage; (C-D) TRGV and TRGJ segment usage.
We have also analyzed V and J segment usage in the 10 most abundant TCRβ clonotypes, which represents the median number of malignant clonotypes determined in comparison with TCFs. The overall pattern was similar to that of the most abundant clonotypes, which confirms biased use of TRBV20-1, TRBV4-1, TRBJ2-1, and TRBJ2-7.
Previous studies in CTCL have indicated overrepresentation of TRGV10-TRGJP1 in the malignant T cells.48 We confirmed this in our analysis, and we also found that TRGV2, TRGV8, and TRGV9 were frequently used across different TCLs, but TRGV1, TRGV5, TRGV11 were relatively underrepresented (Figure 6C-D).
Shared malignant clonotypes represent public clonotypes and have high recombination probability
The results described above indicated that certain V-J combinations are overrepresented. This suggests that the clonotypes (as defined by the amino acid sequence of the highly variable CDR3 region) may also be shared between patients with different TCLs. Indeed, as shown in supplemental Tables 4 and 5, we have found numerous shared TCRαaa and TCRβaa. Some clonotypes were shared across a large number of patients with different TCLs. For example, CARRKSSFF was detected in 100 samples (54 samples used TRBV28-TRAJ1-1) and CDNNNDMRF (TRAV16-TRAJ43) was present in 213 samples.
We estimated the fraction of the malignant clonotypes shared by 2 or more individuals using the Jaccard index (ranging from 0 [no overlap] to 1 [full overlap] of TCR repertoires). Both TCRαaa and TCRβaa had a high degree of sharing (Jaccard indices of 0.4 and 0.34, respectively), predictably showing higher sharing for TCRα.
Shared malignant clonotypes resembled public clonotypes found in the blood of healthy conrols. Public TCRs largely result from V-J recombination biases and convergent recombination in which rearrangement of different segments can result in the same amino acid sequence.49 Public TCR chains can pair with a diverse repertory of private TCR chains and therefore they are not determining antigen specificity.49 To determine whether the detected shared malignant clonotypes might represent the result of biased, convergent V-J recombination, we calculated the probability of CDR3 sequence generation (Pgen) value36,50 for the most abundant TCRβ and TCRα clonotypes. Pgen of those shared malignant clonotypes had 2 probability peaks at 10−9 and 10−6, respectively (Figure 7A; supplemental Tables 4-7). Shared TCRβRNA and TCRαRNA had even higher values with the maxima at 10−6 and 10−4, respectively (Figure 7B), which were significantly higher than the Pgen of peripheral blood private (unique) clonotypes (<10−9).
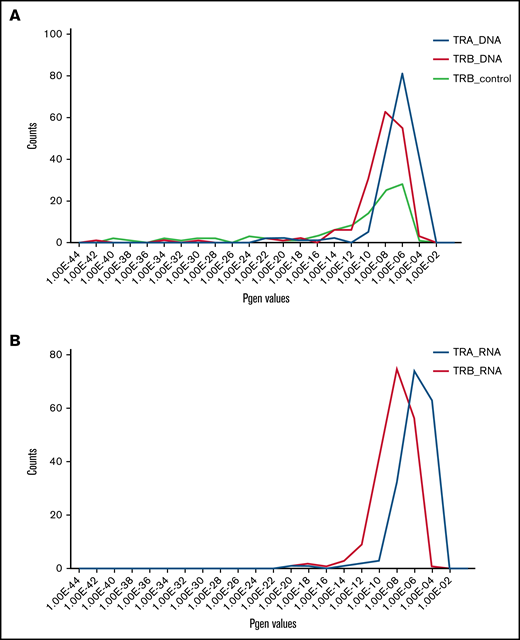
Pgen for TCRα and TCRβ clonotypes. Shared TCRαaa and TCRβaa clonotypes were identified using the Immunarch pipeline and their Pgen was calculated using the OLGA algorithm (Figure 1) from DNA and RNA data. (A) Pgen histogram for the shared TCRαDNA and TCRβDNA clonotypes. As a comparison, the Pgen values for the TCRβDNA clonotypes for the healthy control group are plotted. (B) Analogous histogram (as in panel A) showing Pgen for the shared clonotypes in TCRαRNA and TCRβRNA.
Pgen for TCRα and TCRβ clonotypes. Shared TCRαaa and TCRβaa clonotypes were identified using the Immunarch pipeline and their Pgen was calculated using the OLGA algorithm (Figure 1) from DNA and RNA data. (A) Pgen histogram for the shared TCRαDNA and TCRβDNA clonotypes. As a comparison, the Pgen values for the TCRβDNA clonotypes for the healthy control group are plotted. (B) Analogous histogram (as in panel A) showing Pgen for the shared clonotypes in TCRαRNA and TCRβRNA.
Discussion
TCLs represent a clinically diverse spectrum of T-cell cancers that vary from aggressive to relatively indolent and from nodal to organ specific (such as the skin). Nevertheless, analysis of TCR rearrangement patterns revealed striking similarities across different TCLs. Because TCR loci are rearranged sequentially and the rearrangement happens only during the thymic development of T-cell precursors, the rearrangement products retained in the genome allow us to trace the clonal history of TCL and illuminate the much-debated question of the cell of origin.
The current model of TCLs as neoplasms originating from various subpopulations of normal mature T cells3 is not only unsupported but is directly contradicted by our findings. Malignant transformation of a single lymphocyte randomly drawn from a vast pool of 106 to 107 singular T-cell clonotypes should yield lymphomas that are monoclonal (all malignant cells share the same clonotype), unique (low probability of shared clonotypes between tumors from unrelated patients), and unconnected (random frequency distribution of clonotypes). We show here that TCLs are mostly oligoclonal, have a high degree of interindividual clonotype sharing across different disease entities, and represent connected systems of clonotypes, the frequency of which follows the Zipf-Mandelbrot power law. We propose that considering the T-cell lymphatic precursor as a cell of origin allows not only for a more accurate interpretation of our findings but also accounts for previous observations that could not be explained by a mature T-cell model.
Clonotypic diversity arises if a transformed lymphoid precursor passes through different stages of TCR rearrangements resulting in a clonotypically heterogeneous pool of early cancer cells, mimicking the differentiation of normal T cells. The model schematically shown in Figure 4A assumes that precursor cells for mature TCLs progress through the sequential rearrangements analogous to those of normal thymocytes and in a stark contrast to those of immature TCLs and leukemias (eg, T-ALL), which become arrested at a given stage of development. Thus, transformation before TCRγ rearrangement would result in oligoclonality for all TCR rearrangements, whereas transformation after TCRγ rearrangement would render cancer cells monoclonal for TCRγ but oligoclonal for TCRβ and TCRα. Transformation after the TCRβ rearrangement stage would render the malignant cells monoclonal (single TCRβRNA clonotype and 1 to 2 TCRβDNA clonotypes) but oligoclonal for TCRα. Across different TCLs, ALCL showed a fingerprint for transformation at the earliest stage (before or at the TCRγ rearrangement), and ATCLL and PTCL seemed to derive from a cell in a later stage of development (TCRβ rearrangement or later). However, significant overlap in the patterns of clonality existed within each disease, indicating that the stage of the transformation does not fully define the phenotype of the disease. Because the available sequencing data did not have detailed clinical information, we cannot exclude that different subtypes within each diagnosis (eg, anaplastic lymphoma kinase [ALK+], ALK–, primary cutaneous ALCL, and breast implant–associated ALCL) differ with regard to the differentiation stage of the cell of origin as well.
The existence of more than 1 malignant clonotype has previously been shown in TCLs, but this finding has largely been ignored, and the clonotypes have been considered as artifacts caused by contamination of the sample with normal reactive T cells. We consider those explanations unlikely. First, in our analysis we include only the most abundant clonotypes of cumulative frequency equal to the proportion of tumor cells in the sample (TCFs). Second, across a large number of samples, we demonstrated the power-law relationship between the frequency and the rank of the clonotype. Power-law distribution characterizes complex, evolving, out-of-equilibrium, multiplicative systems composed of interconnected components, such as cities in a country, words in a language, repertoire of protein domains, or migrating human populations.43,45,51,52 It has been shown that growing malignant tumors demonstrate power-law distribution between tumor subclones.44 The distribution of clonotypes in TCLs followed power-law distribution as well, which is understandable only if TCLs are considered as evolving systems of interacting and expanding T-cell clones identified by their clonotypic signature.
We considered alternative explanations of our findings because it could be argued that clonotypic oligoclonality might also be a result of secondary TCR rearrangements in the already established tumor. However, this is unlikely because the TCR rearrangement machinery is irreversibly inactivated after completion of TCRα rearrangement, and the essential enzymes RAG1 and RAG2 are not expressed in TCLs.53 Moreover, additional supportive evidence for the lymphoid precursor model for TCLs comes from the pattern of V-J usage, which invalidates the argument of secondary mutations as the cause for multiple high-frequency malignant clonotypes. TCR rearrangements in human thymocytes are characterized by biased V and J segment usage, reflecting the probability of recombination (Pgen) that produces shared (public) clonotypes.54,55 A very similar situation is seen in TCLs. The V segments preferentially recombined in TCLs (TRBV20-1, TRBV4-1, TRBV5-1, TRAV14, TRAV35, or TRAV41) were also the most frequently used segments in normal human thymocytes, and the shared clonotypes had comparable high Pgen values (>10−7 for TCRα and >10−9 for TCRβ).54,55 Differences in combinatorial probability is a probable explanation for a higher Jaccard index (degree of clonotype sharing) for TCRα more than for TCRβ.
It has been postulated that V-J bias in some TCLs is a result of selection pressure from common antigens.56-60 For example, TRBV20-1 has the highest frequency across all TCLs and is known to be involved in response to Epstein-Barr virus or cytomegalovirus.46,61 However, none of the known CDR3 regions that recognize viral antigen was found among the malignant clonotypes. We postulate that the frequent finding of TRBV20-1 in TCLs is not a result of its antigenic selection but simply its ubiquity. TRBV20-1 is the prominent component of the TCRβ clonotypes of normal blood,62,63 tumor-infiltrating T cells,64,65 and autoimmune reactions.66-69 TRBV20-1 is the most frequently rearranged segment in double positive thymocytes55 and is frequently found in T-ALL, which develops directly from lymphoid precursors.15
Although our data strongly indicate the role of the lymphoid precursor as the cell of origin in TCLs, the origin of those cells and their pathways of development cannot be inferred from this study. Compelling experimental data suggest that the precursor T cell in the thymus might be the cell of origin for ALCL,13,14 but we cannot exclude the possibility that extrathymic sites are involved as well. T-cell maturation and TCR recombination may happen in extrathymic sites such as bone marrow, lymph nodes, or the tonsils.70-72 In a patient with lymphomatoid papulosis, we have found early precursor cells in the bone marrow before the clinical onset of the disease73 and cases of transmission of TCL by bone marrow transplant from asymptomatic donors who later developed the disease have been observed,74 which indicates that bone marrow could be a potential reservoir of progenitor malignant cells. Single-cell sequencing experiments in which TCRα can be paired with TCRβ in the context of the transcriptomic profile of the cells would probably allow further elucidation of the origin of lymphoma precursors.
In summary, we propose that mature TCLs do not originate from T cells in the periphery but rather from lymphoid precursors at different stages of their differentiation. Better understanding of the developmental trajectories of the early precursor into clinical lymphoid malignancy would improve diagnosing and staging of TCLs and help with designing targeted therapies that intervene with the disease at the initial stages.
Acknowledgments
The authors thank the National Institutes of Health Data Access Committee and the European Genome-Phenome Archive database for their help with getting access to certain restricted data sets.
This research was funded by unrestricted grants from the University of Alberta (Canada) and Bispebjerg Hospital (Copenhagen, Denmark), Danish Cancer Society (Kræftens Bekæmpelse; R124-A7592 Rp12350), Canadian Dermatology Foundation, and the University Hospital Foundation (University of Alberta).
A.I. received an Accelerated Postdoctoral Fellowship under a joint grant from Mitacs and Sun Pharma Global FZE (free zone limited liability establishment).
Authorship
Contribution: A.I. collected, analyzed, and assembled data, identified TCL studies, and wrote the manuscript; D.H. analyzed the data to identify TCFs and the TCR clonotypes; and R.G. supervised the research, advised on data analysis and assembly, and wrote the manuscript.
Conflict-of-interest disclosure: R.G. received speaker and advisory board honoraria from Mallinckrodt, Eli Lilly, Sanofi, AbbVie, Sun Pharma, and Kyowa Kirin outside this study. The remaining authors declare no competing financial interests.
Correspondence: Aishwarya Iyer, University of Alberta, 260 HMRC, 114th St and 85th Ave, Edmonton, AB T6G 2R3, Canada; e-mail: aiyer2@ualberta.ca.

