

Key Points
Machine-learning approaches identified a parsimonious gene-expression signature that predicts risk in newly diagnosed AML.
The 3-gene PI could be used to refine the accuracy of patient stratification and outcome prediction in routine clinical practice.

Abstract
Acute myeloid leukemia (AML) is a genetically heterogeneous hematological malignancy with variable responses to chemotherapy. Although recurring cytogenetic abnormalities and gene mutations are important predictors of outcome, 50% to 70% of AMLs harbor normal or risk-indeterminate karyotypes. Therefore, identifying more effective biomarkers predictive of treatment success and failure is essential for informing tailored therapeutic decisions. We applied an artificial neural network (ANN)–based machine learning approach to a publicly available data set for a discovery cohort of 593 adults with nonpromyelocytic AML. ANN analysis identified a parsimonious 3-gene expression signature comprising CALCRL, CD109, and LSP1, which was predictive of event-free survival (EFS) and overall survival (OS). We computed a prognostic index (PI) using normalized gene-expression levels and β-values from subsequently created Cox proportional hazards models, coupled with clinically established prognosticators. Our 3-gene PI separated the adult patients in each European LeukemiaNet cytogenetic risk category into subgroups with different survival probabilities and identified patients with very high–risk features, such as those with a high PI and either FLT3 internal tandem duplication or nonmutated nucleophosmin 1. The PI remained significantly associated with poor EFS and OS after adjusting for established prognosticators, and its ability to stratify survival was validated in 3 independent adult cohorts (n = 905 subjects) and 1 cohort of childhood AML (n = 145 subjects). Further in silico analyses established that AML was the only tumor type among 39 distinct malignancies for which the concomitant upregulation of CALCRL, CD109, and LSP1 predicted survival. Therefore, our ANN-derived 3-gene signature refines the accuracy of patient stratification and the potential to significantly improve outcome prediction.
Introduction
Acute myeloid leukemia (AML) is characterized by bone marrow (BM) and tissue infiltration by proliferative clonal abnormally differentiated cells of hematopoietic origin.1 Prognosis is largely determined by cytogenetic abnormalities and AML-specific molecular lesions.2 Although AML can be cured in 35% to 40% of adult patients aged <60 years with multiagent chemotherapy and often hematopoietic stem cell transplantation (HSCT), chemorefractory disease is common, and relapse represents a major cause of treatment failure.3 Investigation of new molecularly targeted agents for children and adults with high-risk AML remains a high priority.4,5
Genomic data are being translated into precision medicine-based therapeutic approaches for categorizing and treating patients with AML and are driving a deeper evaluation of new therapies targeting specific genetic lesions.6-8 Several studies have used unsupervised clustering algorithms to risk stratify patients with AML and to identify subgroups of AML with different prognoses.9-12 For example, a gene-expression profile associated with Wilms tumor-1 (WT1) expression has been shown to predict adverse prognosis.13 In this study, antigen presentation by MHC class II was identified as the most relevant biological pathway that was downregulated in the WT1high set of AMLs. A 66-gene prognostic score developed using an unbiased approach has been shown to correlate with event-free survival (EFS), relapse-free survival (RFS), and overall survival (OS) and to provide additional prognostic information after adjusting for molecular features, such as FLT3 internal tandem duplication (ITD) status and nucleophosmin 1 (NPM1) mutation status, in 2 independent cohorts of patients with cytogenetically normal (CN) AML.14 Finally, a 17-gene leukemia stem cell (LSC17) score predicted poor OS and EFS and was independent of known prognosticators, such as patient age, presenting white blood cell (WBC) count, cytogenetic risk group, type of AML (de novo vs secondary), and the presence of FLT3 ITD and NPM1 mutations.15
Machine learning–based data-mining strategies are increasingly being used for the in silico identification of diagnostic markers and molecular drivers of disease.16 These approaches encompass the nonlinearity and fluidity of biological systems, the interaction of molecular entities in pathways, and the need for consistency across multiple data sets. Herein, we used a well-established artificial neural network (ANN), a form of machine learning capable of accurately modeling biological systems,17 for the identification of predictive and prognostic biomarkers across multiple transcriptomic platforms and AML data sets. We then computed a 3-gene prognostic index (PI) that accurately stratified survival and could be used to generate predictions that are personally tailored to the individual patient and are beyond the current capabilities of single molecular markers.
Materials and methods
Data sources
The first data series (E-MTAB-3444), hereafter referred to as “discovery series,” was retrieved from Array Express and encompassed 3 independent cohorts of adults (≤60 years with de novo AML, consisting of 277, 256, and 129 cases; N = 662). Clinical and pathological characteristics for 641 cases were kindly provided by Peter J. M. Valk (Department of Hematology, Erasmus University Medical Centre, Rotterdam, The Netherlands). BM and blood samples were collected at diagnosis and were analyzed on an Affymetrix Human Genome U133 Plus 2.0 Array.9,18 Patients were treated with curative intent, according to Dutch-Belgian Hematology-Oncology Cooperative Group and the Swiss Group for Clinical Cancer Research (HOVON/SAKK) AML-04, AML-04A, AML-29, AML-32, AML-42, AML-42A, AML-43, or AML-92 protocol (available at http://www.hovon.nl; Tables 1-3).
AML patient series with biological and clinical characteristics
| Patient series | |||||
|---|---|---|---|---|---|
| HOVON | German | TCGA | TARGET | Beat AML | |
| Patients, n | 593 | 535 | 128 | 145 | 242 |
| Males/females, n | 306/287 | N.A. | 70/58 | 74/71 | 109/133 |
| Median follow-up, y | 8.34 | 8.61 | 3.25 | 6.78 | 1.27 |
| Age group, n | |||||
| 0-14 y | 0 | 0 | 0 | 114 | 10 |
| 15-39 y | 188 | 93 | 25 | 31 | 36 |
| 40-59 y | 327 | 185 | 41 | 0 | 64 |
| ≥60 y | 78 | 257 | 60 | 0 | 132 |
| N.A. | 0 | 0 | 2 | 0 | 0 |
| WHO category | |||||
| AML with minimal differentiation/without maturation | 161 | N.A. | 41 | N.A. | 6 |
| AML with t(8;21)(q22;q22) | 46 | N.A. | 7 | 21 | 9 |
| AML with inv(16)(p13;q22) | 49 | N.A. | 9 | 28 | 17 |
| AML with biallelic mutations of CEBPA | 28 | N.A. | N.A. | 7 | 17 |
| AML with mutated NPM1 | 183 | N.A. | N.A. | 5 | 64 |
| AML with t(9;11)(p22;q23) | 21 | N.A. | 7 | 36 | 8 |
| AML with inv(3)(q21q26)/t(3;3)(q21;q26) | 15 | N.A. | N.A. | 0 | 4 |
| Acute myelomonocytic leukemia | 112 | N.A. | 18 | N.A. | 13 |
| Acute monoblastic/monocytic leukemia | 139 | N.A. | 13 | N.A. | 11 |
| Pure erythroid leukemia | 9 | N.A. | N.A. | N.A. | 1 |
| AML with myelodysplasia-related changes | N.A. | N.A. | N.A. | N.A. | 45 |
| AML, not otherwise specified | N.A. | N.A. | N.A. | N.A. | 27 |
| Median presenting WBC count (range), ×109/L | N.A. | N.A. | 15 (1-224) | 45.3 (1.3-519) | 24.2 (0.5-427) |
| Median percentage of BM blasts (range) | 73 (0-98) | N.A. | 72 (30-100) | 73 (14-100) | 71 (1-98) |
| ELN cytogenetic risk group, n (%) | |||||
| Favorable | 201 (34) | N.A. | 18 (14) | 60 (41) | 73 (30) |
| Intermediate | 263 (44) | 223 | 76 (59) | 69 (48) | 80 (33) |
| Adverse | 126 (21) | N.A. | 32 (25) | 8 (5.5) | 89 (37) |
| N.A. | 3 (1) | 0 | 2 (2) | 8 (5.5) | 0 |
| HSCT, n | |||||
| Autologous | 95 | N.A. | 4 | N.A. | 0 |
| Allogeneic | 181 | N.A. | 55 | N.A. | 75 |
| WHO performance status, n | |||||
| 0 | 254 | N.A. | N.A. | N.A. | N.A. |
| 1 | 270 | ||||
| 2 | 53 | ||||
| 3 | 12 | ||||
| 4 | 0 | ||||
| N.A. | 4 | ||||
| Gene-expression platform | Affymetrix Human Genome U133 Plus 2.0 Array | Affymetrix Human Genome U133 Plus 2.0, U133A/B Array | RNA sequencing | RNA sequencing | RNA sequencing |
N.A., not available; TARGET, Therapeutically Applicable Research to Generate Effective Treatments; TCGA, The Cancer Genome Atlas; WHO, World Health Organization.
Predictive ability of the 3-gene PI in univariate and multivariate Cox regression analyses (AML discovery series)
| Variable | HR (95% CI) | P | β coefficient |
|---|---|---|---|
| Univariate Cox proportional hazard (OS) | |||
| t(8;21)(q22;q22) | 0.440 (0.277-0.699) | .001 | −0.821 |
| inv(16)(p13q22) | 0.417 (0.262-0.662) | .000 | −0.875 |
| KMT2A rearrangement (11q23) | 1.317 (0.912-1.900) | .142 | 0.275 |
| t(9;11)(p22;q23) | 0.963 (0.554-1.674) | .894 | −0.038 |
| inv(3)(q21q26)/t(3;3)(q21;q26) | 3.200 (1.899-5.392) | .000 | 1.163 |
| NPM1 mutation | 0.811 (0.650-1.012) | .063 | −0.210 |
| FLT3 ITD | 1.561 (1.264-1.930) | .000 | 0.446 |
| CEBPA biallelic mutations | 0.437 (0.246- 0.777) | .005 | −0.828 |
| Age | 1.017 (1.009-1.025) | .000 | 0.017 |
| Cytogenetic risk group (ELN) | 1.678 (1.481-1.902) | .000 | 0.518 |
| PI | 2.718 (2.205-3.351) | .000 | 1.000 |
| WHO performance status | 1.004 (0.936-1.077) | .903 | 0.004 |
| Multivariate Cox proportional hazard (OS) | |||
| t(8;21)(q22;q22) | 0.545 (0.262-1.131) | .103 | −0.607 |
| inv(16)(p13q22) | 0.334 (0.161-0.695) | .003 | −1.095 |
| KMT2A rearrangement (11q23) | 2.342 (1.171-4.680) | .016 | 0.851 |
| t(9;11)(p22;q23) | 0.695 (0.337-1.435) | .325 | −0.364 |
| inv(3)(q21q26)/t(3;3)(q21;q26) | 2.256 (1.138-4.471) | .020 | 0.813 |
| NPM1 mutation | 0.508 (0.282-0.912) | .023 | −0.678 |
| FLT3 ITD | 1.893 (1.078-3.324) | .026 | 0.638 |
| CEBPA biallelic mutations | 0.374 (0.177-0.790) | .010 | −0.984 |
| Age | 1.014 (1.006-1.023) | .000 | 0.014 |
| ELN cytogenetic risk group | 0.790 (0.467-1.335) | .379 | −0.236 |
| PI | 2.002 (1.542-2.601) | .000 | 0.694 |
| WHO performance status | 1.041 (0.969-1.119) | .270 | 0.041 |
The following categorical and continuous variables were evaluated in univariate Cox proportional hazard models for outcome: age, cytogenetic risk group (1 = favorable, 2 = intermediate, 3 = adverse), prognostic chromosomal abnormalities and molecular lesions, performance status, and PI. HRs > 1 or HRs < 1 indicate, respectively, higher or lower risk of event for higher values of continuous variables and for first category listed for categorical variables in OS models. Bold type denotes statistically significant P values.
CI, confidence interval; ELN, European LeukemiaNet; HR, hazard ratio.
Biological and clinical characteristics of patients with CN AML in the German AML series (GSE12417)
| CN-AML series | |
|---|---|
| Patients, n | 223 |
| Males/females, n | N.A. |
| Median follow-up, y | 8.84 |
| Age group, n | |
| 0-14 y | 0 |
| 15-39 y | 46 |
| 40-59 y | 79 |
| ≥60 y | 98 |
| Median presenting leukocyte count, ×109/L | N.A. |
| ELN cytogenetic risk group, n | |
| Favorable | 0 |
| Intermediate | 223 |
| Adverse | 0 |
| N.A. | 0 |
| PI group, n | |
| Low (≤1.0) | 63 |
| Intermediate (1.0 < PI < 1.5) | 92 |
| High (≥1.5) | 68 |
| Gene-expression platform | Affymetrix Human Genome U133 Plus 2.0, U133A/B Array |
The second data series, hereafter referred to as “the German series,” was retrieved from the National Center for Biotechnology Information Gene Expression Omnibus and consisted of adult patients with newly diagnosed AML (n = 562; GSE37642) who were enrolled and treated in the German AML Cooperative Group 1999 trial.14 Samples were characterized on an Affymetrix Human Genome U133 Plus 2.0 Array.
The third data series, hereafter referred to as “The Cancer Genome Atlas (TCGA) series,” consisted of RNA-sequencing data (Illumina HiSeq 2000) from 128 adults with nonpromyelocytic AML with complete cytogenetic, immunophenotypic, and clinical annotation who were enrolled in Cancer and Leukemia Group B treatment protocols 8525, 8923, 9621, 9720, 10201, and 19808. This series included patients with survival and immunophenotypic data.19 RNA and clinical data were retrieved from the TCGA data portal (https://tcga-data.nci.nih.gov/tcga/tcgadownload.jsp).
The fourth data series, hereafter referred to as the “Therapeutically Applicable Research to Generate Effective Treatments (TARGET) AML series,” consisted of RNA-sequencing data (Illumina HiSeq 2000) from 145 children, adolescents, and young adults with de novo AML enrolled into biology studies and clinical trials CCG-2961, AAML03P1, or AAML0531 managed through the Children’s Oncology Group.20,21 RNA expression, cytogenetic, and clinical data were retrieved from the Office of Cancer Genomics’ portal (https://ocg.cancer.gov/programs/target/data-matrix).
The fifth data series (Beat AML) was retrieved using the Vizome user interface (http://www.vizome.org/aml/) and consisted of RNA-sequencing data from primary specimens from 242 AML patients with detailed clinical annotations, including diagnostic information, treatments, responses, and outcomes.22
ANN analysis and derivation of a PI
To identify predictors of patient outcomes, our clinical-class question, we applied an ANN modeling–based data-mining approach, as previously described.16,23 Briefly, we used a supervised learning approach (for which patient outcomes were the predicted parameters) with multilayer perceptron architecture with a sigmoidal transfer function, in which weights are updated by a back-propagation algorithm.23 ANNs first assess the prognostic potential of each gene transcript individually in a univariate procedure, and then by adding additional genes in a sequential multivariate stepwise manner to improve upon the classification accuracy.23 In contrast to conventional statistical approaches, such as hierarchical clustering, principal component analysis, or linear regression, ANNs are not limited by linear functionality, thus providing an improved representation of biological features.16,17
For the discovery of gene probes associated with patient survival, transcriptomic array data (n = 54 675 probe IDs) were used as an input, and length of patient survival (<20 months [code 0] or >20 months [code 1]) was chosen as an output, based on the inflection point in the gradient of the Kaplan-Meier curve (supplemental Figure 1A-B). We then evaluated the ability of the top-10 ranked probes to predict survival in univariate analysis. The potential prognostic impact of each gene identified by the 10 probe IDs ranked by P values (supplemental Table 1) was initially verified using an on-line resource linking TCGA survival data to messenger RNA (mRNA) expression levels, which were dichotomized based on the median value (http://www.oncolnc.org/). Only genes that separated the patients into groups with statistically significant differences in survival probabilities (calcitonin receptor-like receptor [CALCRL], log-rank P =1.24 × 10⁻⁴; lymphocyte-specific protein 1 [LSP1], log-rank P = 4.99 × 10⁻⁵; and CD109, log-rank P = 1.86 × 10⁻²) were taken forward for all subsequent analyses. When combined, CALCRL, LSP1, and CD109 exerted the most significant effect on survival. We then generated a PI using β values from Cox regression analyses of CALCRL, LSP1, and CD109 gene expression (normalized to a score between 0 and 1) and patient survival according to a previously published formula16 :

Finally, we divided the PI values into 3 groups that provided the optimal (lowest) OS log-rank P value. PI scores < 1 were defined as low, PI scores between 1 and 1.5 were defined as intermediate, and PI scores > 1.5 were defined as high.
We used X-tile, a software package developed at Yale School of Medicine, for the identification of the optimal PI cut-point parsing the patient populations in the validation data sets into subgroups with statistically significant differences in survival probabilities across gene-expression platforms (https://medicine.yale.edu/lab/rimm/research/software.aspx).24
Real-time polymerase chain reaction and western blotting
The evaluation of mRNA and protein expression in leukemia cell lines and primary patient samples was carried out as detailed in supplemental Materials and methods. Patients provided written informed consent. The investigations were conducted in accordance with the Declaration of Helsinki and were approved by the Institutional Review Board of Studien-Allianz Leukämie (SAL; Germany).
Statistical analyses
Gene-expression values were normalized using the min-max approach. For genes with multiple probe sets (transcripts), the average expression value for a given gene was used in all analyses. The relationship of our 3-gene signature to standard prognostic variables was assessed in compliance with the Reporting Recommendations for Tumor Marker Prognostic Studies criteria.25,26 In particular, hazard ratios with CIs and survival probabilities were computed for all variables analyzed in the model. Kaplan-Meier plots were used to assess the effect of our signature genes on time-to-event outcomes. We also calculated the estimated effects with CIs from multivariate analyses in which the markers and standard prognostic variables were included, regardless of their statistical significance in univariate analyses. OS was computed from the date of diagnosis to the date of death. EFS was measured from the date of diagnosis to the date of failure to achieve complete remission (CR), relapse, or death. RFS was measured from the date of CR to the date of relapse or death. Subjects lost to follow-up were censored at their date of last known contact. The log-rank (Mantel-Cox) test was used to compare survival distributions. A 2-tailed P < .05 was considered to reflect statistically significant differences.
Binary logistic regression and multinomial logistic regression were used to ascertain the relative contribution of the 3-gene PI and other independent predictor variables selected a priori based on known clinical relevance, such as the European LeukemiaNet (ELN) risk group and patient age at diagnosis, toward the predicted likelihood of response to induction chemotherapy, AML relapse, and patient death (dependent variables). IBM SPSS Statistics (version 24) and GraphPad Prism (version 7) were used for statistical analyses.
Results
ANNs identify powerful predictors of survival in nonpromyelocytic AML
We initially applied our ANN approach to the identification of genes associated with prolonged patient survival in the HOVON discovery series (593 cases).9 CALCRL, LSP1, and CD109 showed the strongest association with our clinical-class question based on β-coefficients, and their expression levels (dichotomized as <median or >median) could individually stratify patients with longer and shorter OS (Figure 1A-D). The interindividual variation of gene-expression levels in the 5 independent cohorts assessed in our study is shown in Figure 1E, and the distribution of PI groups is summarized in Figure 2A. Transcript levels for CD109, a glycosylphosphatidylinositol-linked surface antigen expressed by CD34+ AML cell lines,27 were significantly and positively correlated with leukemic burden (R2 = 0.25; P < .0001). Adult patients in the PIhigh group predominantly had AML with minimal differentiation or without maturation (Figure 2B). The underlying genomic features of this patient subgroup are shown in supplemental Figure 1C.
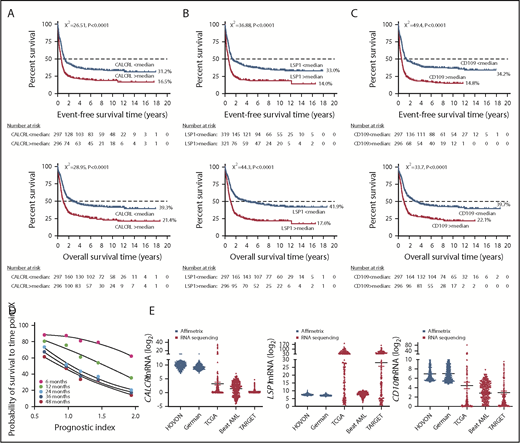
CALCRL, LSP1 and CD109 expression levels (median split) stratify survival in adult patients with AML (discovery series). (A-C) Kaplan-Meier estimates of EFS and OS. Survival curves were compared using a log-rank (Mantel-Cox) test. (D) Median PI values within each 0.5 PI value range plotted against probability of survival to time point X, with plot of best-fit by second-order polynomial function. (E) CALCRL, LSP1, and CD109 gene expression levels (raw data) in patients with AML.
CALCRL, LSP1 and CD109 expression levels (median split) stratify survival in adult patients with AML (discovery series). (A-C) Kaplan-Meier estimates of EFS and OS. Survival curves were compared using a log-rank (Mantel-Cox) test. (D) Median PI values within each 0.5 PI value range plotted against probability of survival to time point X, with plot of best-fit by second-order polynomial function. (E) CALCRL, LSP1, and CD109 gene expression levels (raw data) in patients with AML.
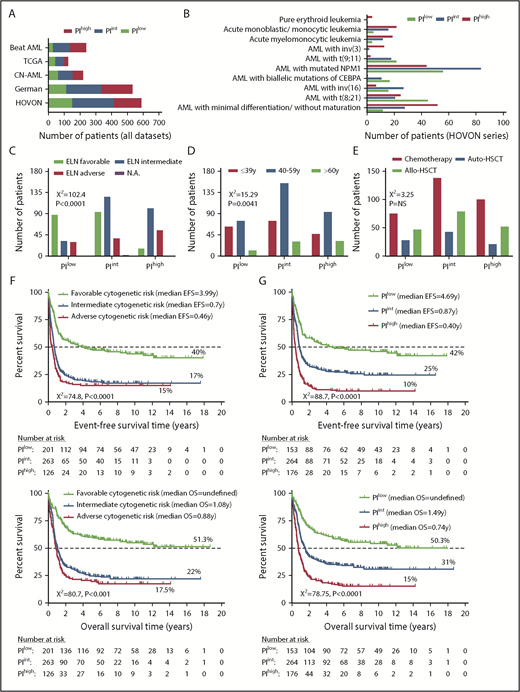
A 3-gene PI stratifies survival in adult patients with AML (discovery series). (A) Distribution of AML patients from 5 independent cohorts by PI group. (B) Distribution of AML patients with low, intermediate, and high PI by World Health Organization category.2 (C) Distribution of AML patients with low, intermediate, and high PI by ELN cytogenetic risk categories. Comparisons were performed using the χ2 test. (D) Distribution of AML patients with low, intermediate, and high PI by age groups. Comparisons were performed using the χ2 test. (E) Distribution of AML patients with low, intermediate, and high PI by treatment received. Comparisons were performed using the χ2 test. (F) Kaplan-Meier estimates of EFS and OS in AML patients stratified based on ELN cytogenetic risk. Survival curves were compared using a log-rank (Mantel-Cox) test. (G) Kaplan-Meier estimates of EFS and OS in AML patients stratified based on our 3-gene PI. NS, not significant.
A 3-gene PI stratifies survival in adult patients with AML (discovery series). (A) Distribution of AML patients from 5 independent cohorts by PI group. (B) Distribution of AML patients with low, intermediate, and high PI by World Health Organization category.2 (C) Distribution of AML patients with low, intermediate, and high PI by ELN cytogenetic risk categories. Comparisons were performed using the χ2 test. (D) Distribution of AML patients with low, intermediate, and high PI by age groups. Comparisons were performed using the χ2 test. (E) Distribution of AML patients with low, intermediate, and high PI by treatment received. Comparisons were performed using the χ2 test. (F) Kaplan-Meier estimates of EFS and OS in AML patients stratified based on ELN cytogenetic risk. Survival curves were compared using a log-rank (Mantel-Cox) test. (G) Kaplan-Meier estimates of EFS and OS in AML patients stratified based on our 3-gene PI. NS, not significant.
Prognostic interactions among the ANN 3-gene PI, common cytogenetic alterations, and clinical factors
A high PI was significantly associated with adverse cytogenetic features and with more advanced age at presentation (Figure 2C-D), but not with patient sex (supplemental Figure 1D) and whether patients received autologous or allogeneic HSCT (Figure 2E). As shown in Figure 2F, AML patients with adverse cytogenetic features had a shorter EFS and OS compared with patients with intermediate and favorable cytogenetic risk, thus confirming the overall trends of well-established ELN risk groups.28 Importantly, the 3-gene PI alone separated the patients into 3 distinct risk groups, with significant differences in EFS and OS (Figure 2G). In particular, the median OS of PIlow, PIint, and PIhigh patients was undefined, 1.49 years, and 0.74 years, respectively (P < .0001). Using the area under receiver operator characteristic (AUC) curve, we demonstrate that the 3-gene PI allows the prediction of death at prespecified time points with good accuracy (Figure 3A). When tested in a multinomial logistic regression model incorporating patient age and ELN cytogenetic risk, the 3-gene PI significantly and independently predicted whether patients experienced relapse and whether they responded to induction chemotherapy. In contrast, the 3-gene PI was unable to assist in the prediction of nonleukemic deaths (supplemental Table 2). Our 3-gene PI displayed similar prognostic power when tested against the LSC17 score derived from phenotypically defined leukemia stem cell populations (with LSC17: AUC, 0.72 vs 0.69), but it showed stronger prognostic power when tested against the 66-gene expression score derived from bulk mononuclear cells from BM or peripheral blood (with PI: AUC, 0.69 vs 0.61) (supplemental Figure 2).14,15
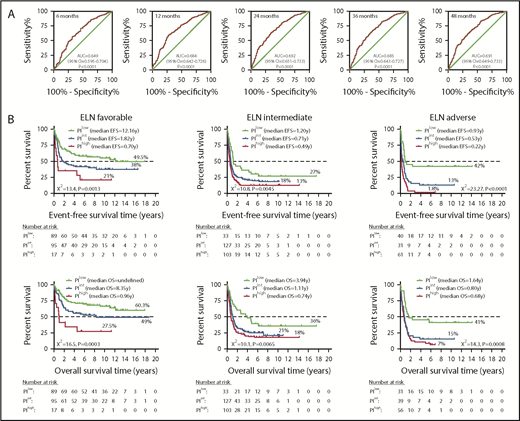
A 3-gene PI stratifies survival in adult AML patients with different ELN cytogenetic risk (discovery series). (A) AUC curves quantify the ability of our 3-gene PI to predict outcome in individual patients (specificity and sensitivity) within the first 48 months of treatment initiation. AUC = 1.0 would denote perfect prediction, and AUC = 0.5 would denote no predictive ability. (B) Kaplan-Meier estimates of EFS and OS in AML patient subgroups (discovery series) with specific ELN cytogenetic risk. Survival curves were compared using a log-rank (Mantel-Cox) test.
A 3-gene PI stratifies survival in adult AML patients with different ELN cytogenetic risk (discovery series). (A) AUC curves quantify the ability of our 3-gene PI to predict outcome in individual patients (specificity and sensitivity) within the first 48 months of treatment initiation. AUC = 1.0 would denote perfect prediction, and AUC = 0.5 would denote no predictive ability. (B) Kaplan-Meier estimates of EFS and OS in AML patient subgroups (discovery series) with specific ELN cytogenetic risk. Survival curves were compared using a log-rank (Mantel-Cox) test.
We next determined whether the 3-gene PI could further stratify patients classified into the ELN favorable, intermediate, or adverse-risk group. When the core-binding factor (CBF) AMLs were considered, 13 of 49 (27%) patients with inv(16) AML were classified as PIlow, with the remaining patients being PIint (n = 31) or PIhigh (n = 5). Furthermore, 42 of 46 (91%) patients with AML with RUNX1-RUNXT1 fusions from t(8;21) were classified as PIlow, whereas the remaining 4 patients were PIint. The altered risk imparted by the PI category could not be accounted for by FLT3 ITD status or by recurrent mutations in NRAS, KRAS, KIT, IDH1, IDH2, ASXL1, and DNMT3A (supplemental Figure 3). As shown in Figure 3B, a subset of patients belonging to the ELN favorable-risk stratum and classified as PIhigh (n = 17) showed a significantly shorter OS (>30-percentage point decrease) compared with the remaining ELN favorable-risk patients classified as PIint (n = 95) and PIlow (n = 89; P = .0003). Similarly, patients with ELN intermediate cytogenetic risk classified as PIlow (n = 33) had longer OS compared with the remaining ELN intermediate-risk patients belonging to the PIint (n = 127) and PIhigh groups (n = 103; P = .0065; Figure 3B). An intermediate or high PI also dichotomized survival in patients with ELN adverse cytogenetic risk. EFS and OS were particularly dismal in a subgroup of PIhigh patients (n = 56) within the adverse ELN stratum (2% and 7%, respectively; Figure 3B).
We then sought to investigate whether the 3-gene PI provides additional prognostic value to established molecular lesions. Among 29 patients with CEBPA double mutations, 17 patients were classified as PIlow (59%), whereas the remaining patients were PIint (n = 11) or PIhigh (n = 1). Again, FLT3 ITD status and recurrent mutations in NRAS, KRAS, KIT, IDH1, IDH2, ASXL1, and DNMT3A could not explain differences in risk associated with the 3 PI categories (supplemental Figure 4).
A high or intermediate PI identified a subgroup of NPM1-mutated FLT3 wild-type patients (otherwise classified as having low-risk disease29 ) with less favorable clinical outcomes compared with PIlowNPM1-mutated patients (20% and 31% EFS in PIhigh and PIint patients vs 49% EFS in PIlow patients [P = .0027] and 22% and 35% OS in PIhigh and PIint patients vs 62% in PIlow patients [P < .0001]; Figure 4A). Patients with wild-type NPM1 also had significantly different survival probabilities based on the PI category. Patients with FLT3 ITD and a high or an intermediate PI had significantly shorter EFS and OS compared with patients with a low PI (EFS: 9% and 21% vs 41%, respectively [P = .0002]; OS: 13% and 25% vs 47%, respectively [P = .001]; Figure 4B). Similarly, the PI stratified patients with wild-type FLT3 into subgroups with significantly different clinical outcomes. Finally, KMT2A rearrangement correlates with monocytic or myelomonocytic phenotypes and is an established adverse prognosticator in some studies.28,30 Although the number of patients with KMT2A rearrangements in the HOVON cohort was low (n = 46), those classified as PIint or PIhigh had a trend toward shorter EFS and OS (Figure 4C).
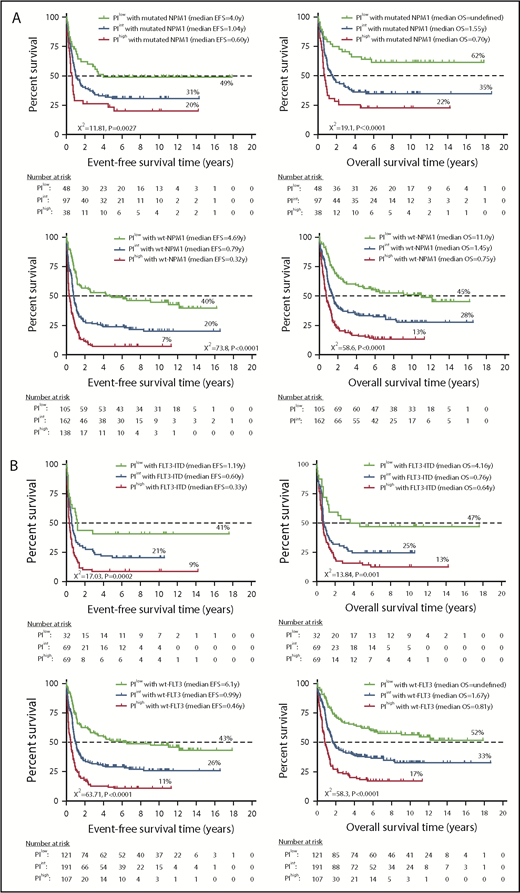
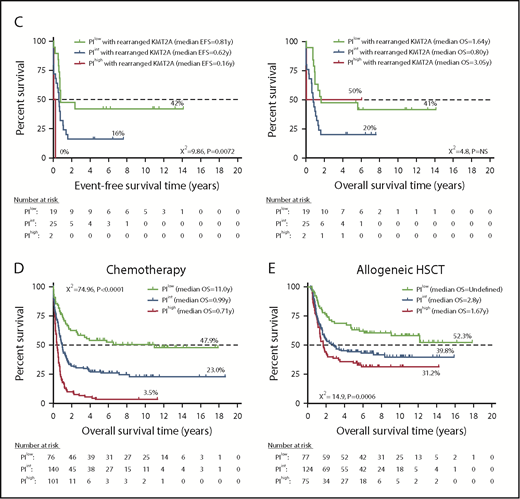
A 3-gene PI stratifies survival in adult AML patients (discovery series) with clinically established molecular lesions. (A-C) Kaplan-Meier estimates of EFS and OS. Kaplan-Meier estimates of OS in AML patients who received chemotherapy alone (D) or chemotherapy followed by allogeneic HSCT (E). Survival curves were compared using a log-rank (Mantel-Cox) test.
A 3-gene PI stratifies survival in adult AML patients (discovery series) with clinically established molecular lesions. (A-C) Kaplan-Meier estimates of EFS and OS. Kaplan-Meier estimates of OS in AML patients who received chemotherapy alone (D) or chemotherapy followed by allogeneic HSCT (E). Survival curves were compared using a log-rank (Mantel-Cox) test.
In a multivariable Cox regression model, the PI remained a powerful predictor of patient outcome after controlling for common clinical covariates, and it outperformed risk classification based upon advanced patient age, ELN risk group, and clinically validated molecular lesions. Importantly, a high PI was associated with shorter OS, irrespective of whether patients received chemotherapy alone (0.71 years vs 0.99 years and 11.0 years in PIint and PIlow patients, respectively; P < .0001; Figure 4D) or chemotherapy followed by HSCT (1.67 years vs 2.8 years and undefined in PIint and PIlow patients, respectively; P = .0006; Figure 4E). As shown in supplemental Figure 5, allogeneic HSCT had no significant impact on OS for PIlow patients but was associated with superior OS probability for PIint and PIhigh patients. Forest plots summarizing HRs and CIs from univariate and multivariate analyses are shown in Figure 5A. In multivariate logistic regression models that also considered cytogenetic risk and patient age at diagnosis (supplemental Table 3), the inclusion of the 3-gene PI significantly improved the predictive ability of the ELN category (AUC, 0.729 vs 0.679; model χ2 test = 102.22 vs 70.38; increased specificity = 8%; decreased false negative rate = 8%).

A 3-gene PI stratifies survival in AML patients (discovery and validation series). (A) Forest plot displaying hazard ratios and 95% CIs from univariate and multivariate analyses of PI, standard prognosticators, and molecular lesions predictive of survival (discovery series). (B-F) A 3-gene PI stratifies survival in adult nonpromyelocytic AML patients (German, TCGA, and Beat AML validation series; N = 905 in total) and in childhood AML (TARGET series; n = 145). We used X-tile for the identification of the optimal PI cut-point parsing the patient populations into subgroups with statistically significant differences in survival probabilities across gene-expression platforms (https://medicine.yale.edu/lab/rimm/research/software.aspx). For the German and TARGET series, PI scores <1.0 were defined as low, PI scores between 1.0 and 1.5 were defined as intermediate, and PI scores >1.5 were defined as high. For the TCGA and Best AML series, PI scores <1.4 were defined as low, PI scores between 1.4 and 2.0 were defined as intermediate, and PI scores >2.0 were defined as high. Kaplan-Meier estimates of OS in adults and children with AML from 5 independent validation series. Patients were stratified by low, intermediate, or high PI (German series, TCGA, and Beat AML series) or by median PI values (TARGET AML series). We used X-tile, a bioinformatics tool for outcome-based cut-point optimization, for the identification of the optimal PI values parsing the patient populations into subgroups with statistically significant differences in survival probabilities.24 Survival curves were compared using a log-rank (Mantel-Cox) test. (B) Kaplan-Meier estimates of OS in 535 adult patients (German series). (C) Kaplan-Meier estimates of OS in a subgroup of 223 adult patients with CN AML (German series). (D) Kaplan-Meier estimates of OS in 128 adult patients with nonpromyelocytic AML (TCGA series). (E) Kaplan-Meier estimates of OS in 242 adult patients with nonpromyelocytic AML (Beat AML series). (F) Kaplan-Meier estimates of OS in 96 children with non-CBF AML from TARGET.
A 3-gene PI stratifies survival in AML patients (discovery and validation series). (A) Forest plot displaying hazard ratios and 95% CIs from univariate and multivariate analyses of PI, standard prognosticators, and molecular lesions predictive of survival (discovery series). (B-F) A 3-gene PI stratifies survival in adult nonpromyelocytic AML patients (German, TCGA, and Beat AML validation series; N = 905 in total) and in childhood AML (TARGET series; n = 145). We used X-tile for the identification of the optimal PI cut-point parsing the patient populations into subgroups with statistically significant differences in survival probabilities across gene-expression platforms (https://medicine.yale.edu/lab/rimm/research/software.aspx). For the German and TARGET series, PI scores <1.0 were defined as low, PI scores between 1.0 and 1.5 were defined as intermediate, and PI scores >1.5 were defined as high. For the TCGA and Best AML series, PI scores <1.4 were defined as low, PI scores between 1.4 and 2.0 were defined as intermediate, and PI scores >2.0 were defined as high. Kaplan-Meier estimates of OS in adults and children with AML from 5 independent validation series. Patients were stratified by low, intermediate, or high PI (German series, TCGA, and Beat AML series) or by median PI values (TARGET AML series). We used X-tile, a bioinformatics tool for outcome-based cut-point optimization, for the identification of the optimal PI values parsing the patient populations into subgroups with statistically significant differences in survival probabilities.24 Survival curves were compared using a log-rank (Mantel-Cox) test. (B) Kaplan-Meier estimates of OS in 535 adult patients (German series). (C) Kaplan-Meier estimates of OS in a subgroup of 223 adult patients with CN AML (German series). (D) Kaplan-Meier estimates of OS in 128 adult patients with nonpromyelocytic AML (TCGA series). (E) Kaplan-Meier estimates of OS in 242 adult patients with nonpromyelocytic AML (Beat AML series). (F) Kaplan-Meier estimates of OS in 96 children with non-CBF AML from TARGET.
The ANN 3-gene PI provides prognostic power in independent validation sets
The clinical validity of the 3-gene PI was confirmed across 3 independent adult AML data sets (N = 905 cases in total). Figure 5B-E show that the 3-gene PI stratified survival in AML patients in TCGA and in the German series. A detailed analysis of TCGA data allowed us to detect a correlation among the expression of our signature genes, ELN cytogenetic risk, and molecular lesions (supplemental Figure 6A-B), and it showed significantly shorter survival in PIhigh cases compared with the intermediate- and low-PI categories (Figure 5D). The German series (N = 535 cases in total; Table 1) also included adults with CN AML (n = 223; Table 3); namely, the largest subset of AML patients falling into the intermediate cytogenetic risk group. Current molecular classifications do not fully capture the heterogeneity in outcome of these patients. As shown in Figure 5C, the PI separated patients with CN AML into subgroups with different survival probabilities.
Finally, we calculated PI scores for 242 adults with AML from Beat AML (Table 1; RNA sequencing data are available at http://www.vizome.org).22 As shown in Figure 5E, the 3-gene PI also stratified survival in this cohort of adult AML patients. In multivariate logistic regression models that also considered cytogenetic risk and WBC count at diagnosis, inclusion of the 3-gene PI improved the predictive ability (AUC, 0.650 vs 0.597; increased specificity = 19%; decreased false negative rate = 9.3%; supplemental Table 4). Interestingly, the 3-gene PI, but not the ELN risk category, predicted treatment response (Wald χ2 test for PI = 16.37, P = .000; AUC = 0.707, sensitivity = 91%, specificity = 31%, false positive rate = 28%, false negative rate = 37%; Wald χ2 test for ELN risk category = 0.154, P = not significant). However, the 3-gene PI was unable to stratify survival in the small subgroup of patients with CBF AML (n = 26) (supplemental Figure 6C).
A recent comprehensive molecular characterization of pediatric AML has provided evidence for age-specific molecular landscapes, including differences in mutational and structural alterations.20 The majority of patients in the TARGET AML cohort (128 of 145) were classified as PIlow, and differences in survival did not attain statistical significance (median OS = undefined, 2.99 years, and 2.29 years in PIlow, PIint, and PIhigh cases, respectively; χ2 test =1.39, P = not significant), implying that the PI categories established with adult AML cases from the HOVON series may be unable to assist in the risk stratification of childhood AML. In light of the recently reported lack of prognostic power for the LSC17 score in childhood CBF AML,31 we excluded CBF cases (n = 49; 34% of the TARGET-AML cohort) from our analysis. After dichotomizing the 3-gene PI into above-median and below-median scores, we found that high PI scores significantly predicted shorter OS (Figure 5F). The estimate of OS in pediatric CBF cases (n = 49) split by median PI scores is shown in supplemental Figure 6D.
We also aimed to assess the impact of CALCRL, LSP1, and CD109 expression on AML outcomes using PRECOG (PREdiction of Clinical Outcomes from Genomic profiles; http://precog.stanford.edu), a publicly available curated and integrated meta-analysis of expression signatures from ∼26 000 human tumors. This online resource includes OS outcomes, encompassing 166 cancer-expression data sets across 39 distinct malignancies, including AML (N = 1261 cases overall; 255 patients from TCGA,19 182 patients from GSE10358,32 178 patients from ca00119,12 248 patients from GSE12417,14 163 patients from GSE8043,33 137 patients from GSE1427, and 98 patients from GSE1446834 ). Gene-expression levels were dichotomized based on medians. In 5 of 8 AML series analyzed, patients with high expression of CALCRL, LSP1, and CD109, individually or in combination, experienced shorter OS (supplemental Table 5). However, CALCRL, LSP1, and CD109 mRNA levels were not predictive of clinical outcomes in the GSE1427 series, in which purified CD133+ populations were used for gene-expression profiling.
To assess the applicability of our 3-gene PI to a “real-life” clinical setting, we used reverse-transcription–polymerase chain reaction to measure CALCRL, LSP1, and CD109 mRNA expression in a panel of commercially available AML cell lines (Figure 6A) and in BM samples from 38 adult patients with AML (SAL series; Figure 6B; supplemental Table 6). As shown in Figure 6C, LSP1 and CD109 were also expressed at the protein level in primary blasts. In contrast, CALCRL protein expression was mostly low to undetectable. We then computed a PI that, given the small sample size, was dichotomized into above-median and below-median scores before being correlated with clinical features. Median age at diagnosis, WBC count at presentation, percentage of BM blasts, and ELN cytogenetic risk categories were not significantly different in PIlow and PIhigh patients (data not shown). A cutoff of 10% BM blasts on day 16 (ie, 1 week after the end of induction chemotherapy) was identified as a major predictor of response and long-term outcomes in the German AML Cooperative Group 1992 trial.35 Interestingly, patients with early blast clearance (<10% blasts on day 16) were significantly more likely to belong to the PIlow subgroup compared with patients with ≥10% blasts (χ2 test = 7.26; P = .0071; Figure 6D), suggesting that a PCR-based 3-gene PI could be broadly applicable as a biomarker of therapeutic response. Finally, matched BM samples (diagnosis–relapse) were available in a subgroup of 9 SAL patients. Figure 6E shows that CALCRL, LSP1, and CD109 mRNA levels were significantly higher at the time of relapse compared with disease onset.

A reverse transcription polymerase chain reaction (RT-PCR)–based 3-gene PI is a biomarker of therapeutic response in AML (SAL series). (A) Detection of CALCRL, LSP1, and CD109 mRNA by quantitative RT-PCR in leukemia cell lines. Bars denote mean ± standard error of the mean (duplicate measurements). (B) Detection of CALCRL, LSP1, and CD109 mRNA by RT-PCR in BM samples from the SAL series (38 adults with newly diagnosed AML; clinical characteristics in supplemental Table 6). The PI was calculated as detailed in “Materials and methods.” (C) Detection of CALCRL, LSP1, and CD109 protein by western blotting (supplemental Materials and methods) in 23 BM samples from the SAL series. (D) Correlation between PI category (median split) and response to induction chemotherapy in the SAL series. Early blast clearance, a major independent predictor of therapy response and long-term outcomes, was defined as having <10% leukemia blasts on day 16 (1 week after the end of the first cycle of induction chemotherapy), as previously described.35 (E) CALCRL, LSP1, and CD109 mRNA levels (duplicate measurements) in matched BM samples from 9 patients in the SAL series who later developed leukemia relapse. The analysis of variance test for paired determinations was used for statistical comparisons between gene expression at diagnosis and time of relapse.
A reverse transcription polymerase chain reaction (RT-PCR)–based 3-gene PI is a biomarker of therapeutic response in AML (SAL series). (A) Detection of CALCRL, LSP1, and CD109 mRNA by quantitative RT-PCR in leukemia cell lines. Bars denote mean ± standard error of the mean (duplicate measurements). (B) Detection of CALCRL, LSP1, and CD109 mRNA by RT-PCR in BM samples from the SAL series (38 adults with newly diagnosed AML; clinical characteristics in supplemental Table 6). The PI was calculated as detailed in “Materials and methods.” (C) Detection of CALCRL, LSP1, and CD109 protein by western blotting (supplemental Materials and methods) in 23 BM samples from the SAL series. (D) Correlation between PI category (median split) and response to induction chemotherapy in the SAL series. Early blast clearance, a major independent predictor of therapy response and long-term outcomes, was defined as having <10% leukemia blasts on day 16 (1 week after the end of the first cycle of induction chemotherapy), as previously described.35 (E) CALCRL, LSP1, and CD109 mRNA levels (duplicate measurements) in matched BM samples from 9 patients in the SAL series who later developed leukemia relapse. The analysis of variance test for paired determinations was used for statistical comparisons between gene expression at diagnosis and time of relapse.
Prognostic significance of CALCRL, LSP1, and CD109 expression across different cancer types
PRECOG allows the evaluation of commonalities in prognostic genes across a large number of human malignancies.36 The associations between gene-expression levels and outcome are assessed by z-scores, which represent the number of standard deviations from the mean of a normal distribution and are directly related to P values, encoding the directionality and robustness of statistical associations.36 Figure 7A summarizes survival z-scores by cancer subtype and shows that AML was the only tumor type among 39 distinct malignancies in PRECOG in which CALCRL, LSP1, and CD109 expression (z-scores = 7.10, 3.53, and 6.35, respectively) was concordantly upregulated and predicted shorter OS. This observation suggests that CALCRL, LSP1, and CD109 expression captures AML-specific nonredundant functional elements or biological programs that might underpin leukemia development and/or progression, ultimately impacting on patient survival.
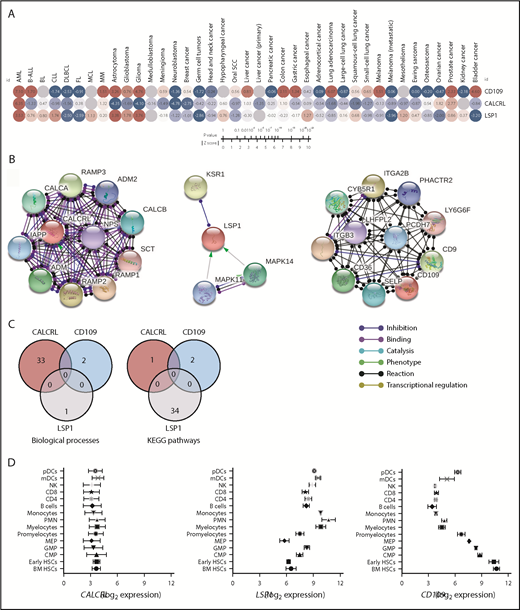
In silico validation of the prognostic implication of CALCRL, LSP1, and CD109 expression in patients with a variety of hematopoietic and solid tumors. (A) Survival z-scores by cancer subtype were retrieved from PRECOG (http://precog.stanford.edu).36 Heat maps of z-scores were built using Morpheus (Broad Institute, Cambridge, MA). Red nodes denote a correlation between high gene expression and shorter OS, whereas blue nodes indicate a correlation between high gene expression and longer OS. (B) Analysis of functional protein association networks using STRING (https://string-db.org/). Top 10 molecules interacting with CALCRL, LSP1, and CD109 are shown together with their predicted mode of action (highest confidence interaction scores >0.900). Network nodes (query proteins) represent proteins produced by a single protein-coding gene locus. White nodes represent second shells of interactors. Empty and filled nodes indicate proteins of unknown or partially known 3-dimensional structure, respectively. Edges represent protein–protein associations. Line shapes denote predicted modes of action. (C) Venn diagrams showing biological processes and Kyoto Encyclopedia of Genes and Genomes (KEGG) pathways related to CALCRL, LSP1, and CD109 expression. (D) Expression of transcripts for CALCRL, LSP1, and CD109 in normal hematopoietic tissues was assessed using a public database of mRNA expression profiles (http://servers.binf.ku.dk/bloodspot/). Mean and standard deviation of gene expression (batch-corrected data) in each HSC subset were plotted. B-ALL, B-cell acute lymphoblastic leukemia; BL, Burkitt lymphoma; CLL, chronic lymphocytic leukemia; CMP, common myeloid progenitor; DLBCL, diffuse large B-cell lymphoma; FL, follicular lymphoma; GMP, granulocyte-macrophage progenitor; MCL, mantle cell lymphoma; mDCs, myeloid dendritic cells; MEP, megakaryocyte-erythroid progenitor; MM, multiple myeloma; NK, natural killer; pDCs, plasmacytoid dendritic cells; PMN, polymorphonuclear; SCC, squamous cell carcinoma.
In silico validation of the prognostic implication of CALCRL, LSP1, and CD109 expression in patients with a variety of hematopoietic and solid tumors. (A) Survival z-scores by cancer subtype were retrieved from PRECOG (http://precog.stanford.edu).36 Heat maps of z-scores were built using Morpheus (Broad Institute, Cambridge, MA). Red nodes denote a correlation between high gene expression and shorter OS, whereas blue nodes indicate a correlation between high gene expression and longer OS. (B) Analysis of functional protein association networks using STRING (https://string-db.org/). Top 10 molecules interacting with CALCRL, LSP1, and CD109 are shown together with their predicted mode of action (highest confidence interaction scores >0.900). Network nodes (query proteins) represent proteins produced by a single protein-coding gene locus. White nodes represent second shells of interactors. Empty and filled nodes indicate proteins of unknown or partially known 3-dimensional structure, respectively. Edges represent protein–protein associations. Line shapes denote predicted modes of action. (C) Venn diagrams showing biological processes and Kyoto Encyclopedia of Genes and Genomes (KEGG) pathways related to CALCRL, LSP1, and CD109 expression. (D) Expression of transcripts for CALCRL, LSP1, and CD109 in normal hematopoietic tissues was assessed using a public database of mRNA expression profiles (http://servers.binf.ku.dk/bloodspot/). Mean and standard deviation of gene expression (batch-corrected data) in each HSC subset were plotted. B-ALL, B-cell acute lymphoblastic leukemia; BL, Burkitt lymphoma; CLL, chronic lymphocytic leukemia; CMP, common myeloid progenitor; DLBCL, diffuse large B-cell lymphoma; FL, follicular lymphoma; GMP, granulocyte-macrophage progenitor; MCL, mantle cell lymphoma; mDCs, myeloid dendritic cells; MEP, megakaryocyte-erythroid progenitor; MM, multiple myeloma; NK, natural killer; pDCs, plasmacytoid dendritic cells; PMN, polymorphonuclear; SCC, squamous cell carcinoma.
Interaction networks of PI genes and their expression in healthy tissues
The Search Tool for the Retrieval of Interacting Genes/Proteins (STRING) database (http://string-db.org) provides a critical assessment and integration of protein–protein interactions, including direct (physical) and indirect (functional) associations.37 We used STRING to interrogate the interaction networks of CALCRL, LSP1, and CD109. A detailed list of significantly enriched gene ontology processes and Kyoto Encyclopedia of Genes and Genomes pathways is provided as supplemental Tables 7 and 8. Figure 7B shows protein network analysis and predicted functional partners of CALCRL, LSP1, and CD109 with highest-confidence interaction scores (>0.900). Molecules known to be involved in adrenomedullin signaling, such as receptor activity modifying proteins 1-3, and adrenomedullin-2, a calcitonin gene-related peptide, featured prominently in the functional enrichment network for CALCRL. The interaction network for LSP1 primarily included molecules implicated in MAPK signaling. CD109 interacted with cell surface integrin complexes, such as CD36 (thrombospondin receptor), integrin β-3 precursor (ITGB3), and integrin subunit α-2b (ITGA2B, CD41), which mediate platelet degranulation and release of bioactive mediators.38 The lack of interactions and functional associations among genes within this signature, as illustrated in the Venn diagrams in Figure 7C, suggests that these proteins are likely to contribute to a different biological purpose in AML.
We then assessed CALCRL, LSP1, and CD109 expression at the mRNA level in normal hematopoiesis using BloodSpot.39 As shown in Figure 7D, CALCRL was uniformly expressed at various stages of hematopoietic differentiation and in immune cells. LSP1 was broadly and more highly expressed in cells of the adaptive and innate immune system, including neutrophils and dendritic cells, and was detected at lower levels in early hematopoietic stem cells (HSCs). In contrast, CD109 was highly expressed in BM-derived early HSCs, progressively declined in progenitor cells differentiating along the granulocytic and monocytic lineages, and then retained intermediate expression in myeloid and plasmacytoid dendritic cells.
CALCRL, LSP1, and CD109 are cell surface antigens and, thus, could serve as potential molecular therapeutic targets for patients with AML.40 Supplemental Figure 7 summarizes the expression of mRNA transcripts for CALCRL, LSP1, and CD109 in healthy tissues. CALCRL showed a more restricted expression pattern but higher expression levels in lung, endothelial cells, and adipose tissues. LSP1 was highly and almost exclusively expressed in blood-derived cells and in the spleen. Finally, CD109 was expressed at very low levels in a variety of healthy tissues, including lung, skin, gastrointestinal mucosa, and adipose tissue.
Discussion
Current prognosticators, such as the simplified 2017 ELN genetic risk stratification adopted in our study and in that of other investigators,41 classify patients with AML as being at low, intermediate, or high risk for shorter remission duration or life expectancy.28 A reanalysis of genetic data from 1540 patients with AML has convincingly shown that one third of the patients may have survival predictions that deviate >20% from their ELN risk category.42 Thus, considerable efforts are underway to garner further insights into the mutational landscape of such a diverse constellation of patients, with the aim to refine the accuracy of stratification algorithms and to integrate genomics findings into transformative therapeutic approaches, especially for patients with high-risk disease.4
By interrogating public transcriptomic data from large independent cohorts of adult and pediatric AML patients (N = 1643 in total), we developed a powerful 3-gene predictor of clinical outcomes. CALCRL is a receptor for adrenomedullin, which stimulates cell growth and inhibits apoptosis in a variety of solid tumors, including prostate43 and breast cancer.44 LSP1 encodes an intracellular F-actin binding protein expressed in lymphocytes, neutrophils, macrophages, and endothelial cells and has not been previously reported in prognostic signatures for AML.13,15,41,45 The third gene in our PI, CD109, encodes a cell surface antigen protein that is a negative regulator of TGF-β and STAT3 signaling and has previously been identified in AML gene signatures with prognostic relevance,13,14 including in patients with CN AML and RUNX1 mutations.46 CD109 is also under evaluation as a potential target for antibody-based therapeutics.40,47 Our findings in the HOVON cohort were further validated in silico using data from 1261 AML cases available through PRECOG, which also allowed us to identify AML as the only tumor type among 39 distinct malignancies showing concordant upregulation of CALCRL, LSP1, and CD109 expression. When combined, CALCRL, LSP1, and CD109 predicted survival in AML, but not in other hematological and solid tumors. It is tempting to speculate that our signature genes might reflect the activation of AML-specific biological programs with a strong impact on patient outcome.
Patients classified as PIhigh in the discovery series, as well as in the TCGA cases with ELN risk-classification information, had a greater probability of harboring adverse-risk ELN cytogenetic features. The 3-gene ANN PI separated the patients in each ELN stratum into subgroups with different survival probabilities. Importantly, a recent analysis of 934 patients with de novo AML showed that the LSC17 score does not stratify survival in younger adults (<60 years) with intermediate ELN risk, but it retains prognostic impact within the favorable and adverse ELN categories.48 Furthermore, the LSC17 score is unable to assist in the prediction of survival in older patients (>60 years) with intermediate- and adverse-risk cytogenetic features.48 Our 3-gene PI remained significantly associated with poor EFS and OS in multivariate Cox regression models after adjusting for common clinical factors. These findings strongly suggest that our signature genes were not merely a surrogate marker for cytogenetic/molecular abnormalities with established prognostic relevance, but rather were capturing biological pathways and/or currently unknown genetic alterations associated with poor survival in AML.
As shown by our analysis of the German CN AML series, the PI could also have supported a more accurate prognostic stratification and the allocation of optimal treatment in CN AML patients who may or may not benefit from more intensive approaches. We also observed that the PI had a differential predictive value in the 2 CBF AMLs, constituting subgroups with favorable prognosis, with 91% of cases with t(8;21), but only 32% of cases with inv(16), being classified as PIlow. Previous studies identified subclasses of CBF AML with different gene-expression programs and survival probabilities.10 Extensive mutational profiling by high-throughput sequencing of 215 patients with CBF AML also suggests that diverse cooperating mutations may underpin the different pathophysiology and clinical behavior of t(8;21) vs inv(16).49 Importantly, the LSC17 signature, which was initially developed in non-CBF AML,15 failed to distinguish outcome between patients with low and intermediate scores in the ELAM02 and TARGET cohorts of childhood AML, which included 28% and 34% CBF cases, respectively.31 In contrast, our 3-gene PI also captured the inherent heterogeneity of CBF-AML, in children and in adults; therefore, it could improve the identification of subgroups of patients within these cytogenetically defined AMLs who differ with respect to clinical outcome. Importantly, the PI stratified survival in specific subgroups of patients with prognostic molecular abnormalities, such as FLT3 ITD, NPM1 mutations, and KMT2A rearrangements, and it identified individuals with particularly poor prognoses, such as those with nonmutated NPM1 or FLT3 ITD combined with a high PI. In contrast with the above findings in adult patients, survival in children with AML in the TARGET dataset was not stratified by our 3-gene PI when the CBF cases were included in the analysis, further reinforcing the knowledge that AML is a disease with age-dependent biological peculiarities, including differences in mutated genes, structural variants, and DNA methylation patterns.20,21 Finally, our study also showed that predictions of leukemia relapse and survival are less encouraging in patients with low ELN cytogenetic risk and a high PI, approaching estimates usually observed in patients with intermediate ELN cytogenetic risk. Therefore, the former patients, who would not be assigned to allogeneic HSCT in first CR a priori under current clinical recommendations,28 could be reclassified into the intermediate-risk group and offered more aggressive induction/consolidation strategies, including allogeneic HSCT when the expected incidence of relapse is >35% to 40%50 or participation in early-phase clinical trials with novel investigational drugs, if unfit to receive intensive chemotherapy. In contrast, patients with intermediate cytogenetic risk and a low PI had a better prognosis compared with patients with intermediate cytogenetic features and an intermediate/high PI. Importantly, a high PI predicted shorter OS, irrespective of whether patients received chemotherapy alone or chemotherapy followed by HSCT. Furthermore, allogeneic HSCT did not affect OS probabilities for PIlow patients, but it was associated with better OS for PIint and PIhigh patients.
Prospective studies should determine whether the PI model to predict outcome that we developed and validated herein will be useful in clinical practice for allocating AML patients to risk-adapted induction chemotherapy or postremission treatments,51 as well as generate predictions that are personally tailored to the individual patient that are beyond the current capabilities of single molecular markers.
The full-text version of this article contains a data supplement.
Acknowledgments
This work was supported by grants from the Qatar National Research Fund (NPRP8-2297-3-494) (S.R.), the Roger Counter Foundation (A.G.P. and S.R.), and the John and Lucille van Geest Foundation (A.G.P., G.R.B., and S.R.).
Authorship
Contribution: S.W., G.R.B., and S.R. conceived and designed the study and developed the methodology; S.W., J.V., H.A., G.R.B., and S.R. acquired data; S.W., J.V., H.A., S.K.T., M.B., A.G.P., G.R.B., and S.R. analyzed and interpreted data; S.R. supervised the study and wrote the manuscript; and S.W., J.V., S.K.T., M.B., A.G.P., G.R.B., and S.R. reviewed and/or revised the manuscript.
Conflict-of-interest disclosure: The authors declare no competing financial interests.
Correspondence: Sergio Rutella, John van Geest Cancer Research Centre, College of Science and Technology, Clifton campus, Nottingham Trent University, Nottingham NG11 8NS, United Kingdom; e-mail: sergio.rutella@ntu.ac.uk.

