

Key Points
B-cell–specific human Par-4 overexpression inhibits nuclear translocation of p65 to decelerate leukemogenesis in murine B-cell leukemia.
A novel Par-4–overexpression model for describing the role of Par-4 in the development of B-cell malignancies and response to therapy.

Abstract
Prostate apoptosis response 4 (Par-4) is a tumor suppressor that prevents proliferation and induces cell death in several solid tumors. However, its role in B-cell malignancies has not been elucidated. To describe the role of Par-4 in chronic lymphocytic leukemia (CLL) pathogenesis, we developed a B-cell–specific human Par-4–overexpressing mouse model of CLL using the TCL1 leukemia model. While Par-4 transgenic mice did not display any obvious defects in B-cell development or function, disease burden as evidenced by abundance of CD19+CD5+ B cells in the peripheral blood was significantly reduced in Par-4 × TCL1 mice compared with TCL1 littermates. This conferred a survival advantage on the Par-4–overexpressing mice. In addition, a B-cell–specific knockout model displayed the opposite effect, where lack of Par-4 expression resulted in accelerated disease progression and abbreviated survival in the TCL1 model. Histological and flow cytometry–based analysis of spleen and bone marrow upon euthanasia revealed comparable levels of malignant B-cell infiltration in Par-4 × TCL1 and TCL1 individuals, indicating delayed but pathologically normal disease progression in Par-4 × TCL1 mice. In vivo analysis of splenic B-cell proliferation by 5-ethynyl-2-deoxyuridine incorporation indicated >50% decreased expansion of CD19+CD5+ cells in Par-4 × TCL1 mice compared with TCL1 littermates. Moreover, reduced nuclear p65 levels were observed in Par-4 × TCL1 splenic B cells compared with TCL1, suggesting suppressed NF-κB signaling. These findings have identified an in vivo antileukemic role for Par-4 through an NF-κB–dependent mechanism in TCL1-mediated CLL-like disease progression.
Introduction
Prostate apoptosis response 4 (Par-4) is a ubiquitously expressed, proapoptotic tumor suppressor protein expressed from the PRKC, apoptosis, WT1, regulator (PAWR) gene. It is downregulated in a variety of cancers by promoter methylation, indicating a survival advantage conferred by resistance to Par-4–mediated apoptosis and cytostatic effects.1-5 Par-4 overexpression has been shown to sensitize multiple cancer cell lines to apoptosis induced by endogenous tumor surveillance ligands, such as TNF-related apoptosis inducing ligand, and chemotherapeutics.3-7 Par-4 knockout (Pawr−/−) mice display a tumor-prone phenotype that results in neoplastic transformation of multiple tissues.8 Despite its extensive study in solid tumors, the role of Par-4 in hematological malignancies has been minimally described. Interestingly, Par-4 protein is overexpressed in chronic lymphocytic leukemia (CLL) B cells relative to healthy donor cells and has been found to increase in abundance with disease progression.9,10
CLL is the most prevalent adult leukemia in the Western world, representing roughly one-third of all new leukemia cases in the United States.11 It is characterized by B-cell lymphocytosis with mature B-cell markers and coexpression of CD5 in the blood, bone marrow, and secondary lymphoid organs.12 Accumulation of CLL cells is attributed to constitutive survival signaling downstream of the B-cell receptor (BCR) pathway leading to activation of NF-κB transcription factors.13-15 However, higher Par-4 levels in apoptosis-resistant CLL cells remain perplexing given that Par-4 plays a suppressive role in the protein kinase C (PKC)–NF-κB axis.16,17 Presumably, chronic BCR signaling resulting in activation of the phosphoinosital-3-kinase pathway, and activation of NF-κB through BAFF and APRIL binding to the receptors BCMA and TACI in CLL cells overcomes Par-4–mediated antitumor activity in CLL.14 This mechanism is thought to promote survival and proliferation in CLL through regulation of antiapoptotic proteins in the BCL2 and inhibitor of apoptosis protein families, as well as proapoptotic proteins such as Bax, and proliferation induced by binding of CD154 to CD40.14,18,19 BCR signaling and the subsequent cascade events have been targeted to therapeutic benefit with small-molecule inhibitors and protein domain mimetics that target NF-κB pathway proteins directly and the prosurvival BCL2 and inhibitor of apoptosis protein family members downstream.20-22 However, inhibition of NF-κB activity by Par-4 has not yet been demonstrated in CLL, and whether Par-4 mediates an antitumor effect in CLL is not known.
The activity of Par-4 protein has been shown to be tightly regulated through activating and inhibitory phosphorylation events by multiple kinases in several cell types, though few regulatory interactions have been described in the context of human disease.7,23-25 The composition of the Par-4 pathway in CLL is unknown, as is whether Par-4 is capable of NF-κB inhibition despite any negative regulation imparted by kinases downstream of the BCR. Here, we sought to examine the effect of Par-4 activity in the development and progression of CLL, modeled by overexpression in the Eµ-TCL1 murine leukemia model, and provide evidence for Par-4–mediated deregulation of NF-κB signaling and delayed leukemogenesis.26
Materials and methods
Generation of transgenic mice and tissue collection
Transgenic mice overexpressing human Par-4 in B cells were generated using human PAWR complimentary DNA (cDNA) cloned into our previously described pBH transgenic vector driven by IgH promoter and Eµ enhance elements.27 These mice are referred to as Par-4 mice, which are all heterozygous for the transgenic allele. Par-4 mice were bred to TCL1 mice to produce heterozygous double transgenics referred to as Par-4 × TCL1 mice. Par-4flox and CD19-CRE founder mice were purchased from Jackson Laboratory (Bar Harbor, ME) and bred to 1 TCL1 founder to produce double- and triple-transgenic siblings referred to as Par-4flox/flox × TCL1 and Par-4flox/flox × TCL1 × CRE. These mice are all heterozygous for the TCL1 and CRE alleles. All mice were genotyped by polymerase chain reaction (PCR) of DNA extracted from tail or ear snips using primers specific for Pawr, TCL1, loxP sites, or CRE. In vivo studies used whole splenocytes, bone marrow, peripheral blood collected by submandibular bleeding, or isolated B cells enriched from splenocytes using a Mouse Pan B Cell selection kit per the manufacturer’s protocol (STEMCELL Technologies, Vancouver, BC, Canada). Spleen, bone marrow, and blood samples were treated with red blood cell lysis buffer (eBioscience, San Diego, CA) prior to analysis or culture. All mouse experiments were performed under a protocol approved by The Ohio State University Institutional Animal Care and Use Committee.
Immunoblotting
Lysates from B cells were immunoblotted with antibodies for Par-4, glyceraldehyde-3-phosphate dehydrogenase, TCL1, actin, p65, RelB, LaminB, tubulin, IκBα, phospho-p65, and phospho-IκBα using standard procedures. Antibodies and manufacturers are listed in supplemental Methods. Fractionations were performed according to manufacturer’s protocol using the NE-PER nuclear and cytoplasmic extraction kit from ThermoFisher Scientific (Waltham, MA).
Flow cytometry
Flow cytometry for immunophenotyping, tracking of leukemic B-cell populations, and 5′-ethenyl-2′-deoxyuridine (EdU) incorporation was performed on an FC500 series (Beckman Coulter, Pasadena, CA) or LSRFortessa series cytometer. Data were analyzed and all plots were made using Kaluza analysis software (Beckman Coulter, Pasadena, CA). Antibodies, stains, and manufacturers are listed in supplemental Methods.
Tritiated thymidine incorporation assay
Isolated splenic B cells of >90% purity were cultured in triplicate in RPMI 1640 supplemented with 10% fetal bovine serum and 100 µM β-mercaptoethanol at 5 × 10⁶ cells/mL. 10 µg/mL α immunoglobulin M (αIgM), 3.2 µM CpG, 5 µg/mL lipopolysaccharide (LPS), and 250 ng/mL phorbol 12-myristate 13-acetate (PMA) + 500 ng/mL ionomycin were added to 3 wells each per mouse (n = 6) on 3 plates corresponding to 24-, 48-, and 72-hour time points. Wells were pulsed with 1 µCi tritiated thymidine 16 hours prior to each time point and then frozen at −20°C. Plates were thawed and harvested using standard procedures and then read on a TopCount NXT scintillation and luminescence counter (Perkin Elmer, Waltham, MA) to quantify β-particle emission from individual wells. Results are presented as a mean of triplicate averages for each genotype across all conditions.
Immunoglobulin quantification
Serum immunoglobulin concentrations across all classes were quantified with an enzyme-linked immunosorbent assay (R&D Systems, Minneapolis, MN) as previously described.28 Immune response studies were performed as described in supplemental Methods.
Histology
Formalin-fixed spleens were paraffinized and sectioned at 6 µM. Slides were stained in hematoxylin and eosin using standard procedures and imaged at 10× and 60× on an Olympus bx50 microscope (Olympus, Center Valley, PA).
EdU incorporation assay
One-year-old Par-4 × TCL1 or TCL1 mice were injected intraperitoneally with 50 mg/kg EdU (Sigma Aldrich, St. Louis, MO). Mice were euthanized and spleens were collected 24 hours after injection. Splenocytes were stained with amine reactive viability dye and antibodies specific for murine CD45, CD19, and CD5. EdU was then labeled using the click-iT EdU Alexa Fluor 647 Flow Cytometry Assay kit (Thermo Fischer Scientific, Waltham, MA) per the manufacturer’s protocol, and samples were immediately run on a flow cytometer.
Confocal microscopy
A total of 2 × 10⁶ splenocytes were fixed with 4% formaldehyde onto slides, which were then blocked in PBS with 1% bovine serum albumin, stained with anti-p65 antibody for 1 hour at room temperature, and then stained with anti-B220 antibody and Alexa Fluor 488 (AF488)–labeled anti-rabbit antibody for 1 hour at room temperature protected from light. Slides were then stained with 4′,6-diamidino-2-phenylindole (DAPI) and covered. Images were taken at original magnification ×60 on an Olympus FV3000 confocal microscope and analyzed using Imaris image analysis software (Bitplane, Concord, MA). A total of 300 B220+ cells were selected across 5 to 10 fields for analysis. Colocalization of AF488 and DAPI signals was determined yielding Manders colocalization coefficients,29 which were averaged across all fields for each animal. Antibodies and manufacturers are listed in supplemental Methods.
Statistics
Differences in disease progression, determined by expansion of CD45+/CD19+/CD5+ populations in the peripheral blood, were analyzed using mixed-effect models with repeat measurements for each subject. The Holm method was used to adjust multiplicity to control type I error rate at 0.05. Kaplan-Meier survival curves were constructed, and log-rank tests were used to compare surviving proportions between groups. EdU incorporation was analyzed by a 2-sample Student t test to compare the mean percentage of EdU+ cells between both genotypes with α set at 0.05. Data were analyzed by using SAS (Cary, NC). Confocal data were also analyzed using a 2-sample Student t test to compare mean Manders coefficients between genotypes with α set at 0.05.
Results
Generation and characterization of human Par-4 mice
To define the in vivo role of Par-4 in CLL, we generated transgenic mice overexpressing human Par-4 (PAWR) in their B cells. Toward this goal, human PAWR cDNA was cloned downstream of the IgVH promoter and Eµ enhancer in the pBH vector, which we have used extensively to express human transgenes in a B-cell–specific manner (Figure 1A).27,30 Pronuclear injection of the 3.5-kB DNA fragment containing the IgVH promoter/enhancer, PAWR cDNA and poly(A) tail into 0.5-day-old fertilized eggs resulted in multiple potential founders. Founders were confirmed by PCR using primers specific for the human PAWR gene to amplify a region of the injected cDNA (Figure 1B). Immunoblot analysis of protein lysates from brain, thymus, lymph node, and purified splenic B cells confirmed B-cell–specific overexpression of human Par-4 in transgenic, but not sex-matched nontransgenic, littermates (Figure 1C). Multicolor flow cytometric analysis of bone marrow cells from Par-4 transgenic and wild-type (WT) littermate controls revealed comparable levels of pro- (B220+CD43+CD24int), pre- (B220+CD43+CD24high), immature (B220+CD43−IgM+IgD−), and mature (B220+CD43−IgM+IgD+) B cells (Figure 2A). Subtype analysis of B cells from spleens did not reveal any significant differences in follicular (B220+CD23+IgD+) and marginal zone (B220+CD23-CD21/35+) B cells between Par-4 transgenic and WT controls (Figure 2B-C). Further, similar proportions of B1a (B220+CD5+CD11b+), B1b (B220+CD5-CD11b+), and B2 (B220+CD5−CD11b−) B cells were observed in the spleens and peritoneal cavities of Par-4 transgenic and WT control mice at 3 months of age (n = 4 spleens, n = 3 peritoneal cavities). These results are summarized in supplemental Figure 1.
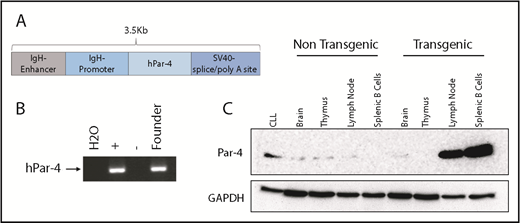
Generation of transgenic mice expressing human Par-4 (PAWR). (A) Composition of the linearized DNA construct used for pronuclear injection. The human Par-4 gene (PAWR) is placed upstream of the immunoglobulin heavy-chain promoter and Eµ enhancer. (B) PCR verification of the human Par-4 transgene in the genome of the founder line using primers specific for the human homolog. (C) Whole-cell lysates were made from the indicated tissues harvested from Par-4 transgenic and WT littermates and analyzed by immunoblot for Par-4 expression. Lysate from human CLL cells was included as a positive control. GAPDH, glyceraldehyde-3-phosphate dehydrogenase.
Generation of transgenic mice expressing human Par-4 (PAWR). (A) Composition of the linearized DNA construct used for pronuclear injection. The human Par-4 gene (PAWR) is placed upstream of the immunoglobulin heavy-chain promoter and Eµ enhancer. (B) PCR verification of the human Par-4 transgene in the genome of the founder line using primers specific for the human homolog. (C) Whole-cell lysates were made from the indicated tissues harvested from Par-4 transgenic and WT littermates and analyzed by immunoblot for Par-4 expression. Lysate from human CLL cells was included as a positive control. GAPDH, glyceraldehyde-3-phosphate dehydrogenase.
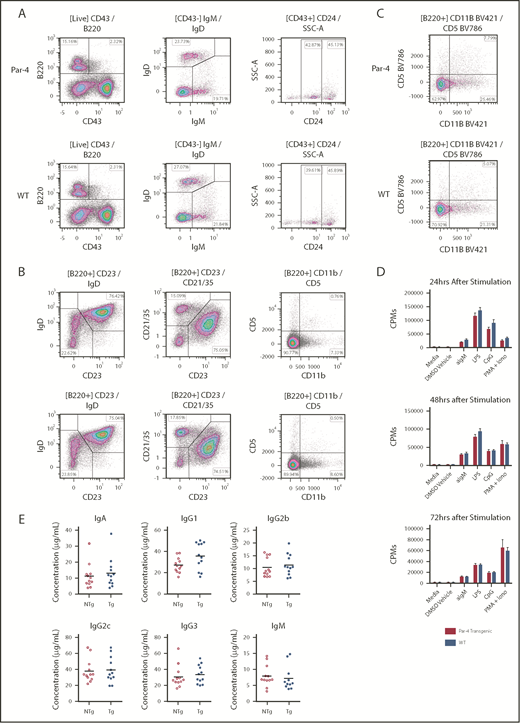
Development and functional analysis of B cells from Par-4 transgenic and nontransgenic littermates. (A-C) Bone marrow (A), spleen (B), and peritoneal cavity aspirate (C) from transgenic (Par-4) and nontransgenic (WT) individuals were stained for various B-cell markers and analyzed by flow cytometry. Dot plots gated on live B cells are shown from representative animals (n = 4). Populations of mature (CD43−IgM+IgD+), immature (CD43−IgM+IgD−), pro- (CD43+CD24Int), pre- (CD43+CD24+), marginal zone (CD21/35+CD23−IgD−), follicular (CD21/35+CD23+IgD+), B1a (CD11b+CD5+), B1b (CD11b+CD5−), and B2 (CD11b−CD5−) B cells were then determined. (D) Splenic B cells isolated from transgenic and nontransgenic animals (n = 6 per group) were stimulated with anti-mouse IgM, LPS, CpG, or PMA + ionomycin and incubated in the presence of tritiated thymidine for the indicated number of hours. Incorporated thymidine was determined as counts per minute (CPMs) and is shown as means for each group, with error bars indicating standard error of the mean. (E) Basal serum levels of IgM, IgA, IgG1, IgG2a, IgG2b, and IgG3 in transgenic (Tg; Par-4) and nontransgenic (NTg; WT) mice as determined by enzyme-linked immunosorbent assay. Bars represent mean serum concentrations of the indicated isotype (n = 12). DMSO, dimethyl sulfoxide.
Development and functional analysis of B cells from Par-4 transgenic and nontransgenic littermates. (A-C) Bone marrow (A), spleen (B), and peritoneal cavity aspirate (C) from transgenic (Par-4) and nontransgenic (WT) individuals were stained for various B-cell markers and analyzed by flow cytometry. Dot plots gated on live B cells are shown from representative animals (n = 4). Populations of mature (CD43−IgM+IgD+), immature (CD43−IgM+IgD−), pro- (CD43+CD24Int), pre- (CD43+CD24+), marginal zone (CD21/35+CD23−IgD−), follicular (CD21/35+CD23+IgD+), B1a (CD11b+CD5+), B1b (CD11b+CD5−), and B2 (CD11b−CD5−) B cells were then determined. (D) Splenic B cells isolated from transgenic and nontransgenic animals (n = 6 per group) were stimulated with anti-mouse IgM, LPS, CpG, or PMA + ionomycin and incubated in the presence of tritiated thymidine for the indicated number of hours. Incorporated thymidine was determined as counts per minute (CPMs) and is shown as means for each group, with error bars indicating standard error of the mean. (E) Basal serum levels of IgM, IgA, IgG1, IgG2a, IgG2b, and IgG3 in transgenic (Tg; Par-4) and nontransgenic (NTg; WT) mice as determined by enzyme-linked immunosorbent assay. Bars represent mean serum concentrations of the indicated isotype (n = 12). DMSO, dimethyl sulfoxide.
Overexpression of hPar-4 does not alter B-cell proliferative responses in vitro or T-cell–dependent and T-independent B-cell responses in vivo
Evidence has been put forth suggesting that response to BCR stimulation is enhanced in a whole-organism Par-4 knockout mouse, thereby prompting us to determine if Par-4 overexpression modulates B-cell functions.31 Purified B cells were stimulated with αIgM (BCR agonist), LPS (Toll-like receptor 4 agonist), CpG (Toll-like receptor 9 agonist), or PMA and ionomycin (PKC/Ca2+ signaling activators), and the proliferative response was measured by tritiated thymidine incorporation. Interestingly, there was no significant difference in response between B cells from Par-4 transgenic and nontransgenic WT control mice (Figure 2D). In addition, secreted immunoglobulin levels in the serum were also found to be comparable in Par-4 transgenic and WT control mice (Figure 2E). Consistent with the in vitro results, evaluation of in vivo immune response to type I and II T-cell–independent antigens (2,4,6-trinitrophenyl [TNP]-Ficoll and TNP-LPS), as well as T-cell–dependent antigens (2,4-dinitrophenyl keyhole limpet hemocyanin) revealed that immunoglobulin secretion in response to antigen was not significantly altered in Par-4 transgenic mice compared with nontransgenic WT controls (supplemental Figure 2A-B). Only IgG1 response to TNP-Ficoll was found to differ significantly. These results indicate that Par-4 overexpression in B cells does not affect proliferative response to TLR, PKC, and most BCR stimuli but perhaps does alter IgG1 secretion after exposure to type II T-independent antigen. Thus, Par-4–overexpressing mice do not display defective B-cell differentiation and develop populations of B cells that are immunophenotypically and functionally normal.
Par-4 expression delays leukemia development in Par-4 × TCL1 mice
To determine the effect of Par-4 overexpression in B-cell leukemogenesis, we bred our novel Par-4 transgenic mouse with the Eµ-TCL1 mouse, which is a well -characterized murine mouse model of CLL.26 Eµ-Par-4 × TCL1 double-transgenic mice (Par-4 × TCL1) express both transgenes in a B-cell–specific fashion. Importantly, western blot analysis of B-cell lysates from double-transgenic mice showed stable expression of TCL1 and Par-4 proteins, indicating a lack of cross-modulation in transgene expression (Figure 3A). It was also determined that Par-4 upregulation in the transgenic mice is ∼20-fold that of nontransgenics. Par-4 × TCL1 double-transgenic and TCL1 single-transgenic cohorts were tracked for disease progression, beginning at 6 months of age, by submandibular bleeding and flow cytometric analysis of blood samples for TCL1 -induced CD45+/CD19+/CD5+ leukemic cell populations. Par-4 × TCL1 double-transgenic mice displayed a CD5+ B cell population that was significantly less abundant relative to the TCL1 single-transgenic cohort at 10 months of age, averaging 6286 cells/µL of whole blood (range, 944-17 038) compared with a mean of 20 833 cells/µL (range, 1988-94 002) in TCL1 mice (Figure 3B-C; n = 14 TCL1, n = 21 Par-4 × TCL1, P = .0049). Par-4 overexpression was also found to confer a survival advantage. Survival times ranged from 300 to 431 days in the Par-4 × TCL1 cohort and 289 to 371 days in the TCL1 cohort with median survival times of 394 and 352 days, respectively (P = .0072, n = 9 TCL1, n = 14 Par-4 × TCL1) (Figure 3D). In addition, an adoptive transfer study in WT mice revealed delayed leukemia onset in mice that received Par-4 × TCL1-derived CD45+/CD19+/CD5+ leukemic B cells compared with cells from TCL1 transgenic mice (P = .0120) (supplemental Figure 3A-D). The median time to detectable leukemia (defined as >10% of CD45+/CD19+/CD5+ cells in blood) was 14 days in the TCL1 donor group and 42 days in the Par-4 × TCL1 donor group (n = 7 TCL1, n = 4 Par-4 × TCL1).

Par-4 decelerates accumulation of CLL-like cells in Par-4 × TCL1 mice. Par-4 transgenic mice were bred to the TCL1 leukemia model to produce Par-4 × TCL1 mice. (A) Par-4 × TCL1 mice were checked for expression of both transgenes by immunoblot using lysate made from purified splenic B cells. (B) Cohorts of TCL1 mice (n = 14) and Par-4 × TCL1 mice (n = 21) were bled monthly starting at 6 months, and disease was tracked by flow cytometry that quantified the absolute counts of CD45+CD19+CD5+ leukemic cells per microliter of peripheral blood (P = .0049). (C) Representative dot plots of peripheral blood flow from TCL1 and Par-4 × TCL1 animals at 10 months of age. (D) Overall survival data displayed in a Kaplan-Meier curve (n = 9 TCL1, n = 14 Par-4 × TCL1, P = .0072). (E) Par-4flox/flox mice were bred to CD19-Cre mice to produce a B-cell–specific Par-4 knockout line, which was verified by immunoblot using lysate from purified splenic B cells. Par-4 knockout mice were then bred to TCL1 mice to produce triple-transgenic Par-4flox/flox × CD19-CRE × TCL1 mice. Cohorts of triple-transgenic (n = 5) and Par-4flox/flox × TCL1 (n = 6) mice were bled monthly starting at 8 months, and disease was tracked as above. (F) Absolute counts of CD45+CD19+CD5+ leukemic cells per microliter of blood at ages 8 to 10 months (P = .0153). (G) Representative dot plots of peripheral blood flow from Par-4flox/flox × CD19-CRE × TCL1 and Par-4flox/flox × TCL1 animals at 10 months of age. (H) Overall survival data displayed in a Kaplan-Meier curve (n = 5 Par-4flox/flox × CD19-CRE × TCL1, n = 4 Par-4flox/flox × TCL1, P = .01). Bars in graphs displaying absolute leukemia cell counts indicate the mean, with error bars representing the standard error of the mean. Results were analyzed in a mixed-effect model for absolute leukemia cell counts and a log-rank test for differences in median survival time. FITC, fluorescein isothiocyanate; PE, phycoerythrin; TG, transgenic.
Par-4 decelerates accumulation of CLL-like cells in Par-4 × TCL1 mice. Par-4 transgenic mice were bred to the TCL1 leukemia model to produce Par-4 × TCL1 mice. (A) Par-4 × TCL1 mice were checked for expression of both transgenes by immunoblot using lysate made from purified splenic B cells. (B) Cohorts of TCL1 mice (n = 14) and Par-4 × TCL1 mice (n = 21) were bled monthly starting at 6 months, and disease was tracked by flow cytometry that quantified the absolute counts of CD45+CD19+CD5+ leukemic cells per microliter of peripheral blood (P = .0049). (C) Representative dot plots of peripheral blood flow from TCL1 and Par-4 × TCL1 animals at 10 months of age. (D) Overall survival data displayed in a Kaplan-Meier curve (n = 9 TCL1, n = 14 Par-4 × TCL1, P = .0072). (E) Par-4flox/flox mice were bred to CD19-Cre mice to produce a B-cell–specific Par-4 knockout line, which was verified by immunoblot using lysate from purified splenic B cells. Par-4 knockout mice were then bred to TCL1 mice to produce triple-transgenic Par-4flox/flox × CD19-CRE × TCL1 mice. Cohorts of triple-transgenic (n = 5) and Par-4flox/flox × TCL1 (n = 6) mice were bled monthly starting at 8 months, and disease was tracked as above. (F) Absolute counts of CD45+CD19+CD5+ leukemic cells per microliter of blood at ages 8 to 10 months (P = .0153). (G) Representative dot plots of peripheral blood flow from Par-4flox/flox × CD19-CRE × TCL1 and Par-4flox/flox × TCL1 animals at 10 months of age. (H) Overall survival data displayed in a Kaplan-Meier curve (n = 5 Par-4flox/flox × CD19-CRE × TCL1, n = 4 Par-4flox/flox × TCL1, P = .01). Bars in graphs displaying absolute leukemia cell counts indicate the mean, with error bars representing the standard error of the mean. Results were analyzed in a mixed-effect model for absolute leukemia cell counts and a log-rank test for differences in median survival time. FITC, fluorescein isothiocyanate; PE, phycoerythrin; TG, transgenic.
B-cell–specific Par-4 knockout mice, generated through use of a floxed Pawr allele and CRE expression regulated by the endogenous CD19 promoter (Figure 3E), were also crossed to TCL1 mice and tracked for disease progression. These triple-transgenic Par-4flox/flox × CRE × TCL1 mice showed accelerated leukemia development compared with double-transgenic Par-4flox/flox × TCL1 littermates. CD5+ B cell counts averaged 3462 cells/µL of whole blood (range, 101-10 814) in Par-4flox/flox × TCL1 mice and 23 765cells/µL in Par-4flox/flox × CRE × TCL1 mice (range, 271-66 474) at 10 months of age (P = .0153, n = 7 Par-4flox/flox × TCL1, n = 5 Par-4flox/flox × CRE × TCL1) (Figure 3F-G). B-cell–specific Par-4 knockout in the TCL1 model conferred a disadvantage in survival (Figure 3H). Survival times ranged from 268 to 353 days in the Par-4flox/flox × CRE × TCL1 cohort and 324 to 443 days in the Par-4flox/flox × TCL1 cohort with median survival times of 292 and 388 days, respectively (P = .0108, n = 4 Par-4flox/flox × CRE × TCL1, n = 5 Par-4flox/flox × TCL1).
Interestingly, end-point analysis of individual mice from the TCL1 and Par-4 × TCL1 cohorts upon meeting euthanasia criteria suggests that TCL1-driven leukemia pathology is not abated by Par-4 overexpression. Splenomegaly and infiltration of the bone marrow by CD5+ B cells were observed in Par-4 × TCL1 double-transgenic mice to degrees that were not found to differ from TCL1 single-transgenic mice (Figure 4A-B) (n = 6). Spleen weights averaged 1.78 g in the Par-4 × TCL1 cohort compared with 1.95 g in the TCL1 cohort. Analysis of spleen and bone marrow by flow cytometry revealed that the mean percentage of CD45+ cells made up of CD5+ leukemic B cells was 63.08% (range, 48.80-80.29) in the spleen and 8.09% (range, 1.24-22.36) in the bone marrow of Par-4 × TCL1 mice compared with 72.49% (range, 50.04-89.49) in the spleen and 14.4% (range, 3.27-31.39) in the bone marrow of TCL1 mice (Figure 4C-D). While overexpression of human Par-4 does appear to slow the initial expansion of malignant B-cell populations, the disease ultimately still demonstrates a similar pathology.
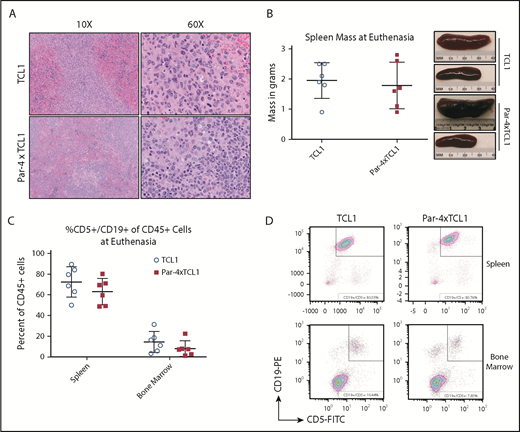
Infiltration of the spleen by malignant lymphocytes in TCL1 and Par-4 × TCL1 mice. Tissues were collected from mice that met euthanasia criteria and analyzed for infiltration by leukemic B cells. (A) Formalin-fixed paraffin-embedded spleen sections stained with hematoxylin and eosin viewed at original magnification ×10 and ×60 showing infiltration of neoplastic round cells. (B) Mass of spleens excised from animals upon euthanasia, with representative images from the indicated genotypes. (C) Spleens and bone marrow from euthanized animals were analyzed via flow cytometry for infiltration by CD45+CD5+CD19+ leukemia cells. Bars indicate the mean, with error bars representing the standard error of the mean. (D) Representative dot plots of spleen and bone marrow flow from euthanized TCL1 and Par-4 × TCL1 mice.
Infiltration of the spleen by malignant lymphocytes in TCL1 and Par-4 × TCL1 mice. Tissues were collected from mice that met euthanasia criteria and analyzed for infiltration by leukemic B cells. (A) Formalin-fixed paraffin-embedded spleen sections stained with hematoxylin and eosin viewed at original magnification ×10 and ×60 showing infiltration of neoplastic round cells. (B) Mass of spleens excised from animals upon euthanasia, with representative images from the indicated genotypes. (C) Spleens and bone marrow from euthanized animals were analyzed via flow cytometry for infiltration by CD45+CD5+CD19+ leukemia cells. Bars indicate the mean, with error bars representing the standard error of the mean. (D) Representative dot plots of spleen and bone marrow flow from euthanized TCL1 and Par-4 × TCL1 mice.
Par-4 overexpression reduces tumor cell proliferation in vivo
To probe the phenotype displayed by Par-4 × TCL1 mice, we sought to examine the influence of the transgene on expansion of malignant B-cell populations in vivo. TCL1-driven disease is characterized by a B-cell lymphocytosis, wherein expansion of malignant clones occurs primarily in the spleen of transgenic animals.32,33 To evaluate the in vivo expansion of malignant cells, we used an EdU incorporation assay followed by flow cytometric analysis of CD45+/CD19+/CD5+ populations in the spleens of Par-4 × TCL1 and TCL1 mice. Par-4 × TCL1 mice exhibited a ∼50% reduction in EdU-positive cells compared with TCL1 mice after a 24-hour incubation period (Figure 5A-B), with 4.3% of leukemic B cells staining positive for EdU in the Par-4 × TCL1 group, compared with an average of 8.5% in TCL1 mice (P = .0100, n = 8 TCL1, n = 5 Par-4 × TCL1). This suggests that the leukemic cells in Par-4–overexpressing mice are expanding at a reduced rate relative to the leukemia in single-transgenic TCL1 mice.
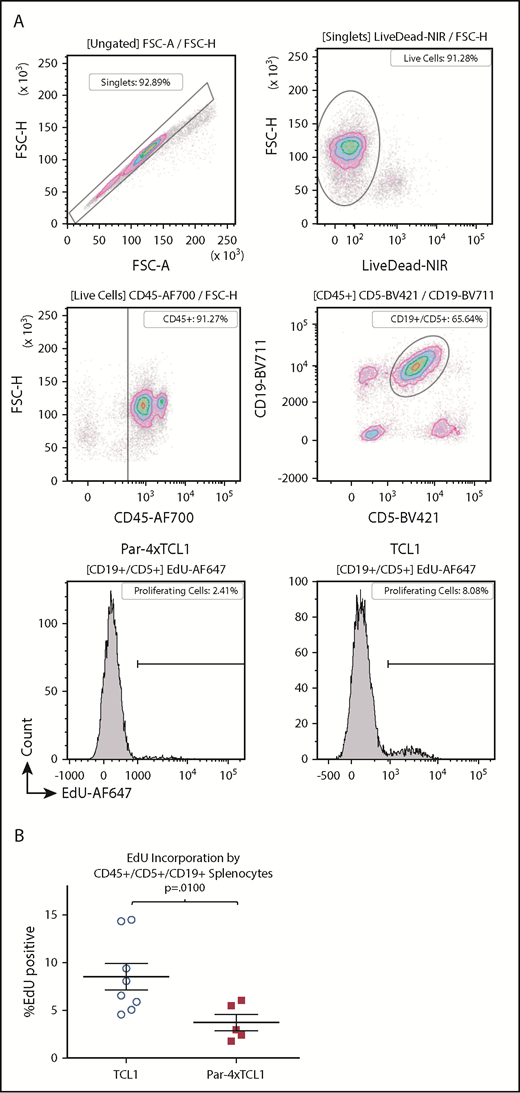
Par-4 overexpression in TCL1 mice hinders expansion of malignant clones. Expansion of malignant clones was quantified in vivo by EdU incorporation. (A) Representative flow plots and histograms showing EdU incorporation by single, live, CD45+CD19+CD5+ splenocytes from TCL1 and Par-4 × TCL1 mice. (B) Quantification of EdU-positive leukemic cells in TCL1 (n = 8) and Par-4 × TCL1 (n = 5) mice. Results were analyzed using a 2-sample Student t test for significance with α set to 0.05 (P = .0100). FSC-A, forward scatter area; FSC-H, forward scatter height.
Par-4 overexpression in TCL1 mice hinders expansion of malignant clones. Expansion of malignant clones was quantified in vivo by EdU incorporation. (A) Representative flow plots and histograms showing EdU incorporation by single, live, CD45+CD19+CD5+ splenocytes from TCL1 and Par-4 × TCL1 mice. (B) Quantification of EdU-positive leukemic cells in TCL1 (n = 8) and Par-4 × TCL1 (n = 5) mice. Results were analyzed using a 2-sample Student t test for significance with α set to 0.05 (P = .0100). FSC-A, forward scatter area; FSC-H, forward scatter height.
Par-4 downregulates NF-κB signaling through inhibition of p65 translocation
As NF-κB signaling downstream of the BCR has been described as a major contributor to the survival and proliferation of TCL1-driven leukemia and human CLL cells, we investigated the molecular consequence of Par-4 overexpression on the NF-κB signaling pathway. Levels of total and phosphorylated IκBα were examined by western blot analysis of cytoplasmic protein extracts isolated from mouse B cells. No difference was observed between TCL1 and Par-4 × TCL1 mice (supplemental Figure 4A). We next examined nuclear translocation of NF-κB transcription factors using nuclear and cytoplasmic fractions of proteins isolated from splenic B cells of Par-4 × TCL1 and TCL1 littermates by probing for p65 and RelB. p65 levels appeared lower in Par-4 × TCL1 mice relative to TCL1, suggesting that TCL1-induced p65 nuclear translocation is inhibited by Par-4 overexpression (supplemental Figure 4A). However, cytoplasmic p65 levels, as well as cytoplasmic and nuclear levels of RelB (supplemental Figure 4B), were not found to differ between genotypes, nor was p65 phosphorylation. p21 expression was also examined, due to a well-known influence on proliferation and recently published data suggesting a relationship with Par-4 expression. Par-4 expression was not shown to influence p21 expression in mouse B cells but did downregulate p21 in 1 of 3 B cell lines tested (supplemental Figure 4C-D). A direct binding interaction, previously shown to occur between Par-4 and p65, was also tested in a coimmunoprecipitation experiment and found not to occur in human B-cell lines or mouse primary B cells (supplemental Figure 5A-B).34
To more closely examine p65 translocation, confocal microscopy was performed using whole splenocytes isolated from Par-4 × TCL1 and TCL1 mice and quantified using Imaris image software to determine any difference in localization. LPS stimulation of WT B cells followed by confocal microscopy and image quantification was performed to demonstrate a detectable range of p65 nuclear signal (Figure 6A-C). B220+ positivity was used to select B cells from fields of whole splenocytes for analysis of p65 and DAPI colocalization (Figure 6D). Mean colocalization of DAPI stain and AF488-labeled p65 was found to be lower in the B cells of Par-4 × TCL1 mice relative to TCL1 littermates, which yielded mean Manders coefficients of 0.63 and 0.89, respectively (Figure 6E-G; n = 5, P = .0270). This result was further supported by gel shift experiments using nuclear lysate from TCL1 and Par-4 × TCL1 mice (supplemental Figure 6; n = 5, P = .0014). These data suggest that while signal transduction through the NF-κB pathway is intact, there is a defect in p65 translocation conferred by Par-4 overexpression.
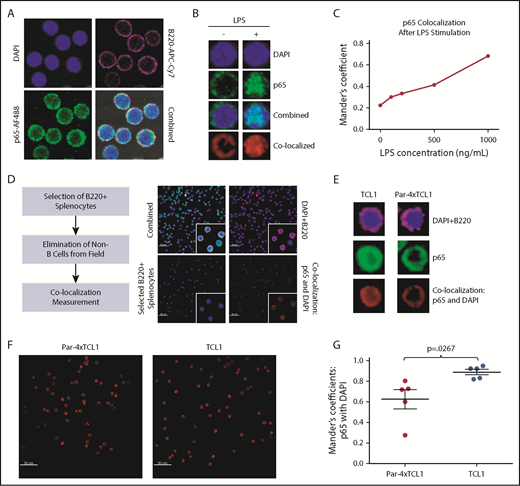
Par-4 downregulates p65-mediated NF-κB signaling. (A) Whole splenocytes from 3- to 4-month-old WT mice mounted, fixed, and stained with anti-B220-APC-Cy7, DAPI, rabbit anti-p6,5 and anti-rabbit-AF488 secondary after stimulation with LPS. (B) Representative images of single, B220+ cells measured for colocalization of AF488-labeled p65 with DAPI stain with and without LPS stimulation. (C) Colocalization of AF488 and DAPI stains, digitally quantified by Imaris imaging software using the Manders coefficient, was shown to increase in a dose-dependent manner after LPS stimulation. (D) Whole splenocytes from 3- to 4-month-old TCL1 and Par-4 × TCL1 mice were mounted, fixed, and stained with anti-B220-APC-Cy7, DAPI, rabbit anti-p65 and anti-rabbit-AF488 secondary. Cells selected by B220 positivity were measured for colocalization of p65 signal with DAPI stain to determine nuclear localization of p65. (E) Representative images of single B220+ cells from both genotypes measured for colocalization of AF488-labeled p65 with DAPI stain. (F) Representative colocalization images of single 60× fields containing 60 cells from TCL1 and Par-4 × TCL1 mice showing less p65 colocalization with DAPI stain in Par-4 × TCL1 mice. (G) Quantification of colocalization by Imaris imaging software through use of the Manders coefficient (P = .0267, n = 5). Results were tested for significance in an unpaired Student t test with α set to 0.05. Original magnification ×60 for panels A-B,D-F.
Par-4 downregulates p65-mediated NF-κB signaling. (A) Whole splenocytes from 3- to 4-month-old WT mice mounted, fixed, and stained with anti-B220-APC-Cy7, DAPI, rabbit anti-p6,5 and anti-rabbit-AF488 secondary after stimulation with LPS. (B) Representative images of single, B220+ cells measured for colocalization of AF488-labeled p65 with DAPI stain with and without LPS stimulation. (C) Colocalization of AF488 and DAPI stains, digitally quantified by Imaris imaging software using the Manders coefficient, was shown to increase in a dose-dependent manner after LPS stimulation. (D) Whole splenocytes from 3- to 4-month-old TCL1 and Par-4 × TCL1 mice were mounted, fixed, and stained with anti-B220-APC-Cy7, DAPI, rabbit anti-p65 and anti-rabbit-AF488 secondary. Cells selected by B220 positivity were measured for colocalization of p65 signal with DAPI stain to determine nuclear localization of p65. (E) Representative images of single B220+ cells from both genotypes measured for colocalization of AF488-labeled p65 with DAPI stain. (F) Representative colocalization images of single 60× fields containing 60 cells from TCL1 and Par-4 × TCL1 mice showing less p65 colocalization with DAPI stain in Par-4 × TCL1 mice. (G) Quantification of colocalization by Imaris imaging software through use of the Manders coefficient (P = .0267, n = 5). Results were tested for significance in an unpaired Student t test with α set to 0.05. Original magnification ×60 for panels A-B,D-F.
Discussion
Here, we have described the role of Par-4 in the context of a hematological malignancy model commonly used for mechanistic study of oncogenes, tumor suppressors, and the tumor microenvironment in the development of CLL. It was observed that while B-cell–specific overexpression of Par-4 protein has no discernible effect on normal B-cell development or function, it does exert an influence over development of TCL1-driven B-cell leukemia. Peripheral disease development in Par-4 × TCL1 mice was found to lag behind that of TCL1 littermates, indicating that upregulation of Par-4 activity through overexpression confers a phenotype specific to the leukemia. The disease was not shown to differ in severity at euthanasia, with spleen sizes and infiltration of leukemic cells into the bone marrow being observed to similar degrees in both genotypes. However, there is a significant survival advantage enjoyed by Par-4–overexpressing mice. Characterization of this phenotype revealed that Par-4 × TCL1 clones expand at reduced rates in the spleen relative to TCL1 control animals. Further, TCL1-driven NF-κB signaling was inhibited by Par-4 overexpression in the B cells of double transgenic animals through impairment of p65 nuclear translocation.
We recently reported that whole-organism knockout Pawr−/− × TCL1 mice display delayed disease development and improved survival compared with Pawr+/+ × TCL1 mice.35 This is ascribed to upregulated p21 expression in leukemic B cells and decreased proliferation resulting from Par-4 knockout. Interestingly, the Par-4 overexpression in leukemic B cells reported here also results in delayed disease progression, suggesting roles for Par-4 in both the leukemia cells and the tumor microenvironment during disease progression. This hypothesis is further substantiated by conditional deletion of Par-4 in the leukemic B cells of Par-4flox/flox × CRE × TCL1 mice, which resulted in accelerated disease progression and abbreviated survival, confirming a role for Par-4 in the Pawr−/− × TCL1 model that is not reliant on deletion in B cells. Par-4 has been shown in the whole-organism knockout to influence T-cell–mediated immune response, which is known to be compromised in CLL, promoting immunoevasion.31 Immune dysfunction could explain the opposing effects of Par-4 presence in the microenvironment and the leukemia cell itself. This is consistent with the pleotropic nature of the Par-4 pathway observed in numerous solid tumors. We also confirmed that overexpression of human Par-4 has no effect on p21 in mouse B cells, but knockdown does result in upregulation of p21 in some human CLL cell lines. It is therefore possible that Par-4 orthologs have varying functions or that the relationship does not exist in mice. It could also be the case that Par-4 knockdown alone is not sufficient to upregulate p21 in B cells and that the activity of another unidentified protein is required. The role of Par-4 in the tumor microenvironment and its influence on CLL pathogenesis in vivo remains to be elucidated.
Par-4 is described as having a cancer-specific activation quality that causes its upregulation to be inconsequential in untransformed cell types.7,36-39 This observation, in conjunction with the studies performed here, indicates that Par-4 exerts its influence only in B cells that upregulate NF-κB signaling through oncogenic mechanisms for survival and proliferation. It is therefore possible that Par-4 can be of prognostic use in the treatment of CLL with therapies that downregulate NF-κB signaling as part of the mechanisms of action. Several kinase inhibitors currently in the clinic, notably ibrutinib, effectively impair the ability of CLL to survive and proliferate by targeting vital components in the BCR signaling cascade. Par-4 appears be present in the cascade at some juncture, influencing downstream NF-κB activation in response to aberrant upstream signaling. NF-κB signaling is triggered by not only BCR stimulation but also ROR1 signaling in response to Wnt5a exposure.40 This pathway contributes to relapse in CLL that is refractory after Bruton tyrosine kinase inhibitor therapy, as these cells are still able to affect NF-κB signaling.41 Targets further downstream in the cascade, such as those that regulate Par-4 activity, may be viable candidates for targeted therapy in CLL after Bruton tyrosine kinase inhibitor treatment, because they are more distal from the surface receptors that generate the initial signals. The TCL1 mouse has already shown efficacy as a preclinical development tool for experimental therapies, and thus, the Par-4 × TCL1 double-transgenic model described here can be used to probe the influence of this protein on response to experimental therapeutics, as well as those already in the clinic.
Par-4 represents a unique opportunity for therapeutic intervention in CLL. As previously stated and shown by Boehrer et al, CLL cells do not downregulate Par-4 protein as many cancers do to resist Par-4 induced apoptosis.10 Rather, it is slightly upregulated relative to untransformed B cells, which is interesting considering its primary functions are to downregulate BCL2 expression and NF-κB signaling, both of which are shown vital to development and progression of CLL. We believe this is due to 2 features of CLL that place the Par-4 pathway in a context that differs greatly from that of cancers where Par-4 has been more heavily studied. First, CLL cells do not express WT1, which has been shown to partner with Par-4 and bind to the BCL2 promoter to regulate expression.4,42 This perhaps is how CLL cells can display upregulation of both proteins, which are typically thought to show a reciprocal expression pattern.43 Second, CLL cells display constitutive stimulation of the NF-κB pathway through chronic BCR signaling. This same phenomenon is seen in the TCL1 model, where basal activity in unstimulated B cells is high in transgenic animals due to activation of ataxia-telangiectasia mutated and cyclic AMP response element–binding protein/p300 by TCL1 overexpression.44,45 Our work in the TCL1 model has for the first time confirmed that the Par-4 protein can exert an antileukemic effect when sufficient protein activity is established through overexpression. We propose that further study of Par-4 in CLL is warranted to more completely describe its regulation and relationship with kinases targeted with small-molecule inhibitor therapy.
The full-text version of this article contains a data supplement.
Acknowledgments
This work was supported by the National Institutes of Health, National Cancer Institute (grants R01CA165469, R01CA197844, R01CA159296, and R35CA197734), the D. Warren Brown Foundation, the Four Winds Foundation, the Sullivan Chronic Lymphocytic Leukemia Research Fund, and the Connie Brown CLL Foundation. The authors gratefully acknowledge The Ohio State University Leukemia Tissue Bank Shared Resource for providing patient samples and the Genetically Engineered Mouse Modeling Core for generation of the transgenic mice (supported by P30CA016058).
Authorship
Contribution: J.T.G. designed and performed research, analyzed data, and wrote the manuscript; R.M. designed and performed research and analyzed data; R.R., F.F., M.Y., K.Z., R.W., and M.T. performed research; B.H. analyzed and interpreted data; X.M. performed statistical analyses; M.M., V.M.R., and S.B. designed research; and J.C.B. and N.M. designed research and wrote the manuscript.
Conflict-of-interest disclosure: The authors declare no competing financial interests.
Correspondence: Natarajan Muthusamy, Division of Hematology, Department of Internal Medicine, The Ohio State University, Room 455E, OSUCCC, 410 W 12th Ave, Columbus, OH 43210; e-mail: raj.muthusamy@osumc.edu.

