Key Points
According to next-generation deep sequencing, TN patients with ET may have “low-level” driver mutations affecting JAK2 or MPL.
Gene expression analysis suggests that in ET, including “true” TN, transcriptional misregulation occurs with resultant JAK-STAT pathway activation.

Abstract
Approximately 10% to 15% of patients with essential thrombocythemia (ET) lack the common driver mutations, so-called “triple-negative” (TN) disease. We undertook a systematic approach to investigate for somatic mutations and delineate gene expression signatures in 46 TN patients and compared the results to those with known driver mutations and healthy volunteers. Deep, error-corrected, next-generation sequencing of peripheral blood mononuclear cells using the HaloPlexHS platform and whole-exome sequencing was performed. Using this platform, 10 (22%) of 46 patients had detectable mutations (MPL, n = 6; JAK2V617F, n = 4) with 3 of 10 cases harboring germline MPL mutations. RNA-sequencing and DNA methylation analysis were also performed by using peripheral blood mononuclear cells. Pathway analysis comparing healthy volunteers and ET patients (regardless of mutational status) identified significant enrichment for genes in the tumor necrosis factor, NFκB, and MAPK pathways and upregulation of platelet proliferative drivers such as ITGA2B and ITGB3. Correlation with DNA methylation showed a consistent pattern of hypomethylation at upregulated gene promoters. Interrogation of these promoter regions highlighted enrichment of transcriptional regulators, which were significantly upregulated in patients with ET regardless of mutation status, including CEBPβ and NFκB. For “true” TN ET, patterns of gene expression and DNA methylation were similar to those in ET patients with known driver mutations. These observations suggest that the resultant ET phenotype may, at least in part and regardless of mutation type, be driven by transcriptional misregulation and may propagate downstream via the MAPK, tumor necrosis factor, and NFκB pathways with resultant JAK-STAT activation. These findings identify potential novel mechanisms of disease initiation that require further evaluation.
Introduction
Classical Philadelphia-negative myeloproliferative neoplasms (MPNs) are multipotent, clonal hematopoietic stem cell neoplasms encompassing essential thrombocythemia (ET), polycythemia vera (PV), and primary myelofibrosis. These disorders have an overlapping yet heterogeneous clinical spectrum, with both ET and PV having the potential to transform to myelofibrosis.1,2 Furthermore, MPNs predispose to an increased risk of thromboembolic events and have an inherent risk of transformation to acute myeloid leukemia (AML; 1% to 2% for ET/PV and up to 10% to 20% in primary myelofibrosis at 10 years).2,3
ET is specifically characterized by increased numbers of abnormal, clonal megakaryocytes and a clinical phenotype of thrombocytosis. Although rare cases of hereditary ET have been observed, the majority of ET cases occur sporadically, most commonly associated with somatic mutations in either JAK2 exon 14, CALR exon 9, or MPL exon 10, all of which lead to upregulated JAK-STAT signaling.4 Mutations in JAK2, CALR, and MPL are usually mutually exclusive, with an incidence of 55%, 25%, and 3%, respectively.5 However, 10% to 15% of patients with ET do not harbor detectable “driver” mutations, at least according to conventional diagnostic assays, and are termed “triple negative” (TN). Previous research using whole-exome sequencing (WES) has reported novel MPL and JAK2 mutations in TN MPN, highlighting disease heterogeneity.4
Limited data exist concerning both extended gene expression analyses and detailed methylation profiles of ET progenitor cells, particularly regarding the TN ET population. Using genome-wide methylation arrays, Pérez et al6 evaluated the epigenetic landscape of 71 patients with chronic MPN and 13 with transformed MPN compared with healthy volunteers (HVs). Although a distinct MPN-associated methylation signature was evident compared with HVs, no differential pattern existed between the chronic disease categories (primary myelofibrosis vs PV/ET). The differentially methylated regions appear enriched in a gene network centered on inflammation and the NFκB pathway. In a cohort of patients with MPN, Rice et al7 described aberrations affecting components of a noncanonical polycomb repressive complex 2 (EZH1, SUZ12, and JARID2) and, interestingly, upregulation of the transcription factor (TF) NFIB, resulting in cellular protection from apoptosis. More recently, Wong et al8 reported significant pro-inflammatory gene upregulation in an MPN cohort.
We hypothesized that patients with ET have a unique gene expression and methylation signature that may serve as a diagnostic tool in those who lack classical driver mutations. We therefore evaluated 46 TN ET patients, aiming to delineate if there are differential epigenetic and gene expression profiles compared with ET patients with known driver mutations.
Methods
Patient samples
A total of 56 patients with ET, 2 patients with post-ET myelofibrosis as defined by the 2008 World Health Organization criteria, and 4 healthy HVs were enrolled into the study. Baseline mutation status to exclude the presence of JAK2V617F, CALR, or MPL mutations was determined per local clinical laboratory protocols. Written informed consent was obtained in accordance with the Declaration of Helsinki and with approval from the local ethical review committee.
Whole-exome sequencing
Using peripheral blood mononuclear cells (PBMCs), WES libraries were prepared using the SureSelectXT Human All Exon V4 (Agilent Technologies) target enrichment system as per manufacturer’s protocols. Details of the bioinformatics analysis pipeline are provided in the supplemental Methods. Briefly, genomic DNA libraries prepared by using SureSelectXT Human All Exon V4 were sequenced on the Illumina HiSeq 2000 platform (Illumina) with 100 bp paired-end reads. Reads were aligned to the reference human genome (hg19, b37) using NovoAlign (Novocraft Technologies). Alignments underwent quality control and filtering. In each sample, >87% of the GENCODE-defined coding bases of the exome was represented by at least 20 reads. Pairwise variant calling was performed by using SAM tools and filtered by using VarScan2.
Targeted next-generation sequencing
Targeted deep sequencing of genes known to be mutated in myeloid malignancies was performed by using the HaloPlexHS platform (Agilent Technologies) on peripheral blood PBMCs. The mean sequencing coverage was 95%, and 90% of target sequences could be analyzed with a coverage >90%. A list of the genes covered and details of the analysis pipeline are provided in supplemental Table 1.
Gene expression profiles
RNA-sequencing was performed on a selected subset of individuals based on sample availability, which included 12 “true” TN patients, 3 known JAK2V617F and 3 CALR mutated patients, and 4 HVs. RNA was extracted from PBMCs by using TRIzol reagent (Life Technologies). Libraries were prepared by using the Illumina TruSeq Stranded RNA kit following the manufacturer’s instructions and sequenced by using an Illumina HiSeq 2500 instrument. Differentially expressed genes were identified by using limma.9 Full details of the bioinformatics analysis are provided in the supplemental Methods.
Epigenetic signatures
Methylation profiles were performed in a selected cohort of enrolled individuals based on sample availability: 21 TN patients (12 of 21 had gene expression performed as described earlier) and 4 JAK2V617F mutated, 2 MPL mutated, and 3 CALR mutated (one JAK2V617F and 2 MPL patients were identified in retrospect from the WES data) patients. Genomic DNA extracted from PBMCs was bisulfite converted by using the EZ DNA Methylation kit (Zymo Research), as per the manufacturer’s protocol and processed on an Infinium Human-Methylation 850K BeadChip platform. Further details are provided in the supplemental Methods.
Reverse-transcriptase quantitative polymerase chain reaction
To investigate the abundance of the gene-specific transcript of 20 candidate genes identified with altered expression, we prepared complementary DNA from total RNA in an additional 20 peripheral blood samples of ET patients (9 JAK2V617F positive, 7 CALR positive, and 4 TN) and 6 HVs10 (supplemental Table 2). Gene expression was assessed with reverse-transcriptase quantitative polymerase chain reaction (RT-qPCR) using gene-specific probes for the following 20 candidate genes: CEBPβ, ELK1, FAXDC2, FOSL2, GP1BB, GTPBP1, ITGA2B, ITGA7, ITGB3, JUN, JUND, KLF1, MAPKAPK2, MARCKS, NFκB2, PFKFB3, RELA, SPI1, TAL1, and TGFB1 (supplemental Table 3). Assays were run in triplicate on the ABI7900 platform (Applied Biosystems).
Assays were performed as previously described11 ; ABL1 cycle threshold values ≤30 were used for quality assessment. We quantified differences in the expression level (fold change) of the 20 candidate genes between the ET cohort and HVs by using a comparative cycle threshold values platform (Applied Biosystems), and gene expression in the ET samples was compared with HVs, with ABL1 as a reference gene. No-template and no-reverse-transcriptase controls were used to ensure specific amplification of target transcripts.
Results
The clinical and hematologic parameters and treatment regimens for the TN patients enrolled in this study are shown in Table 1.
Identification of somatic and germline mutations
Targeted, error-corrected sequencing and WES identified somatic or germline mutations in 10 patients (Table 2). Six patients were identified as having mutations in MPL: 4 patients with mutations in exon 10 (W515R, W5151G/S, and S505N), 1 patient with a mutation in exon 11 (R537W), and 1 patient with a mutation in exon 9 (MPL P453R). Four patients had the JAK2V617F mutation. Among the 6 patients identified as having an MPL mutation, this was a germline mutation in 3 patients, including an MPL P435R mutation in a female patient with post-ET myelofibrosis, and an MPL S505N mutation shared by a father and son pair. In the latter cases, the MPL S505N mutation was confirmed to be a germline mutation as it was detected by WES in both PBMCs and skin.
Gene expression profiling
In total, 22% of clinically diagnosed TN ET patients in our cohort harbored driver mutations detected by next-generation sequencing that were not detected by conventional testing. However, most patients displaying a clinical ET phenotype still had no detectable driver mutations via next-generation sequencing, and hence we proceeded to investigate the gene expression profiles of these so-called “true” TN patients.
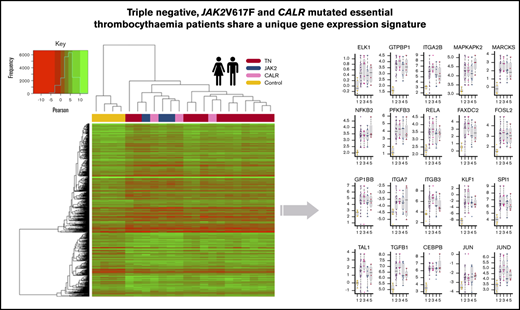
RNA-sequencing was performed on 12 true TN patients (ie, no driver mutations identified by next-generation sequencing), three JAK2V617F-mutated patients, three CALR-mutated patients, and four HVs. First, the data were interrogated to identify if any gene expression differences existed between the TN cohort and patients with known CALR and JAK2V617F mutations. Notably, gene expression profiles correlated strongly with each other across all ET patients regardless of mutational status (supplemental Figure 1A). Moreover, direct comparisons between the 12 TN patients and 6 patients with known mutations yielded limited significant differences (supplemental Figure 1B). In contrast, compared with that of HVs, the gene expression profiles of each ET subset showed consistent significant differences, regardless of disease subtype, platelet counts, treatment, and age (Figure 1A). Because there seemed to be a set of unique genes in the TN comparison, we further analyzed these genes; however, no significant differences in expression were determined comparing TN samples vs the rest of the ET cohort. Moreover, these genes followed a similar expression pattern in the JAK2V617F and CALR samples compared with the HV samples (supplemental Figure 1C-D).
![Processing of RNA-sequencing data to establish genes with altered expression and significant pathways. (A) Venn diagram illustrating the overlap of DEGs identified across each ET subtype vs HV (control) (adjusted P ≤ .05). JAK2V617F vs HV (light blue), CALR vs HV (gray), and TN vs HV (red); all samples adjusted for subtype vs HV (purple). The χ2 test reflects the significance of the overlap between DEGs of each comparison with the adjusted comparison. (B) Volcano plot of all genes, comparing all ET samples vs HV samples (adjusted). A total of 528 genes (gold) are significantly downregulated and 310 genes upregulated (purple). (C) Heatmap showing the clustering of samples based on their expression of the 838 DEGs. The gold bar highlights the downregulated genes and the purple bar highlights the upregulated genes in the ET samples. (D) Enrichment plot showing the activated (purple) and deactivated (gold) functional annotations as determined by IPA analysis. X-axis displays the activation Z score; the higher the score, the greater the activation, with a negative score indicating deactivation. Circle size is based on the –log10 P value for the enrichment of each annotated term. All terms have an enrichment P value <3.4e-03. (E) Ranked plot of the gene expression values for all genes involved in activated terms derived from IPA. The x-axis represents each gene. The y-axis is the mean log2(CPM +0.5) expression for each gene in the ET cohort (purple) and the HVs (gold). The plot centers around the ranked expression of each gene in the HV (from highest to lowest expression). The size of each red point represents the –log10 adjusted P value for how significantly differentially expressed the gene is in the ET cohort vs the HV cohort. The shaded background represents the gene expression quantiles (green = upper quantile [Q3 + Q4], yellow = mid/low quantile [Q2], red = lowest quantile [Q1]). (F) Boxplots illustrating the qPCR results, comparing the mean –delta cycle threshold (CT) vs reference gene for the HV samples (gold), all ET samples (purple), CALR samples (pink), JAK2 samples (blue), and TN samples (red). The purple bar plot illustrates the significance of the difference between the HV and the ET cohort as a whole as determined by a Student t test. The –log10 P value is used here; thus, the higher the bar, the more significant the difference to HV. *Probes used for these 3 genes may detect genomic DNA.](https://ash.silverchair-cdn.com/ash/content_public/journal/bloodadvances/5/4/10.1182_bloodadvances.2020003172/2/m_advancesadv2020003172f1.png?Expires=1767746859&Signature=XIoE~~gG314jm68qoElgurn9USSJVqzpXI961e3Cn0AUQQRUXoCJDciAm-O58VwgM09mITCw3MwHGDrYqk~lLs7GSOzgeb8NoskzB-99IrTDLJo0F4sVta~QK4q35pmDUhkZht28H90UlzfFI4Eogn~2ItcWA0OjyS6TpzOmMStG7t3SV8hW4WU6cpKHsbDZGVf4HLGOpJbt6VsygJo5wfwZeRfv55~rxE6-aDmwqe7DpmJPw5gXkSlW95SAk35GvRWkzXfuMwuE9ocGEEduB~vfMGLI0lt5ul7xM1i583kmncGulNZPfaMI1GbTMsVTowssNVO467GqY5aplXziAg__&Key-Pair-Id=APKAIE5G5CRDK6RD3PGA)
Processing of RNA-sequencing data to establish genes with altered expression and significant pathways. (A) Venn diagram illustrating the overlap of DEGs identified across each ET subtype vs HV (control) (adjusted P ≤ .05). JAK2V617F vs HV (light blue), CALR vs HV (gray), and TN vs HV (red); all samples adjusted for subtype vs HV (purple). The χ2 test reflects the significance of the overlap between DEGs of each comparison with the adjusted comparison. (B) Volcano plot of all genes, comparing all ET samples vs HV samples (adjusted). A total of 528 genes (gold) are significantly downregulated and 310 genes upregulated (purple). (C) Heatmap showing the clustering of samples based on their expression of the 838 DEGs. The gold bar highlights the downregulated genes and the purple bar highlights the upregulated genes in the ET samples. (D) Enrichment plot showing the activated (purple) and deactivated (gold) functional annotations as determined by IPA analysis. X-axis displays the activation Z score; the higher the score, the greater the activation, with a negative score indicating deactivation. Circle size is based on the –log10 P value for the enrichment of each annotated term. All terms have an enrichment P value <3.4e-03. (E) Ranked plot of the gene expression values for all genes involved in activated terms derived from IPA. The x-axis represents each gene. The y-axis is the mean log2(CPM +0.5) expression for each gene in the ET cohort (purple) and the HVs (gold). The plot centers around the ranked expression of each gene in the HV (from highest to lowest expression). The size of each red point represents the –log10 adjusted P value for how significantly differentially expressed the gene is in the ET cohort vs the HV cohort. The shaded background represents the gene expression quantiles (green = upper quantile [Q3 + Q4], yellow = mid/low quantile [Q2], red = lowest quantile [Q1]). (F) Boxplots illustrating the qPCR results, comparing the mean –delta cycle threshold (CT) vs reference gene for the HV samples (gold), all ET samples (purple), CALR samples (pink), JAK2 samples (blue), and TN samples (red). The purple bar plot illustrates the significance of the difference between the HV and the ET cohort as a whole as determined by a Student t test. The –log10 P value is used here; thus, the higher the bar, the more significant the difference to HV. *Probes used for these 3 genes may detect genomic DNA.
Processing of RNA-sequencing data to establish genes with altered expression and significant pathways. (A) Venn diagram illustrating the overlap of DEGs identified across each ET subtype vs HV (control) (adjusted P ≤ .05). JAK2V617F vs HV (light blue), CALR vs HV (gray), and TN vs HV (red); all samples adjusted for subtype vs HV (purple). The χ2 test reflects the significance of the overlap between DEGs of each comparison with the adjusted comparison. (B) Volcano plot of all genes, comparing all ET samples vs HV samples (adjusted). A total of 528 genes (gold) are significantly downregulated and 310 genes upregulated (purple). (C) Heatmap showing the clustering of samples based on their expression of the 838 DEGs. The gold bar highlights the downregulated genes and the purple bar highlights the upregulated genes in the ET samples. (D) Enrichment plot showing the activated (purple) and deactivated (gold) functional annotations as determined by IPA analysis. X-axis displays the activation Z score; the higher the score, the greater the activation, with a negative score indicating deactivation. Circle size is based on the –log10 P value for the enrichment of each annotated term. All terms have an enrichment P value <3.4e-03. (E) Ranked plot of the gene expression values for all genes involved in activated terms derived from IPA. The x-axis represents each gene. The y-axis is the mean log2(CPM +0.5) expression for each gene in the ET cohort (purple) and the HVs (gold). The plot centers around the ranked expression of each gene in the HV (from highest to lowest expression). The size of each red point represents the –log10 adjusted P value for how significantly differentially expressed the gene is in the ET cohort vs the HV cohort. The shaded background represents the gene expression quantiles (green = upper quantile [Q3 + Q4], yellow = mid/low quantile [Q2], red = lowest quantile [Q1]). (F) Boxplots illustrating the qPCR results, comparing the mean –delta cycle threshold (CT) vs reference gene for the HV samples (gold), all ET samples (purple), CALR samples (pink), JAK2 samples (blue), and TN samples (red). The purple bar plot illustrates the significance of the difference between the HV and the ET cohort as a whole as determined by a Student t test. The –log10 P value is used here; thus, the higher the bar, the more significant the difference to HV. *Probes used for these 3 genes may detect genomic DNA.
From our adjusted analysis comparing all ET patients vs HVs, a total of 838 differentially expressed genes (DEGs; adjusted P <.05) (Figure 1B) were identified. Clearly, these genes define a gene set that could distinguish ET from HV in this cohort (Figure 1C). We also recognized that the disease-modifying nature of interferon treatment may affect gene expression patterns; however, sample clustering highlighted no anomalies (supplemental Figure 1A,H). We performed an additional differential analysis comparing patients with and without interferon and could not show any significant differences in gene expression profiles (supplemental Figure 1I-J).
Ingenuity pathway analysis (IPA) of the 838 DEGs highlighted upregulated genes were enriched for genes critical for myeloid cell differentiation and proliferation, specifically activation of megakaryopoiesis and oncogenic signatures (Figure 1D; supplemental Figure 2A). The converse was also true (ie, enrichment for thrombocytopenia among downregulated genes). Notable upregulated DEGs included ITGB3, ITGA2B, ITGA7, GP1BB, FAXDC2, SPI1 (PU.1), TAL1, TGFB1, and CSF2RB; their mean expression levels are displayed in Figure 1E.
To understand the potential molecular pathways that may be driving the expression of these proliferative genes critical for megakaryopoiesis, functional enrichment was performed using the KEGG database. This analysis revealed that upregulated DEGs were enriched for several proliferative and inflammatory pathways, including JAK-STAT, tumor necrosis factor (TNF), NFκB, and MAPK pathways (P < .001) (supplemental Figure 2B-C). Regarding proliferative pathways, key downstream targets of these pathways, including the TFs JUN, JUND, and CCAAT enhancer binding protein β (CEBPβ), were also upregulated.
These data suggest that regardless of disease subtype, ET converges onto similar gene expression profiles, which potentially drive the disease phenotype. To test this theory in an independent cohort, we processed previously published gene expression array data (described in the supplemental Methods) from a mixed ET cohort (n = 20) with HVs (n = 20).12 Directly comparing the ET samples vs the HV samples, we identified that 32 of the upregulated genes delineated in our analysis were also significantly upregulated in this cohort. Among the overlapping genes were key inflammatory genes: FAXDC2, ITGA2B, ITGA7, FOSL2, and ITGA2B (supplemental Figure 2D).13
To gain further validation of the gene expression profile differences observed between the ET patients and HVs, RT-qPCR was performed on an additional 20 independent patients with ET (9 JAK2V617F positive, 7 CALR positive, and 4 TN) and six HVs (supplemental Table 1) on 20 candidate genes identified to have altered expression. The cycle threshold values for the 20 candidate genes (CEBPβ, ELK1, FAXDC2, FOSL2, GP1BB, GTPBP1, ITGA2B, ITGA7, ITGB3, JUN, JUND, KLF1, MAPKAPK2, MARCKS, NFκB2, PFKFB3, RELA, SPI1, TAL1, and TGFB1) are listed in supplemental Table 3. As shown in Figure 1F, all of the candidate genes had significantly higher expression in the patients with ET compared with the HVs, irrespective of mutation subtype.
Methylation profiling
We next explored whether the epigenetic landscape at the level of DNA methylation profiles differed among the patients with ET according to their mutation subtypes. The DNA methylation profiles of 25 TN ET patients, 4 JAK2V617F-mutated ET patients, and 3 CALR-mutated ET patients were determined by using the human methylation 850K array. Similar to their gene expression profiles, all ET samples, regardless of mutation subtype, shared highly correlated methylation profiles, with a median Pearson correlation of 0.98 (supplemental Figure 3A). Methylation profiles did not cluster on the basis of cytoreductive agent, age, sex, or white blood cell composition (supplemental Figure 3B). On average, 43% of cytosine guanine dinucleotides (CpGs) were hypermethylated and 25% were hypomethylated. As expected, gene promoters were predominantly hypomethylated, whereas gene bodies showed a methylation distribution similar to that of total CpGs (supplemental Figure 3C).14
For each patient sample, we aggregated promoter- or gene body–associated CpGs for each gene and explored regions that had consistently hypomethylated/hypermethylated CpGs across all ET patient samples for that gene. We found that 9611 genes had hypomethylated promoters and 71 genes had hypermethylated promoters; 33 genes had hypomethylated gene bodies and 159 genes had hypermethylated gene bodies (Figure 2A). As expected, correlation with gene expression profiling showed that genes with hypermethylated promoters had significantly lower expression than genes with either hypomethylated promotors or hypomethylated/hypermethylated gene bodies (Figure 2B; supplemental Figure 3D). Interestingly, however, genes identified as having a consistent hypomethylated/hypermethylated pattern at either their promoter of gene body had a significantly higher expression than genes without a clear hypomethylation/hypermethylation pattern. This was consistent for all patient samples in the RNA-sequencing cohort. Although the exact significance of gene body methylation remains unclear, gene body hypermethylation has been reported to be associated with increased gene expression.15,16
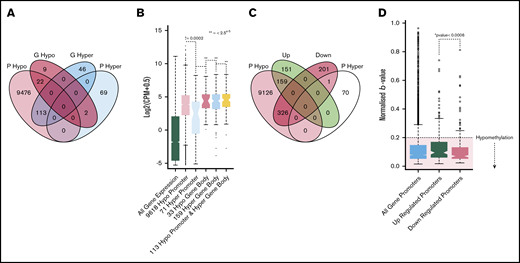
Methylation profiling of genes with altered expression. (A) Venn diagram illustrating the overlap of genes with hypomethylated or hypermethylated promoters and hypermethylated or hypomethylated gene bodies. (B) Boxplot showing the expression distributions of genes with different methylation patterns. From left to right, green indicates all genes; light red, 9618 genes with hypomethylated promoters; light blue, 71 genes with hypermethylated promoters; dark red, 33 genes with hypomethylated gene bodies; gray, 159 genes with hypermethylated gene bodies; and yellow, 133 genes with both hypomethylated promoters and hypomethylated gene bodies. *Indicates the Student t test P value when comparing each set vs the set with hypermethylated promoters (light blue). (C) Venn diagram shows the overlap of genes with hypomethylated or hypermethylated promoters and genes that were differentially expressed. (D) Boxplots of the β value distributions of all genes promoters (light blue), upregulated promoters (green), and downregulated promoters (red). The hypomethylated (β ≥ 0.2) region is highlighted by red shading. *The Student t test P value, determining the significance of the difference between up/downregulated promoter β values. Down, gene expression is downregulated in ET vs HVP; Up, gene expression is upregulated in ET vs HV; P hyper, promoter hypermethylated; P hypo, promoter hypomethylated.
Methylation profiling of genes with altered expression. (A) Venn diagram illustrating the overlap of genes with hypomethylated or hypermethylated promoters and hypermethylated or hypomethylated gene bodies. (B) Boxplot showing the expression distributions of genes with different methylation patterns. From left to right, green indicates all genes; light red, 9618 genes with hypomethylated promoters; light blue, 71 genes with hypermethylated promoters; dark red, 33 genes with hypomethylated gene bodies; gray, 159 genes with hypermethylated gene bodies; and yellow, 133 genes with both hypomethylated promoters and hypomethylated gene bodies. *Indicates the Student t test P value when comparing each set vs the set with hypermethylated promoters (light blue). (C) Venn diagram shows the overlap of genes with hypomethylated or hypermethylated promoters and genes that were differentially expressed. (D) Boxplots of the β value distributions of all genes promoters (light blue), upregulated promoters (green), and downregulated promoters (red). The hypomethylated (β ≥ 0.2) region is highlighted by red shading. *The Student t test P value, determining the significance of the difference between up/downregulated promoter β values. Down, gene expression is downregulated in ET vs HVP; Up, gene expression is upregulated in ET vs HV; P hyper, promoter hypermethylated; P hypo, promoter hypomethylated.
We next questioned if there were any methylation changes compared with HV PBMCs (n = 2). We identified 652 CpGs with significantly different methylation (adjusted P ≤ .01), of which 572 (80%) CpGs had increased methylation and 80 (20%) had decreased methylation in the ET cohort (supplemental Figure 4A). There was no significant overlap between genes with differential methylation and DEGs (χ2 > 0.5), with only 15 overlapping genes. This finding suggests that gene expression changes between ET and HV result primarily from DNA methylation–independent mechanisms.
We subsequently investigated the promoter methylation patterns of DEGs. A significant difference was observed in the median methylation between upregulated and downregulated gene promoters (Figure 2C). Interestingly, however, both upregulated and downregulated promoters were predominantly hypomethylated. Overall, 58% of the DEGs had consistently hypomethylated promoters, and almost none were hypermethylated (Figure 2D). Furthermore, the 58% of DEGs with hypomethylated promoters maintained enrichment for key genes involved in upregulated pathways uncovered in our RNA-sequencing analysis, including the TNF, MAPK, and platelet pathways. Overall, although promoter hypomethylation is consistently observed at upregulated DEGs, it does not appear that changes in DNA methylation alone can account for these changes in gene expression.
Transcriptional regulation by TFs
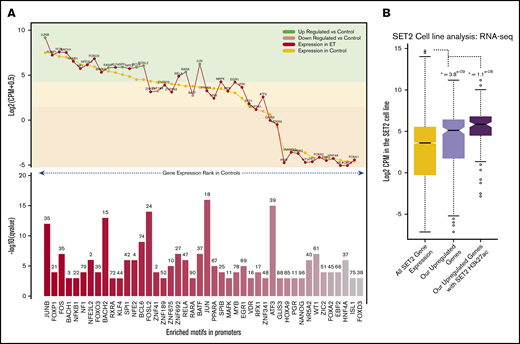
A fundamental aspect of gene regulation is by TFs and repressors. Thus, to explore the regulatory influence of TFs on the DEGs, the promoters of all upregulated DEGs were assessed for TF-binding motifs. There was a significant enrichment for many TFs involved in myeloid cell development, including RARA, PU.1, and several KLF genes (Figure 3A). Twenty-five of the enriched TFs were highly expressed in the ET cohort, with expression levels in the top quartile. A significant enrichment for TFs key in the NFκB, MAPK, and TNF pathways such as JUN, JUNB, FOSL2, RELA, and BCL6 were identified, all of which were upregulated in the ET cohort. Interestingly we also observed enrichment for RARA and its cofactor RXRA. Using this approach, several TFs were identified that could be driving the expression of genes leading to the ET phenotype.

Motif landscape at differentially expressed genes. (A) Plot describes the top 45 motifs enriched at the 310 upregulated gene promoters. The bottom bar plot illustrates the relative enrichment of each motif (–log10 q value), and the number on top of each bar is the percentage of promoters enriched with the motif. The top line plot illustrates the expression of each of the 45 motifs in the HV samples (control) (gold) and the ET population (red). Green dots indicate genes that are significantly upregulated vs HV, and pink dots indicate genes that are significantly downregulated vs HV (control). The highlighted color segments correspond to the expression quantiles (green = highest, yellow = medium, orange = low). (B) Boxplots illustrating the expression levels of genes in the SET-2 cell line. The gold box is the distribution of all SET-2 genes; the pink box is the SET-2 expression levels of the 310 upregulated genes in the ET cohort; and the purple box is the SET-2 expression levels of upregulated genes with high H3k27ac deposition at their promoters. *The Student t test P value when comparing each box vs the expression of all genes (gold box).
Motif landscape at differentially expressed genes. (A) Plot describes the top 45 motifs enriched at the 310 upregulated gene promoters. The bottom bar plot illustrates the relative enrichment of each motif (–log10 q value), and the number on top of each bar is the percentage of promoters enriched with the motif. The top line plot illustrates the expression of each of the 45 motifs in the HV samples (control) (gold) and the ET population (red). Green dots indicate genes that are significantly upregulated vs HV, and pink dots indicate genes that are significantly downregulated vs HV (control). The highlighted color segments correspond to the expression quantiles (green = highest, yellow = medium, orange = low). (B) Boxplots illustrating the expression levels of genes in the SET-2 cell line. The gold box is the distribution of all SET-2 genes; the pink box is the SET-2 expression levels of the 310 upregulated genes in the ET cohort; and the purple box is the SET-2 expression levels of upregulated genes with high H3k27ac deposition at their promoters. *The Student t test P value when comparing each box vs the expression of all genes (gold box).
To understand if these gene promoters are active and accessible to allow TF binding in an ET context, we interrogated publicly available RNA-sequencing and H3k27ac (acetylation) data in the SET-2 cell line.17,18 We first explored expression of the upregulated genes previously uncovered. Most upregulated genes have a high expression in the SET-2 cell line, with 63% in the upper expression quartile, which is significantly higher than average (Figure 3B). We also found that 42% of gene promotors have significant H3K27ac deposition, including ITGA2B, ITGB3, FOSL2, TAL1, JUND, and MAPK3 (supplemental Figure 5). Those genes with this active mark had a considerably higher expression overall. This suggests these promoters are highly active in this cell line and could be regulated through the TF-binding sites we identified.
Discussion
In keeping with the literature, WES and targeted sequencing facilitated the identification of canonical and noncanonical mutations in MPL and JAK2 in 22% (10 of 46) of our TN cohort. This included 2 of 10 patients harboring a somatic MPL mutation in exon 10 at positions W515R/G/S, all previously reported in patients with MPN.19 One patient had a mutation on exon 11 position R537W. The MPLR537W mutation is not widely described in ET; this missense mutation in MPL located within the cytoplasmic domain results in failure of JAK binding and signal transduction, and has been associated with congenital amegakaryocytic thrombocytopenia.20 We found MPL germline mutations in 3 patients: MPL P453R (n = 1) and MPL S505N (n = 2). The mutation on exon 9, position P453R is associated with the cytokine receptor domain and has not been previously detailed in ET. The germline mutation in S505N, a point mutation that leads to the loss of the inhibitory effect on the TPO genes, was identified in 2 patients in the study cohort and is well recognized in several kindreds.21 Four of 10 patients harbored the classic mutation JAK2V617F. No germline JAK2 mutations were identified in our cohort.
It is important to note that the absence of mutations does not exclude alternative disease drivers, as it is well established that WES cannot detect fusion oncogenes, mutations in regulatory sequences, or alterations in gene expression. To further characterize the remaining true TN cohort, we used RNA-sequencing to directly compare them with ET patients with known driver mutations and HVs. Significant correlations in gene expression were noted regardless of mutation status, and consistent differences were found between the ET patients and HVs. Consistent with the well-established “inflammatory” phenotype associated with MPN, we found upregulation of several pathways involved in hematopoiesis, inflammation, and immune regulation, specifically NFκB, MAPK, and TNF signaling, in parallel with upregulation of genes that drive megakaryopoesis.22
We identified 838 genes in ET patients that are consistently differentially expressed compared with HVs. Contrary to our expectation, however, ET gene expression profiles correlated highly with one another and did not cluster according to mutation subtypes. Indeed, this was also observed at an epigenetic level in terms of DNA methylation profiles, with no clustering based on mutation subtypes. This was validated further with RT-qPCR in an independent ET cohort, which exhibited significant upregulation of 20 key candidate genes in the ET population compared with HVs, irrespective of mutation subtype. Taken together, our systematic genetic and epigenetic profiling indicates that different driver mutations may activate similar molecular pathways that converge on a similar gene expression profile that ultimately results in the ET phenotype.
In our cohort, upregulation of genes associated with megakaryopoiesis, including ITGA2B and ITGB3, were identified. Such upregulation of ITGA2B and ITGB3 is in keeping with previous findings by Müller et al,23 who also described altered expression in an MPN population. The ITGA2B gene encodes the αIIb subunit (GPIIb) and is restricted to the megakaryocyte lineage, whereas the ITGB3 gene encodes β3 (GPIIIa) and occurs in many cell types as a component of the vitronectin receptor (αvβ3).24,25 Together, they form the GPIIb/IIIa complex, which is a platelet–platelet contact receptor for the clotting factors von Willebrand factor and fibrinogen in activated platelets, and initiates aggregation.25,26 The synthesis of GPIIb/IIIa occurs primarily in the megakaryocytes and is detectable at an early stage of maturation.27
As highlighted, upregulated DEGs displayed consistent promoter hypomethylation. The DEG promoter sequences were enriched for TF-binding motifs, including that of JUN family members. We identified that a large proportion of these gene promoters may be highly active and accessible to the TFs in an ET cell line (SET-2). The activating protein-1 TF family is made up of multiple Jun (cJun, JunB, and JunD) and FOS members. Activating protein-1, as with NFκB, regulates many of the inflammatory and immune pathways, functioning downstream of the MAPK pathway and resulting in essential cellular processes that include proliferation and differentiation.28
The JAK signal transducer, which has a central role in MPN pathogenesis, is critical for signaling of multiple cytokines and, in addition to STAT, leads to MAPK pathway activation with resultant dysregulation of cellular proliferation.29 Across this ET cohort, we reported the upregulation of genes downstream of the MAPK pathway that included MAP3K11, ELK1, NFκB, JUND, and JUN (supplemental Figure 2). We also observed an upregulation of the FAXDC2 gene, which has been recently implicated as a driver critical for megakaryopoiesis, acting through the activation of MAPK/extracellular signal-regulated kinase signaling.30 Moreover, we identified upregulation of NFκB, in parallel with the subunit RELA, which is the primary driver for inflammation and cell proliferation.31 In many cells, NFκB promotes a prosurvival state by enhancing the G1 phase to the S phase cell cycle progression and upregulating antiapoptotic proteins such as BCL2 and BCL-xl; however, in platelets, their functional relevance remains unclear.32-35
To our knowledge, this study is the first to use a systematic approach to TN ET patients in the evaluation of molecular, gene expression, and methylation profiles. We acknowledge that a potential weakness of our work is the absence of comparison with reactive thrombocytosis patients; this topic could be assessed in future studies. However, we are able to show that a proportion of TN ET patients have low-level canonical and noncanonical mutations in MPL and JAK2 genes. ET gene expression and DNA methylation profiles correlated highly with one another and did not cluster according to mutation subtypes. Thus, it is suggested that different driver mutations activate similar molecular pathways that converge on a similar gene expression profile (that includes upregulation of genes implicated in platelet proliferation such as ITGA2B and ITGB3), which ultimately results in the development of ET. We speculate that this gene expression profile may be regulated by JUN family TFs, downstream of NFκB, MAPK, and TNF signaling. We hence provide an insight into the transcriptional and epigenetic regulation of ET and identify putative underlying molecular pathways that should be investigated further for the potential for therapeutic targeting.
The data reported in this article have been deposited in the Gene Expression Omnibus database (accession number GSE156547).
Acknowledgments
The authors thank all the patients and HVs who participated in this study. The authors extend a special thanks to the Cangen group for their support throughout the project.
Authorship
Contribution: S.A. designed the study, collected and processed samples, conducted experiments, analyzed data, and wrote the manuscript; W.V. analyzed data and contributed to writing of the manuscript; R.D. oversaw experimental design, processed samples, and contributed to the manuscript; M.S., A.S., P.L., and K.M. performed data analysis; P.C. performed data analysis and contributed to the manuscript; M.R., A.K., J.K.-C., S.O., and B.B.P. processed samples; D.R. contributed patients to the study; C.W. and Y.F. performed sample collection; S.K. contributed to the manuscript; G.M. supervised the project; D.P.M. and C.N.H. supervised the project and contributed to writing the manuscript; and all authors read and approved the submitted manuscript.
Conflict-of-interest disclosure: C.N.H. reports funded research from Novartis; speaker fees from Novartis, Janssen, CTI, Celgene, and Medscape; and advisory board membership for Incyte, CTI, Sierra Oncology, Novartis, Celgene, Roche, AOP pharma, Geron, and AstraZeneca. D.P.M. reports speaker fees and advisory board memberships with Novartis, Celgene, and Jazz Pharmaceuticals. S.K. reports research grants from Celgene and Novartis; and speaker honorarium from Alexion. The remaining authors declare no competing financial interests.
Correspondence: Samah Alimam, Department of Haematology, 4th Floor, Southwark Wing, Guy’s and St. Thomas’ NHS Foundation Trust, Great Maze Pond, London SE1 9RT, United Kingdom; e-mail: samah.alimam@nhs.net; and Claire N. Harrison, Department of Haematology, 4th Floor, Southwark Wing, Guy’s and St. Thomas’ NHS Foundation Trust, Great Maze Pond, London SE1 9RT, United Kingdom; e-mail: claire.harrison@gstt.nhs.uk.

![Processing of RNA-sequencing data to establish genes with altered expression and significant pathways. (A) Venn diagram illustrating the overlap of DEGs identified across each ET subtype vs HV (control) (adjusted P ≤ .05). JAK2V617F vs HV (light blue), CALR vs HV (gray), and TN vs HV (red); all samples adjusted for subtype vs HV (purple). The χ2 test reflects the significance of the overlap between DEGs of each comparison with the adjusted comparison. (B) Volcano plot of all genes, comparing all ET samples vs HV samples (adjusted). A total of 528 genes (gold) are significantly downregulated and 310 genes upregulated (purple). (C) Heatmap showing the clustering of samples based on their expression of the 838 DEGs. The gold bar highlights the downregulated genes and the purple bar highlights the upregulated genes in the ET samples. (D) Enrichment plot showing the activated (purple) and deactivated (gold) functional annotations as determined by IPA analysis. X-axis displays the activation Z score; the higher the score, the greater the activation, with a negative score indicating deactivation. Circle size is based on the –log10 P value for the enrichment of each annotated term. All terms have an enrichment P value <3.4e-03. (E) Ranked plot of the gene expression values for all genes involved in activated terms derived from IPA. The x-axis represents each gene. The y-axis is the mean log2(CPM +0.5) expression for each gene in the ET cohort (purple) and the HVs (gold). The plot centers around the ranked expression of each gene in the HV (from highest to lowest expression). The size of each red point represents the –log10 adjusted P value for how significantly differentially expressed the gene is in the ET cohort vs the HV cohort. The shaded background represents the gene expression quantiles (green = upper quantile [Q3 + Q4], yellow = mid/low quantile [Q2], red = lowest quantile [Q1]). (F) Boxplots illustrating the qPCR results, comparing the mean –delta cycle threshold (CT) vs reference gene for the HV samples (gold), all ET samples (purple), CALR samples (pink), JAK2 samples (blue), and TN samples (red). The purple bar plot illustrates the significance of the difference between the HV and the ET cohort as a whole as determined by a Student t test. The –log10 P value is used here; thus, the higher the bar, the more significant the difference to HV. *Probes used for these 3 genes may detect genomic DNA.](https://ash.silverchair-cdn.com/ash/content_public/journal/bloodadvances/5/4/10.1182_bloodadvances.2020003172/2/m_advancesadv2020003172f1.png?Expires=1767746860&Signature=pqKVQ~rs2UdnXRd1-ZDfWNN7XqNmQXxI2epM5BZ3ewrx2aO9qlc52MRV5Ay8dMSVZ9IohLR7~atD8tnMeksrDtBVbMqV6tqoiS91~afg9yGa03V0GCGo5QKyhs1hOSsLG3hGqiLEioHqvRatBOzVXxmcCIT5UI1Vgq26wDExzxpzbkzQye~IvHket91qLEz~4OycDNOUffrbjc4N-dAcds50ukloEz4ZZwKDmybsGxjyU7QaHYj473Q3dOn57vuSDGXYXmxvUIFolZ8IWwOI-cTcTfcI3U6kdJgw~e9KDpiQ6JzWqisT6tnj7lG1kbpmJWcKrAle9Yob8iBwT5OP6w__&Key-Pair-Id=APKAIE5G5CRDK6RD3PGA)