Key Points
A 3-parameter CCRS model was devised specifically for patients diagnosed with clonal cytopenia.
The CCRS offers precise CCUS risk assessment for patient management and clinical trial eligibility.
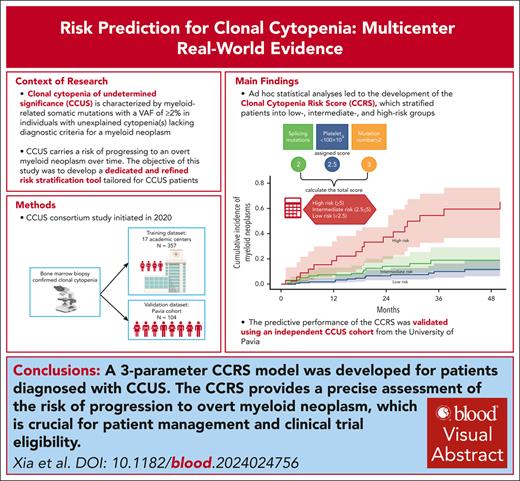
Visual Abstract
Clonal cytopenia of undetermined significance (CCUS) represents a distinct disease entity characterized by myeloid-related somatic mutations with a variant allele fraction of ≥2% in individuals with unexplained cytopenia(s) but without a myeloid neoplasm (MN). Notably, CCUS carries a risk of progressing to MN, particularly in cases featuring high-risk mutations. Understanding CCUS requires dedicated studies to elucidate its risk factors and natural history. Our analysis of 357 patients with CCUS investigated the interplay between clonality, cytopenia, and prognosis. Multivariate analysis identified 3 key adverse prognostic factors: the presence of splicing mutation(s) (score = 2 points), platelet count of <100 × 109/L (score = 2.5), and ≥2 mutations (score = 3). Variable scores were based on the coefficients from the Cox proportional hazards model. This led to the development of the clonal cytopenia risk score (CCRS), which stratified patients into low- (score of <2.5 points), intermediate- (score of 2.5 to <5), and high-risk (score of ≥5) groups. The CCRS effectively predicted 2-year cumulative incidence of MN for low- (6.4%), intermediate- (14.1%), and high-risk (37.2%) groups, respectively, by the Gray test (P < .0001). We further validated the CCRS by applying it to an independent CCUS cohort of 104 patients, demonstrating a c-index of 0.64 (P = .005) in stratifying the cumulative incidence of MN. Our study underscores the importance of integrating clinical and molecular data to assess the risk of CCUS progression, making the CCRS a valuable tool that is practical and easily calculable. These findings are clinically relevant, shaping the management strategies for CCUS and informing future clinical trial designs.
Introduction
In the fifth edition of the World Health Organization Classification of Haematolymphoid Tumors, clonal hematopoiesis (CH) of indeterminate potential (CHIP) was formally defined by the presence of a myeloid-associated somatic mutation in the blood or bone marrow, with a variant allele fraction (VAF) of ≥2% among individuals without a myeloid neoplasm (MN) diagnosis or unexplained cytopenia. If the patient has unexplained cytopenia(s), the condition is then diagnosed as clonal cytopenia of undetermined significance (CCUS).1 In addition, if the patient has an absolute monocyte count (AMC) of ≥0.5 × 10⁹/L, monocytes comprising ≥10% of white blood cell (WBC) differential, and no morphologic findings of chronic myelomonocytic leukemia (CMML) in the bone marrow, CHIP and CCUS are further defined as clonal monocytosis of undetermined significance (CMUS) and clonal cytopenia and monocytosis of undetermined significance (CCMUS), respectively. These classifications are based on the International Consortium Consensus Classification of Myeloid Neoplasms and Acute Leukemias.2
CHIP is recognized as an early precursor state for hematologic malignancy, with a low absolute risk of MN transformation (transformation occurs in 0.5%-1% of cases annually).3,4 However, CHIP is linked to an increased risk of various comorbidities, most notably cardiocerebrovascular diseases (CCVD).5-7 In contrast, CCUS presents a 10-fold higher likelihood of progressing to MN.8 Specific mutation patterns (including splicing mutations; comutations involving DNMT3A, TET2, or ASXL1; the number of mutations; and VAF) play a crucial role in both diagnosing MN and predicting disease progression.8,9
Recent advancements in CH research have led to the development of 2 risk stratification models, both of which leverage data from population-based studies using the UK Biobank. These models, the clonal hematopoiesis risk score (CHRS) and the MN-predict model, aim to enhance risk assessment in this context.10,11 The CHRS model incorporates as the presence of CCUS, mutation patterns, patient age, red blood cell indices, and other factors. Individuals with a CHRS of ≥12.5 were identified as high risk (P < .001), with a cumulative 5-year incidence of MN progression of 24%. In contrast, those with a CHRS between 10 and 12 (intermediate risk) exhibited a 5-year MN progression rate of 2.7%, and individuals with CHRS of <9.5 (low risk) had a notably lower rate of 0.23%.10 The MN-predict model uses genotype, phenotype, and biochemistry data to provide year-by-year probabilities (up to 15 years) for MN transformation.11
Recently, an increasing number of cases of CCUS have been identified via routine use of next-generation sequencing for cytopenia assessment.8,12-17 It is imperative to understand the risk factors and natural history of CCUS to effectively address its various clinical challenges. Notably, there is currently a lack of established standards of care for CCUS, low response rates (RRs) for existing therapies, and a pressing need to identify high-risk patients for enrollment in clinical trials aimed at effectively managing disease progression.
In this study conducted by the CCUS consortium, our objectives were to delineate the clinical and molecular characteristics of CCUS, examine the associations between clonality and cytopenias, and ascertain the prognostic significance of clonal cytopenia through both gene-specific and functional pathway analyses. Because of the limited data available regarding CCUS treatment,18 we also discuss treatment approaches and outcomes for a subgroup of patients who underwent therapy. This research resulted in the development of the clonal cytopenia risk score (CCRS) model for CCUS, a clinically relevant tool for patient risk stratification. The predictive performance of the CCRS was further validated using an independent CCUS cohort from the University of Pavia.
Methods
Patients
Written informed consent was obtained from all individual participants included in the study. The research protocol was approved by the medical ethical committee of the Mayo Clinic. The study is carried out in accordance with the Declaration of Helsinki. This CCUS consortium study was initiated in 2020 as a collaborative effort among 17 academic centers across the United States and Europe (supplemental Table 1, available on the Blood website). The primary objective was to collect real-world data from patients with clonal cytopenias. Inclusion criteria included adult age (≥18 years) and a bone marrow biopsy that did not meet diagnostic criteria for MN. Patients with cytopenia with a cytogenetic abnormality were included and their disease was categorized as CCUS unless a myelodysplastic syndrome (MDS)–defining cytogenetic abnormality was present (in accordance with the 2016 World Health Organization Classification of Haematolymphoid Tumors definitions), in which case the patient was excluded.1,19 Patients must not have received any prior therapy for clonal cytopenia at the time of CCUS diagnosis. Of our total cohort, a subgroup of 71 patients subsequently received treatments for cytopenia at the discretion of the treating physician.
Definitions
In our study, clonal cytopenia was defined as the presence of cytopenia(s), including anemia (hemoglobin [Hb] of <13 g/dL for males and <12 g/dL for females), leukopenia (absolute neutrophil count [ANC] of <1.8 × 10⁹/L), and thrombocytopenia (platelets [PLTs] of <150 × 109/L), that were accompanied by either MN-associated somatic mutation(s), non-MN–defining chromosomal abnormalities, or a combination of both. Additionally, we assessed patients experiencing Hb of <10 g/dL, PLT of <100 × 109/L, and/or ANC of <1 × 10⁹/L. Dependence on blood transfusion was defined as requiring an average of ≥2 units of packed red blood cells (RBCs) or PLTs over 4 weeks or ≥4 units over 8 weeks. RRs for patients who received treatment were determined using the 2006 International Working Group response criteria for MDS.20 Overall survival (OS) was calculated from the date of CCUS diagnosis to the date of death from any cause, and leukemia-free survival (LFS) was calculated from the time from CCUS diagnosis to disease progression to MDS, CMML, or acute myeloid leukemia.
Mutational data
Details of the mutational analysis and next-generation sequencing panels used across institutions are provided in the supplemental Material (gene panel). If the VAF was ≥2%, a somatic pathogenic variant call was counted in the analysis. A total of 63 unique somatic genes were identified. We evaluated each gene as well as genes grouped into functional pathways, including splicing, epigenetic regulation, transcriptional regulation, and signaling pathways (supplemental Table 2).
Statistical analyses
Continuous variables were presented as median values (interquartile range/range) and categorical variables as frequency values (percentages). Differences in the distribution of continuous variables between categories were compared by either the Mann-Whitney U or the Kruskal-Wallis test. Categorical variables were compared using χ2 or Fisher exact tests. Data were censored at the time patients were last known to be alive. The median point estimate and 95% confidence interval (CI) for follow-up time, OS, and LFS were estimated using the Kaplan-Meier method. Stepwise Cox proportional hazard analyses were conducted to evaluate the prognostic impact of diagnostic variables on OS and LFS in univariate and multivariable analyses. Optimal VAF cutoff points were determined using recursive partitioning algorithms to assess the variable’s relation to LFS.
An LFS predictive model was constructed by incorporating significant covariates identified in the multivariable analysis. The weight of each covariate was determined based on the coefficients derived from the Cox proportional hazard model. For clinical practice purposes, a modified model was developed by substituting continuous factors with optimal cutoff points. The cumulative incidence of MNs across the 3 risk groups was assessed using the Gray test. To validate the predictive efficacy of the current model, we used an external cohort that included 104 patients with CCUS (as proven through bone marrow biopsy) diagnosed at the University of Pavia. The model was validated using a receiver operating characteristic (ROC) curve, with the area under the ROC curve serving as a comprehensive metric for summarizing the model's performance. All P values were 2-sided, and statistical computations were conducted using R version 4.0.1.
Results
Baseline characteristics
A total of 357 patients with CCUS were enrolled over 2 years. The median age of the cohort was 70 years (range, 19-94), with 126 patients (35%) being female (Table 1). The most common comorbidity was a prior history of hematologic or oncologic diseases (n = 133 [37%]), followed by CCVD (n = 115 [32%]) and inflammatory diseases (n = 44 [12%]; supplemental Table 3).
Baseline characteristics for the entire cohort
| Characteristic . | Entire group (N = 357) . |
|---|---|
| Age, y, median (range) | 70 (19-94) |
| Sex, n (%) | |
| Female | 126 (36) |
| Male | 231 (63.9) |
| Body mass index, median (range) | 26.9 (16.8-60.2) |
| Smoking history, n (%) | |
| Current | 18 (5.0) |
| Former | 142 (39.8) |
| Never | 173 (48.5) |
| Unknown | 24 (6.7) |
| ECOG performance status score, n (%) | |
| 0 | 120 (33.6) |
| 1 | 156 (43.8) |
| 2 | 30 (8.4) |
| 3 | 3 (0.8) |
| Missing | 48 (13.5) |
| Laboratory values, median (IQR) | |
| Hb, g/dL, median (IQR) | 11 (9.4-12.7) |
| Patients with Hb of <10 g/dL; n (%) | 120 (33.6) |
| Mean corpuscular volume, fL, median (range) | 95.4 (90-102.4) |
| PLT, ×109/L, median (IQR) | 121 (78-198) |
| Patients with PLTs of <100 × 109/L, n (%) | 133 (37.3) |
| WBCs, ×109/L, median (IQR) | 3.60 (2.60-5.54) |
| ANC, ×109/L, median (IQR) | 1.91 (1.10-3.30) |
| Patients with ANC of <1 × 10⁹/L, n (%) | 25 (7.0) |
| AMC, ×109/L, median (IQR) | 0.4 (0.28-0.57) |
| Patients with CCMUS, n (%) | 97 (27.2) |
| Total no. of mutational variants | 592 |
| VAF, median (range) | 31.7% (3%-99.7%) |
| Mutations per patient, n (%) | |
| 0 | 39 (10.9) |
| 1 | 156 (43.7) |
| 2 | 86 (24.1) |
| >2 | 76 (21.3) |
| Median no. of mutations | 1 |
| Patients with cytogenetic abnormalities, n (%) | 79 (22.1) |
ECOG, Eastern Cooperative Oncology Group; IQR, interquartile range.
Cytopenia
One-third of the patients (n = 120 [34%]) had Hb of <10 g/dL; among these patients, 30 (25%) were RBC transfusion dependent. Overall, 130 patients (37%) had PLT of <100 × 109/L, and 24 (7%) had ANC of <1 × 10⁹/L. Additionally, 97 patients (27%) met the diagnostic criteria for CCMUS.
Somatic mutations and chromosomal alterations
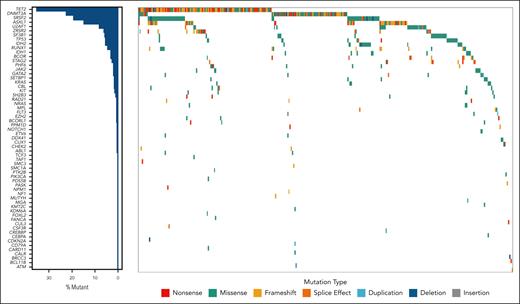
Within the cohort, 156 patients (44%) had only 1 mutation, whereas 162 (45%) had ≥2 mutations. Additionally, 39 (11%) patients’ diseases were categorized as CCUS based solely on cytogenetic abnormalities. In total, 592 variants were identified (supplemental Table 2), with the most prevalent mutations found in TET2 (n = 141 [24%]), DNMT3A (n = 77 [13%]), SRSF2 (n = 61 [10.3%]), ASXL1 (n = 49 [8.3%]), and U2AF1 (n = 27 [4.7%]; Figure 1). The median VAF was 31.7% (range, 3%-99.7%). Among 79 patients with cytogenetic abnormalities, −Y was the most frequent (n = 21 [26.6%]) abnormality, followed by trisomy 8 (n = 16 [20.3%]; supplemental Table 3).
The correlation between “clonality” and “cytopenia” in patients with clonal cytopenia
Among patients with Hb of <10 g/dL, including those who were dependent on RBC transfusions, mutations involving DNMT3A, TET2, or ASXL1 were the most frequent. In contrast, the most prevalent mutations among patients with PLT of <100 × 109/L and ANC of <1 × 10⁹/L were TET2, SRSF2, and ASXL1 (supplemental Figure 1). Overall, there was a trend showing that VAF correlated negatively with PLT (r = −0.1; P = .09) but positively with AMC (r = 0.11; P = .07). Detailed associations between VAF and cytopenia are provided in supplemental Figure 2.
Comparisons of subgroups of interest
CCMUS
Patients diagnosed with CCMUS (n = 97) tended to be older than non-CCMUS cases (median age, 70.3 vs 66.7 years; P = .02) and exhibited a male predominance (74% vs 61%; P = .045). In addition, they presented with higher WBC count (median, 5.0 × 10⁹/L vs 3.4 × 10⁹/L; P < .0001) and ANC (median, 2.7 × 10⁹/L vs 1.8 × 10⁹/L; P = .03). However, no significant differences were observed in Hb levels (median, 11.3 vs 10.9 g/dL; P = .08) or PLT (median, 120 × 109/L vs 122 × 109/L; P = .70).
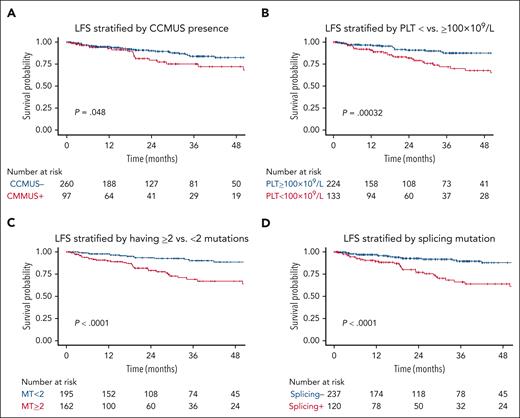
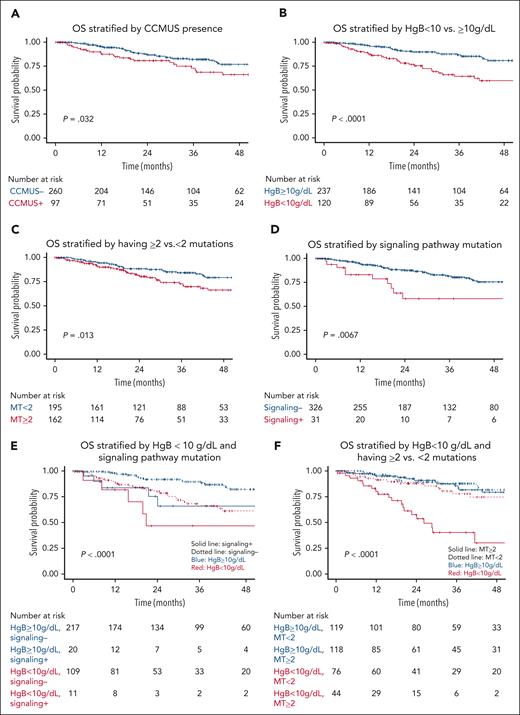
Among patients with CCMUS, 7 (7%) exhibited only cytogenetic abnormalities without any somatic mutations. The median VAF for these cases was 42.8% (range, 2.8%-99%). Of the 162 genetic variants identified, the most frequent mutations were in TET2 (n = 62 [38%]), SRSF2 (n = 28 [17%]), and ASXL1 (n = 18 [11%]). Supplemental Figure 3 shows the gene frequencies for patients with CCMUS vs those without. CCMUS was associated with inferior OS (hazard ratio [HR], 1.7; 95% CI, 1.04-2.82; P = .03) and LFS (HR, 1.8; 95% CI, 1.0-3.2; P = .05; Figures 2A and 3A). Seventeen patients (18%) experienced disease progression, with 9 developing CMML and 8 developing MDS.
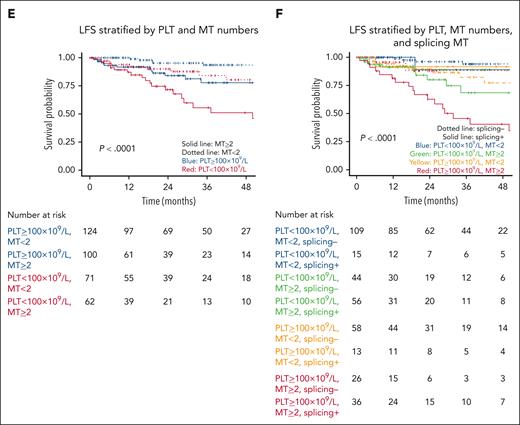
LFS. LFS (of N = 357) is stratified by (A) CCMUS; (B) PLT <100 × 109/L vs ≥100 × 109/L; (C) having <2 vs ≥2 mutations; (D) having a splicing pathway mutation; (E) Multivariable analysis including the variables of PLT <100 × 109/L vs ≥100 × 109/L and <2 vs ≥2 mutations (solid lines indicate having ≥2 mutations, dotted lines indicate mutation number <2, blue indicates PLTs of ≥100 × 109/L, and red indicates PLTs of <100 × 109/L); and (F) multivariable analysis including the variables of PLT count, having ≥2 mutations, and having a splicing pathway mutation (dotted lines indicate not having splicing mutations, solid lines indicate having splicing mutation, blue indicate PLTs of <100 × 109/L and MT <2, green indicate PLTs of <100 × 109/L and MT of ≥2, yellow indicate PLTs of ≥100 × 109/L and MT <2, and red indicate PLTs of ≥100 × 109/L and MT ≥2).
LFS. LFS (of N = 357) is stratified by (A) CCMUS; (B) PLT <100 × 109/L vs ≥100 × 109/L; (C) having <2 vs ≥2 mutations; (D) having a splicing pathway mutation; (E) Multivariable analysis including the variables of PLT <100 × 109/L vs ≥100 × 109/L and <2 vs ≥2 mutations (solid lines indicate having ≥2 mutations, dotted lines indicate mutation number <2, blue indicates PLTs of ≥100 × 109/L, and red indicates PLTs of <100 × 109/L); and (F) multivariable analysis including the variables of PLT count, having ≥2 mutations, and having a splicing pathway mutation (dotted lines indicate not having splicing mutations, solid lines indicate having splicing mutation, blue indicate PLTs of <100 × 109/L and MT <2, green indicate PLTs of <100 × 109/L and MT of ≥2, yellow indicate PLTs of ≥100 × 109/L and MT <2, and red indicate PLTs of ≥100 × 109/L and MT ≥2).
OS. OS (of N = 357) is stratified by (A) CCMUS; (B) Hb <10 vs ≥10 g/dL; (C) having ≥2 mutations; (D) having a signaling pathway mutation; (E) multivariable analysis including the variables of Hb <10 g/dL and having a signaling pathway mutation (solid lines indicate having a signaling pathway mutation, dotted lines indicate not having a signaling pathway mutation, blue indicates Hb ≥10 g/dL, and red indicates Hb <10 g/dL); and (F) multivariable analysis including the variables of Hb <10 g/dL and ≥2 mutations (solid lines indicate having ≥2 mutations, dotted lines indicate having <2 mutations, blue indicates Hb ≥10 g/dL, and red indicates Hb <10 g/dL).
OS. OS (of N = 357) is stratified by (A) CCMUS; (B) Hb <10 vs ≥10 g/dL; (C) having ≥2 mutations; (D) having a signaling pathway mutation; (E) multivariable analysis including the variables of Hb <10 g/dL and having a signaling pathway mutation (solid lines indicate having a signaling pathway mutation, dotted lines indicate not having a signaling pathway mutation, blue indicates Hb ≥10 g/dL, and red indicates Hb <10 g/dL); and (F) multivariable analysis including the variables of Hb <10 g/dL and ≥2 mutations (solid lines indicate having ≥2 mutations, dotted lines indicate having <2 mutations, blue indicates Hb ≥10 g/dL, and red indicates Hb <10 g/dL).
History of hematologic or oncologic diseases
Within the subset (n = 133) of patients with a history of hematologic or oncologic diseases, 67 (50%) had solid tumors, 71 (53%) had hematologic disorders other than MN, and 6 (5%) had both. Patients with CCUS and solid tumors were older than those with CCUS but no solid tumors (median, 74 vs 67 years; P < .001). In contrast, patients with CCUS and hematologic disorders were younger than those without such disorders (median, 67 vs 70.5 years; P = .016) and had lower Hb levels (median, 10.4 vs 11.3 g/dL; P = .03) and PLT counts (median, 98 × 109/L vs 127 × 109/L; P = .03; supplemental Table 4). Mutation analysis revealed that TET2 mutations were the most frequent in patients with CCUS and solid tumors (36%; median VAF, 9.5%), whereas DNMT3A mutations predominated among those with CCUS and hematologic disorders (28%; median VAF, 9.5%). In terms of survival outcomes, patients with coexisting nonmyeloid hematologic disorders exhibited similar LFS (HR, 0.56; 95% CI, 0.24-1.31; P = .18) and OS (HR, 1.13; 95% CI, 0.63-2.01; P = .68) as those without such disorders. However, although patients with solid tumors showed similar LFS (HR, 0.73; 95% CI, 0.33-1.64; P = .45), they had significantly worse OS (HR, 1.93; 95% CI, 1.14-3.27; P = .01; supplemental Table 5; supplemental Figures 4 and 5).
In total, 66 (50%) patients who had a history of other malignant tumors or nonmyeloid hematologic disorders had received prior therapy, such as chemotherapy, radiation therapy, or both. These patients were categorized as having treatment-related CCUS (t-CCUS). For all patients with t-CCUS, a diagnosis of t-MN was excluded, as no evidence of MN was found in their bone marrow. When comparing t-CCUS to non–t-CCUS subgroups, patients with t-CCUS were older (aged 72 vs 66.7 years; P = .003) but showed no differences in Hb, PLT, ANC, or mutation count. The frequency of TP53 mutations (n = 1 [2%]) was low, and no PPM1D mutations were identified. However, cytogenetic abnormalities were more common in the t-CCUS group than in the non–t-CCUS group (n = 22 [33.3%] vs 58 [20%]; P = .02). Patients with t-CCUS experienced inferior OS compared with those who had never received prior therapy (HR, 2.35; 95% CI, 1.41-3.92; P = .001). However, there were no significant differences in LFS between the t-CCUS and non–t-CCUS subgroups (HR, 0.79; 95% CI, 0.35-1.77; P = .057; supplemental Figure 6).
CCVD
Compared with patients without CCVD, patients with CCVD demonstrated a tendency toward lower Hb levels (median, 9.8 vs 11.6 g/dL; P = .0002), higher ANC (median, 2.3 × 10⁹/L vs 1.8 × 10⁹/L; P = .04), higher AMC (median, 0.5 × 10⁹/L vs 0.4 × 10⁹/L; P = .005), and inferior OS (HR, 2.50; 95% CI, 1.54-4.05; P = .0002). However, there was no significant difference in LFS or mutational patterns between the 2 groups (supplemental Figure 7).
Inflammatory diseases
Between patients with and without a history of inflammatory disease, there were no significant differences in clinical or molecular features in our analyses (supplemental Figure 8).
Prognostic factors for outcomes
The median follow-up duration was 27.3 months (range, 0-191.4), during which 47 patients (13%) experienced disease progression to MN; among these patients, 30 (64%) experienced progression to MDS, 15 (32%) to CMML, and 2 (4%) to acute myeloid leukemia. Sixty-six patients (18%) died from various causes. The estimated 2-year OS was 85.4% (95% CI, 81.4-89.7), and the 2-year LFS was 87.4% (95% CI, 83.4-91.5; supplemental Figure 9). Notably, the 2-year LFS for patients with cytogenetic abnormalities but without somatic mutations was 83.7% (95% CI, 71.2-98.4). Among patients with disease progression, the median time to progression was 17.1 months (range, 1-51.6).
LFS
In the univariable analyses, PLT of <100 × 109/L (HR, 2.81; 95% CI, 1.56-5.06; P <.001) was associated with shorter LFS (Figure 2B), whereas Hb of <10 g/dL (HR, 0.67; 95% CI, 0.34-1.32; P = .4) and ANC of <1 × 10⁹/L (HR, 1.34; 95% CI, 0.48-3.76; P = .57) showed no significant associations. The presence of ≥2 mutations was significantly associated with shorter LFS (HR, 3.74; 95% CI, 2.0-7.01; P < .0001; Figure 2C).
In the functional pathway analyses, mutations in splicing pathways were associated with shorter LFS (HR, 3.61; 95% CI, 2.0-6.49; P < .001; Figure 2D), whereas mutations in the epigenetic regulator (HR, 1.81; 95% CI, 0.94-3.50; P = .08), transcriptional (HR, 1.07; 95% CI, 0.48-2.38; P = .88), and signaling (HR, 1.51; 95% CI, 0.6-3.83; P = .2) pathways were not. In the analysis of individual genes, TET2 (HR, 3.29; 95% CI, 1.82-5.86; P <.001), SRSF2 (HR, 3.81; 95% CI, 2.13-6.83; P = .001), and ZRSR2 (HR, 3.19; 95% CI, 1.43-7.12; P = .002) were associated with shorter LFS. DNMT3A mutations were associated with a lower risk of disease transformation than the absence of a DNMT3A mutation (HR, 0.18; 95% CI, 0.04-0.76; P = .02). The impact of individual genes on LFS is shown in supplemental Figure 10A.
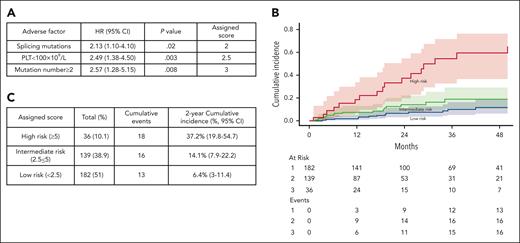
In multivariable analyses, PLT of <100 × 109/L (HR, 2.49; 95% CI, 1.38-4.50; P = .003), splicing pathway mutations (HR, 2.13; 95% CI, 1.10-4.10; P = .02), and having ≥2 mutations (HR, 2.57; 95% CI, 1.28-5.15; P = .008) retained their significance in predicting LFS (Figure 2E-F).
OS
In the univariable analyses, Hb of <10 g/dL was associated with inferior OS (HR, 2.63; 95% CI, 1.62-4.27; P < .001; Figure 3B), whereas PLT of <100 × 109/L (HR, 1.34; 95% CI, 0.82-2.17; P = .24) and ANC of <1 × 10⁹/L (HR, 1.01; 95% CI, 0.41-2.52; P = .98) were not associated with OS. Having ≥2 mutations was associated with inferior OS (HR, 1.9; 95% CI, 1.1-3.3; P = .02; Figure 3C). Additionally, older age was associated with a lower OS rate (HR, 1.03; 95% CI, 1.01-1.06; P = .003).
In functional pathway analyses, mutations in signaling pathways were associated with inferior OS (HR, 2.47; 95% CI, 1.26-4.85; P = .009; Figure 3D), whereas mutations in splicing (HR, 1.59; 95% CI, 0.97-2.59; P = .06), epigenetic regulator (HR, 0.93; 95% CI, 0.57-1.54; P = .79), and transcriptional pathways (HR, 1.1; 95% CI, 0.56-2.16; P = .78) were not associated with OS. In the analysis of individual genes, ASXL1 (HR, 2.5; 95% CI, 1.42-4.39; P = .001) and SRSF2 (HR, 2.31; 95% CI, 1.37-3.91; P = .01) mutations were associated with inferior OS; DNMT3A (HR, 0.70; 95% CI, 0.35-1.42; P = .51) and TET2 (HR, 0.99; 95% CI, 0.59-1.66; P = .96) mutations were not associated with OS. The impact of individual genes on OS is shown in supplemental Figure 10B.
In multivariable analyses adjusted for anemia, mutations in signaling pathway (HR, 2.32; 95% CI, 1.18-4.56; P = .01) and having ≥2 mutations (HR, 2.24; 95% CI, 1.36-3.68; P = .001) were independent risk factors for OS (Figure 3E-F).
Correlation between VAF and LFS or OS
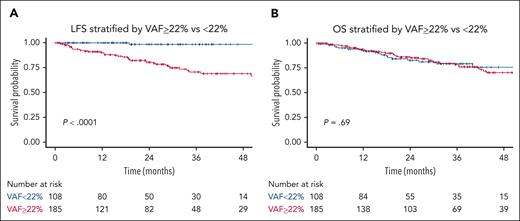
We used a probability-based recursive partitioning algorithm to stratify our data according to the likelihood of MN incidence and identified an optimal VAF cutoff point of 22%. However, this cutoff did not correlate with OS as shown in Figure 4A-B.
CCRS system
Given that PLT of <100 × 109/L, having ≥2 mutations, and the presence of splicing pathway mutations were identified as significant risk factors for LFS, they were selected as diagnostic variables to construct a model for LFS prediction named Clonal Cytopenia Risk Score (CCRS) system. The weighted score for each factor is detailed in Figure 5A. Patients were categorized into 3 groups based on their CCRS score: low risk (score, <2.5), intermediate risk (score, 2.5 to <5), and high risk (score, ≥5). The 2-year cumulative incidence of MN progression was 6.4% (95% CI, 3-11.4) for low-risk, 14.1% (95% CI, 7.9-22.2) for intermediate-risk, and 37.2% (95% CI,19.8-54.7) for high-risk groups by the Gray test (P < .0001) (Figure 5B-C).
CCRS. Prognostic models for (A) multivariate analysis parameters and assigned score for LFS; (B) The 2-year cumulative incidence of MN progression based on CCRS: 6.4% (95% CI, 3-11.4) for low-risk, 14.1% (95% CI, 7.9-22.2) for intermediate-risk, and 37.2% (95% CI, 19.8-54.7) for high-risk groups by the Gray test (P < .0001). (C) The number of patients within each category, cumulative MN events, and 2-year cumulative incidence.
CCRS. Prognostic models for (A) multivariate analysis parameters and assigned score for LFS; (B) The 2-year cumulative incidence of MN progression based on CCRS: 6.4% (95% CI, 3-11.4) for low-risk, 14.1% (95% CI, 7.9-22.2) for intermediate-risk, and 37.2% (95% CI, 19.8-54.7) for high-risk groups by the Gray test (P < .0001). (C) The number of patients within each category, cumulative MN events, and 2-year cumulative incidence.
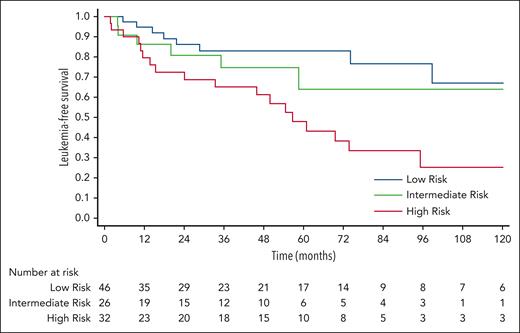
To assess the predictive performance, we validated the model using an independent cohort (n = 104). The baseline characteristics of the Pavia CCUS cohort are summarized in supplemental Table 5. The median follow-up duration for this cohort was 4.2 years (range, 0.5-15.1). According to the CCRS model, 46 (44%) patients were low risk, 26 (25%) were intermediate risk, and 32 (31%) were high risk. Overall, the CCRS model significantly stratified LFS (P = .005) in this validation cohort, accompanied by a progressive increase of HRs; intermediate vs low risk (HR, 1.6; 95% CI, 0.55-4.62; P = .39); high vs low risk (HR, 3.57; 95% CI, 1.56-8.18; P = .003; Figure 6). The ROC analysis revealed a c-index of 0.64 (95% CI, 0.54-0.73; P = .005).
Validation. The CCRS model significantly stratified LFS in the Pavia cohort (P = .005). Using low-risk group as a reference group, the HR for intermediate vs low risk (HR, 1.6; 95% CI, 0.55-4.62; P = .39) and high vs low risk (HR, 3.57; 95% CI, 1.56-8.18; P = .003).
Validation. The CCRS model significantly stratified LFS in the Pavia cohort (P = .005). Using low-risk group as a reference group, the HR for intermediate vs low risk (HR, 1.6; 95% CI, 0.55-4.62; P = .39) and high vs low risk (HR, 3.57; 95% CI, 1.56-8.18; P = .003).
Notably, a predictive model with the variables of VAF of ≥22%, PLT of <100 × 109/L, and having ≥2 mutations significantly stratified our data for LFS. However, upon validation, the predictive performance using these 3 variables was not superior to using the combination of PLT count, mutation number, and presence of splicing mutations. Furthermore, considering the inherent variation in VAF measurement, it was excluded from the predictive model.
Treatment outcomes
Our cohort included 71 patients who subsequently received various treatments for clonal cytopenia, including 28 individuals who received >1 treatment. Recognizing these treatments are not known to alter the natural history of the disease, we included these patients in our study to avoid biases in developing prognostic models. Growth factors (n = 56 [79%]) were commonly used as a treatment, although only 32% of patients experienced improved cytopenia, 14% had worsening cytopenia, and 7% initially responded before their cytopenia worsened. Vitamin supplementation (n = 28 [39%]; RR, 31%), immunosuppressive therapy (n = 17 [24%]; RR, 47%), and steroids (n = 9 [13%]; RR, 29%) were also used but demonstrated only modest improvements. A subset of patients received decitabine (n = 4 [6%]) or azacitidine (n = 5 [7%]), with 1 patient experiencing a disease response in each group (supplemental Figure 11).
Discussion
We conducted a comprehensive analysis of real-world data from 357 patients with clonal cytopenia across 17 academic centers to elucidate the impact of clonality and cytopenia on disease risk and progression. Leveraging these insights, we developed the CCRS, a dedicated and refined risk stratification tool tailored for patients with CCUS. This innovative model is particularly suited for academic settings given the characteristics of our cohort. We propose the integration of the CCRS into clinical practice and its incorporation into the design of future clinical trials.
The CCRS model offers a streamlined approach, integrating only 3 key parameters: PLT of <100 × 109/L, having ≥2 mutations, and the presence of a splicing mutation. It categorizes patients into 3 distinct risk strata, each of which is associated with significantly different progression risks. This model was then validated using an external CCUS cohort and showed that CCRS demonstrated a robust ability to effectively stratify the population, excelling in identifying high-risk patients.
In summary, the simplified CCRS presents the potential for straightforward integration into clinical practice, aiding health care providers in consultations. Furthermore, because clinical trials are developed to evaluate high-risk CCUS, our model can serve as a crucial tool for identifying trial-eligible patients, filling a notable gap in the field.
Notably, VAF of ≥22% appeared to signify an increased risk of progression, and integrating this VAF threshold with PLT count and mutation number of ≥2 provided additional stratification of our data for LFS. However, upon validation, this combination’s predictive performance did not surpass that of PLT count, mutation number, and the presence of splicing mutations. This outcome likely resulted from a considerable number of patients in the Pavia cohort having high VAF and a high number of mutations while maintaining PLT counts above 100 × 109/L. Additionally, because of the inherent variation in VAF measurement (eg, measurement of VAF may be influenced by fluctuations in WBC count when measured from the peripheral blood), it was excluded from the final predictive model. Integrating VAF into risk-predictive models requires further validation.
An additional objective was to further elucidate the significance of the term “CCUS.” Previous investigations have indicated that patients with an isolated DNMT3A mutation are less likely to experience disease progression, whereas those with splicing and MN-like mutations are more susceptible to progression9,10; our findings align with these observations. Notably, SRSF2 and U2AF1 emerged as highly mutated genes in our cohort. Furthermore, our analysis revealed a trend of correlation between mutational VAF and blood counts across multiple genes, as well as the predictive value of specific mutation pathways and their impact on cytopenias and outcomes. These findings underscore the value of integrating both clinical and molecular information to enhance the precision of CCUS prognostication. In addition, Hb of <10 g/dL was linked to reduced OS. Given that anemia is recognized as an independent risk factor for mortality in MN 21 and improvement in Hb is a key criterion in the MDS response criteria for treated patients,22 our data lays the foundation for shaping future CCUS trials, particularly in refining clinical trial inclusion criteria and establishing CCUS-specific response criteria, such as hematologic improvement.
Two previous studies have presented outcomes for patients with CMUS, but there are currently no available data on CCMUS.12,13 This study contributes to the existing knowledge by conducting an analysis of CCMUS, revealing that clinical and molecular patterns were similar between CCMUS and CMML.23 Patients with CCMUS experienced inferior LFS and OS compared with those in the non-CCMUS group, underscoring the importance of recognizing CCMUS as a precursor entity.
We further reported the impact of extrinsic factors on clonal structure. Mutation patterns are context dependent, with various selection pressures and microenvironments influencing clone composition and propagation. Factors such as prior cancer therapies or myelosuppressive stress play a crucial role in shaping the clonal landscape; in particular, CH arising after cancer therapy is strongly associated with mutations in DNA damage response genes, such as TP53 and PPM1D.24-27 In our cohort, we observed distinct mutation patterns between solid tumors and hematologic diseases that were potentially influenced by age bias, because patients with solid tumors tended to be older in this cohort. This aligns with a prior study of the natural history of CH, in which age was a significant factor in TET2 clone growth and the prevalence of TET2 mutations was higher at older ages, eventually exceeding the prevalence of DNMT3A mutations.28 Although we did not identify an enrichment of DNA damage response mutations in patients with t-CCUS, we did observe a higher prevalence of cytogenetic abnormalities (33%), which was consistent with prior findings.29 Given the profound oncogenic potential and adverse outcomes associated with t-CCUS, early diagnosis is crucial and proactive measures are necessary.
Finally, we sought to address the distinct challenge of managing CCUS, with no current standard of care established.7,18,30-32 In our study, the RRs to existing therapies were reported to be modest. The absence of effective treatments for CCUS highlights a critical unmet medical need. Developing innovative therapeutic strategies to delay or prevent disease progression, as well as alleviate associated cytopenias, is essential to improve patient outcomes.
One notable characteristic of the current cohort is that all CCUS cases were sourced from academic centers and diagnoses were confirmed through bone marrow biopsy. Given the referral patterns of academic centers, this cohort may potentially represent a high-risk population, because patients may have been referred to these centers because of severe cytopenia while seeking health care in the community setting. Notably, this study constitutes 1 of the largest CCUS cohorts to date, distinguishing it from prior studies that encompassed patients with CHIP, idiopathic cytopenia, or myeloid malignancies.8-10 As a result, the newly developed CCRS model can effectively identify patients with CCUS who are at the highest risk for disease progression. Patients identified as high risk should undergo closer monitoring and be prioritized for enrollment in clinical trials.
Our study is subject to several limitations. First, it was a retrospective analysis and subject to all related limitations. Second, although all CCUS diagnoses were confirmed through bone marrow biopsy, the absence of a central review for biopsy slides introduces a potential limitation; additionally, there may be variability in how hematopathologists evaluate morphologic dysplasia in the bone marrow. Third, the lack of uniformity in sequencing platforms across institutions and the inability to confirm germ line mutations in some cases are additional constraints. Fourth, our study population is solely comprised of patients receiving care at academic centers, potentially indicating a more advanced disease stage. Fifth, the relatively short follow-up duration in this study raises the possibility of lead time bias, emphasizing the need for future studies with extended follow-up periods.
Conclusion
We systemically investigated the clinical and laboratory characteristics of individuals with clonal cytopenias. A 3-parameter CCRS model was devised specifically for patients diagnosed with CCUS. The implementation of the CCRS presents significant clinical relevance, offering precise risk stratification that can guide patient management and assist in eligibility assessment for forthcoming clinical trials, formulation of response criteria, and furthering research to address the pressing unmet need for novel therapeutics to treat CCUS.
Acknowledgments
The authors thank all the centers for providing the data and collaboration. Editorial assistance was provided by the Moffitt Cancer Center’s Office of Scientific Publishing by Daley White and Gerard Hebert; no compensation was given beyond their regular salaries.
This study was supported by the Small Grant Fellowship Award from the Mayo Clinic (Mayo Center for Clinical and Translational Science [CCaTS] grant number UL1TR000135). L.M. was supported by the Cancer Research UK (CRUK), United Kingdom, Associazione Italiana per la Ricerca sul Cancro (AIRC), Italy, and Fundacion Científica-Asociacion Espanola Contra el Cancer (FC-AECC), Spain, under the International Accelerator Award Program (project numbers C355/A26819 and 22796). Collection of data at the Fred Hutchinson Cancer Center (H.J.D) was supported by the Seattle Translational Tumor Research (STTR) program at Fred Hutchinson Cancer Center.
Authorship
Contribution: Z.X. and A.A.-K. designed the study, contributed cases, and wrote the manuscript; Z.X., A.R., and S.G. performed the statistical analysis; C.E., J.F., A.G., S.P., and L.M. provided the independent external cohort to validate our study model; and all other authors contributed to the data collection, reviewed, and provided edits to subsequent versions of the manuscript.
Conflict-of-interest disclosure: R.K. reports receiving grant support from Bristol Myers Squibb (BMS); speaker bureau fees from AbbVie, Cell Therapeutics, Inc (CTI) BioPharma, Jazz Pharmaceuticals, Pharma Essentia, and Servio; and advisory board fees from AbbVie, BMS, CTI BioPharma, Geron, Jazz Pharmaceuticals, Novartis, Taiho, and Rigel Pharmaceuticals. A.P. received research funding from Pfizer and Kronos Bio; and received honoraria from BMS and AbbVie. E.A.G. has received honoraria for advisory board membership from AbbVie, Alexion Pharmaceuticals, Apellis, Celgene/BMS, CTI, BioPharma, Genentech, Novartis, PicnicHealth, Takeda Oncology, and Taiho Oncology; has received research funding from Astex Pharmaceuticals, AstraZeneca Rare Disease, Alexion Pharmaceuticals, Apellis Pharmaceuticals, Blueprint Medicines, and Genentech Inc; and received honoraria for Continuing Medical Education activities from Physicians’ Educational Resource, MediCom Worldwide, American Society of Hematology, and Aplastic Anemia and Myelodysplasia Syndrome (AAMDS) International Foundation. H.E.C. has received honoraria for advisory board memberships from AbbVie, Celgene/BMS, Genentech, Jazz Pharmaceuticals, Novartis, and Daiichi Sankyo; has received research funding from Celgene; has served on speakers bureau for BMS, Jazz Pharmaceuticals, Novartis, and Stemline Therapeutics; and has served on data safety monitoring boards for Astex, AbbVie, Takeda, and Syndax. A.M.B. received consulting or advisory board honoraria from Novartis, Acceleron, Agios, AbbVie, Takeda, Celgene/BMS, Keros Therapeutics, Taiho, and Gilead; and has research support from the National Institutes of Health Specialized Programs of Research Excellence (SPORE) in Myeloid Malignancies and the Edward P. Evans Foundation. A.M.Z. received research funding (institutional) from Celgene/BMS, AbbVie, Astex, Pfizer, MedImmune/AstraZeneca, Boehringer Ingelheim, Cardiff Oncology, Incyte, Takeda, Novartis, Aprea, and Antibody Drug Conjugates (ADC) Therapeutics; participated in advisory boards, and/or had a consultancy with, and received honoraria, from AbbVie, Otsuka, Pfizer, Celgene/BMS, Jazz Pharmaceuticals, Incyte, Agios, Boehringer Ingelheim, Novartis, Acceleron, Astellas, Daiichi Sankyo, Cardinal Health, Taiho, Seattle Genetics, BeyondSpring, Cardiff Oncology, Takeda, Ionis, Amgen, Janssen, Epizyme, Syndax, Gilead, Kura, Chiesi, ALX Oncology, BioCryst, Notable, Orum, and Tyme; and served on clinical trial committees for Novartis, AbbVie, Gilead, BioCryst, ALX Oncology, Geron, and Celgene/BMS. E.P. received honoraria from Stemline Therapeutics, Taiho, and Blueprint; and research funding from BMS, Incyte, Kura, and Syntrix Pharmaceuticals. Y.F.M. received honoraria/consulting fees from Blueprint Medicines, Geron, OncLive, and MD Education; participated in advisory boards and received honoraria from Sierra Oncology, Stemline Therapeutics, Blueprint Medicines, MorphoSys, Taiho Oncology, Rigel Pharmaceuticals, and Novartis; and received travel reimbursement from Blueprint Medicines, MD Education, and MorphoSys. J.F.Z. received honoraria from advisory boards from AbbVie, BMS, Daiichi Sankyo, Genentech, Gilead, Immunogen, Servier, and Shattuck Labs; reports consultancy for AbbVie, Foghorn, Gilead, Sellas, and Servier; and received research funding from AbbVie, Arog, Astex, Gilead, Jazz, Loxo, Merck, Newave, Shattuck Labs, Stemline Therapeutics, Sumitomo Dainippon Pharma, and Takeda. A.S. received research funding from, and serves on the advisory board for Rigel Pharmaceuticals. C.C.C. received consulting or advisory board honoraria from AbbVie, AstraZeneca, BeiGene, Genentech, MEI Pharma, TG Therapeutics, Janssen, Novartis, MingSight, Octapharma, and Lilly/Loxo; serves on an independent review committee for Octapharma; serves on steering committees for AbbVie and Lilly/Loxo; has equity in CTI Biopharma and bluebird bio; serves on speakers bureaus for AbbVie, Genentech, BeiGene, and AstraZeneca; and has received research support (to institution) from AbbVie and Lilly/Loxo. The remaining authors declare no competing financial interests.
Correspondence: Zhuoer Xie, Department of Malignant Hematology, H. Lee Moffitt Cancer Center, Tampa, FL 33612; email: zhuoer.xie@moffitt.org; and Aref Al-Kali, Division of Hematology, Acute Leukemia and Myeloid Neoplasms Group, Mayo Clinic, Rochester, MN 55905; email: alkali.aref@mayo.edu.
References
Author notes
Presented in poster form at the 63rd annual meeting of the American Society of Hematology, Atlanta, GA, 11 December 2021, and at the 64th annual meeting of the American Society of Hematology, New Orleans, Louisiana, 10 December 2022.
Original data are available on request from the corresponding author, Zhuoer Xie (zhuoer.xie@Moffitt.org).
The online version of this article contains a data supplement.
There is a Blood Commentary on this article in this issue.
The publication costs of this article were defrayed in part by page charge payment. Therefore, and solely to indicate this fact, this article is hereby marked “advertisement” in accordance with 18 USC section 1734.

This feature is available to Subscribers Only
Sign In or Create an Account Close Modal