

Key Points
Genome sequencing of FL identifies genetic features that are rare in DLBCL.
A classifier based on coding and noncoding mutations divides FL into subgroups predictive of HT.

Abstract
Follicular lymphoma (FL) accounts for ∼20% of all new lymphoma cases. Increases in cytological grade are a feature of the clinical progression of this malignancy, and eventual histologic transformation (HT) to the aggressive diffuse large B-cell lymphoma (DLBCL) occurs in up to 15% of patients. Clinical or genetic features to predict the risk and timing of HT have not been described comprehensively. In this study, we analyzed whole-genome sequencing data from 423 patients to compare the protein coding and noncoding mutation landscapes of untransformed FL, transformed FL, and de novo DLBCL. This revealed 2 genetically distinct subgroups of FL, which we have named DLBCL-like (dFL) and constrained FL (cFL). Each subgroup has distinguishing mutational patterns, aberrant somatic hypermutation rates, and biological and clinical characteristics. We implemented a machine learning–derived classification approach to stratify patients with FL into cFL and dFL subgroups based on their genomic features. Using separate validation cohorts, we demonstrate that cFL status, whether assigned with this full classifier or a single-gene approximation, is associated with a reduced rate of HT. This implies distinct biological features of cFL that constrain its evolution, and we highlight the potential for this classification to predict HT from genetic features present at diagnosis.
Introduction
Follicular lymphoma (FL) is an indolent cancer that accounts for ∼20% of all new lymphoma diagnoses in adults.1,2 The highest incidence rates are reported in the United States and Western Europe, whereas FL is less common in Eastern Europe, Asia, and developing countries.3-5 FL predominantly affects adults, with a median age at diagnosis ranging from 60 to 65 years.6,7 Although patients diagnosed with FL generally experience long-term survival (median overall survival of >15 years),4 some eventually experience progressive disease and 8% to 15% undergo histologic transformation (HT) to aggressive diffuse large B-cell lymphoma (DLBCL),8,9 a process that is currently unpredictable and poorly understood at the molecular level. Because FL is generally a manageable cancer until patients experience HT, there is an unmet need for methods to identify patients at higher risk of this event.
Genetic analysis of FL has identified many significantly mutated genes (SMGs) affected by driver mutations and aberrant somatic hypermutation (aSHM). There is a considerable overlap of shared drivers between FL and DLBCL.10,11 Some subsets of FL, such as BCL2-negative and pediatric cases, also have distinct genetic repertoires.12,13 A series of studies have sought to identify genetic changes associated with transformation, often through comparisons of FL with transformed FL (tFL).8,9,14-19 Individually, these studies used small patient cohorts and/or restrictively targeted approaches. Abnormalities affecting TP53, MYC, and CDKN2A, genes involved in NF-κB signaling are frequently acquired between diagnosis and transformation. The presence of such mutations suggests that specific acquired genetic features promote the HT process, but it remains unclear whether the risk of HT is also influenced by mutations present at diagnosis.20-25
The existence of considerable genetic heterogeneity at the gene expression26,27 and genetic levels28-30 is well established in DLBCL. This has led to the establishment of a new system of molecular subtyping that relies on both genetic and gene expression features. Similar efforts have recently been applied to Burkitt lymphoma,31 mantle cell lymphoma,32 and FL.19 FL classification through genetics is an emerging area but the number of subgroups and relevant genetic or biological features remain unresolved. A recent study used genetic features derived from panel-based sequencing to divide FL cases into 3 genetic subgroups, relying on a combination of driver mutations (eg, STAT6 and CREBBP) and aSHM features.33 None of the subgroups described in that study were found to be associated with risk of transformation. Such work highlights the potential for genetic heterogeneity within adult FL yet leaves unanswered questions regarding the role of rare variants and noncoding mutations including genome-wide aSHM in HT. Comprehensive classification models that stratify FLs based on distinct biological underpinnings and that predict clinical risk factors such as HT could improve prognostics and open avenues to explore targeted therapies.
Some attempts have been made to integrate both clinical and molecular features to enhance FL prognostication. The Follicular Lymphoma International Prognostic Index (FLIPI)6 was integrated with genetic features into the m7-FLIPI model34 but its prognostic value varies between studies35,36 and it is not able to predict HT. More recently, early clinical events, such as progression or relapse within 2 years after diagnosis (POD24),37-39 were reported to predict shorter overall survival and have been suggested as an end point for clinical decision making. Importantly, neither m7-FLIPI nor POD24 can stratify patients based on a risk of subsequent transformation, and therefore the prognostic markers of HT remain of further interest to decrease patient risk and diversify treatment opportunities.
Here, we comprehensively analyzed whole-genome sequencing (WGS) data from 423 patients with DLBCL or FL (with and without transformation) to survey structural variants, copy number variants (CNVs), and simple somatic mutations (SSMs). We identified 88 SMGs displaying variable frequency across analyzed groups. Using the diagnostic FL samples, a random forest (RF) classifier was trained to distinguish de novo DLBCL from FL, and this identified 2 genetic subgroups within FL. The constrained FL group (cFL) is highly enriched for missense mutations in the lysine acetyltransferase (KAT) domain of CREBBP, as well as mutations in RRAGC, ATP6AP1, and ATP6V1B2, and was less likely to undergo HT. In contrast, the remaining DLBCL-like FL (dFL) are further characterized by increased rates of aSHM and higher risk of transformation. These findings provide utility for identifying patients at the highest risk of transformation.
Methods
WGS of FL and DLBCL
Our analysis included a compendium of WGS of 443 tumors representing 423 patients, all with matched normal genomes. We included DLBCLs from several previously published studies,40-42 with 186 (45%) of the genomes from the MMML-seq project43 and 92 newly sequenced genomes from patients in British Columbia, Canada. We also included FL and tFL genomes from a previous study of the genetics of FL transformation.9 Unpublished genomes were sequenced using the same approach as previously described41 and were assessed for sufficient sequencing depth as previously described.44 The patients with WGS data (Table 1) were split into a discovery cohort, representing cases with definitive pathology (de novo DLBCL) and FL with no recorded transformations (no-HT), and a comparison cohort, comprising composites and diagnostic samples from patients with FL who subsequently experienced HT (post-HT; Figure 1A). Supplemental Table 1, available on the Blood website, provides details for all genomes, including coverage statistics.

Oncogene translocations in FL. (A) Translocations involving oncogenes in FL and DLBCL genomes. The frequency is shown relative to the total number of tumors within each group. (B-C) Proportion of tumors with BCL2 (B) and MYC (C) translocations in the paired pre- and post-HT genomes. (D) Circos plots showing the MYC translocation partners in the paired pre- and post-HT genomes. The color of the breakpoint represents an individual patient.
Oncogene translocations in FL. (A) Translocations involving oncogenes in FL and DLBCL genomes. The frequency is shown relative to the total number of tumors within each group. (B-C) Proportion of tumors with BCL2 (B) and MYC (C) translocations in the paired pre- and post-HT genomes. (D) Circos plots showing the MYC translocation partners in the paired pre- and post-HT genomes. The color of the breakpoint represents an individual patient.
WGS and RNA sequencing analysis
Mutations and SMGs were detected as previously described.31 The coding SSMs identified using this approach are provided in the supplemental Table 2 and the CNVs are provided in the supplemental Table 3. Detailed procedures for mutation detection and RNA sequencing analysis are detailed in the supplemental Materials and Methods. The presence of any nonsilent SSMs in a gene was considered in comparisons of the mutation frequency for individual genes between FL and DLBCL. Genes with significant mutation differences were identified using Fisher exact test with multiple test correction using the Benjamini-Hochberg method.
Construction of feature matrix for machine learning
A binarized matrix for RF classification was created using an approach similar to our previous study.31 Briefly, nonsilent SSMs were tabulated for individual SMGs, and recurrent mutations within hotspots and other regions determined to be significantly enriched for mutations by OncodriveCLUSTL (Q value cutoff of 0.1) were counted separately. These include a region in FOXO1, MYD88L265P, EZH2Y646, MEF2B, and STAT6 and missense mutations around CREBBP KAT domain. Among 88 curated aSHM targets (average length, 12 Kbp; supplemental Table 4), only those determined to be differentially mutated between FL and DLBCL and covered in the capture panel from Kridel et al were included (Wilcoxon rank sum test with multiple test correction using the Benjamini-Hochberg method).9 For the 19 aSHM features, we first calculated the median number of mutations across the region in all DLBCLs. A sample was considered positive for aSHM when the number of mutations in this region was at least 3 above the median.
RF classification model
To perform genetic subgroup discovery, we used the feature set constructed as described earlier. Our discovery cohort included diagnostic biopsies from 195 de novo DLBCL, defined as patients with DLBCL with no prior indolent disease, and 184 no-HT FL, defined as patients with no recorded transformation during the follow-up period. Genetic subgroups derived from this comparison were then explored within 25 pre-HT FL cases (those with a known subsequent transformation), 21 post-HT DLBCL (tFL), and 18 composite (COMFL) tumors with morphology consistent with both FL and aggressive disease. The RF classifier training data only included mutations from 1 biopsy per patient from de novo DLBCL and no-HT diagnostic FL biopsies (total of 379 tumors, supplemental Table 1). The R randomForest package (version 4.6-14) was used with the following nondefault parameters: seed = 42, importance = TRUE, na.action = "drop," mtry = 3. Based on the optimal Youden Index point, a tumor was defined as cFL if the confidence of its label as FL was >0.8, otherwise it was classified as dFL.
Results
Structural variation in FL
We identified structural variants and annotated all translocations occurring near the oncogenes MYC, BCL2, and BCL6 along with the translocation partner locus. We compared the representation of these oncogenic rearrangements between the FL cohort and de novo DLBCLs (Figure 1A). Overall, in no-HT FLs, the proportion of BCL2-translocated tumors was 0.86 and was significantly higher in both pre- and no-HT FLs than that in de novo DLBCL (30.1%, P < .001; Fisher exact test). All paired pre-HT and post-HT tumors were concordant for BCL2 translocations by both fluorescence in situ hybridization and exact breakpoint identified by WGS, consistent with the origin of BCL2 translocations during variable diversity joining recombination in early B-cell development (Figure 1B). Translocations of BCL6 were more abundant among DLBCLs compared with no-HT FLs (28.2% and 14.7% respectively, P = .002; Fisher exact test) but with comparable rates between pre-HT (25%; n = 5 of 20 and post-HT (35%; n = 7 of 20) FLs (P = .73; Fisher exact test).
MYC translocations to an immunoglobulin gene or other partner were less common among no-HT and pre-HT FLs and had similar frequencies across DLBCL and post-HT FLs (Figure 1A). Within the group of patients having data from paired tumors before and after transformation (Figure 1C), we noted significant increase in the frequency of MYC translocations after HT (P = .001; Fisher exact test). Both observations are consistent with reports that acquisition of mutations deregulating MYC are a feature of HT.9 The single MYC-translocated pre-HT tumor harbored a translocation involving the DMD locus, 1 of the many documented nonimmunoglobulin translocation partners45 (Figure 1D), and the paired post-HT tumor from this patient has a discordant MYC-IGH translocation. The remaining post-HT tumors, in which MYC rearrangements were more common, had a variety of partners also consistent with those seen in de novo DLBCL, namely BCL6, PAX5, and LRMP.42,45
The genetic relationship and distinctions between FL and DLBCL
FLs share many genetic features with DLBCL, in particular with the germinal center B cell–like (GCB) cell of origin and the EZB/C3 genetic subgroups. We hypothesized that a meta-analysis of FL and DLBCL whole genomes could help identify a more complete set of recurrently mutated and driver genes in both diseases. To test this, we first identified all SMGs using all WGS cases including FL, COMFL, and DLBCLs. This enabled the curation of an extensive set of 88 SMGs, many of which have significantly different mutation rates between DLBCL and FL (Figure 2A; supplemental Table 7). We noted that CREBBP exhibits different mutation patterns between these entities (Figure 2B), with 60.4% (n = 84 of 139) of CREBBP mutations in FL being missense mutations in the KAT domain. In contrast, in DLBCL only 25.6% (n = 10 of 39) of CREBBP mutations are missense KAT domain mutations, whereas 61% (n = 24 of 39) are nonsense, frame shift, or splice site mutations. As such, we have treated CREBBP KAT missense mutations separate from other CREBBP mutations throughout all subsequent analyses.

Coding mutations across FL and DLBCL. (A) Oncoplot depicting coding mutations at the SMGs in FL. (B) Mutation diagrams showing genetic variations of CREBBP in FL and DLBCL tumors. Mutations are colored based on their type. Each mutation is annotated with amino acid substitution. Patients with FL are shown as the top track of variants for each gene, and patients with DLBCL are shown below.
Coding mutations across FL and DLBCL. (A) Oncoplot depicting coding mutations at the SMGs in FL. (B) Mutation diagrams showing genetic variations of CREBBP in FL and DLBCL tumors. Mutations are colored based on their type. Each mutation is annotated with amino acid substitution. Patients with FL are shown as the top track of variants for each gene, and patients with DLBCL are shown below.
Overall, the burden of coding mutations was significantly higher in DLBCL compared with no-HT FLs (P < .001, Tukey honestly significant difference [HSD] test). Post-HT tumors had a higher number of coding mutations compared with no-HT (P < .001, Tukey HSD test) or pre-HT (P = .05, Tukey HSD test) FLs, implying that a higher mutation burden is a feature of transformed FL (supplemental Figure 1A). Considering all nonsilent mutations, 11 genes were significantly enriched for mutations in FL relative to de novo DLBCL (supplemental Table 7), including CREBBP (odds ratio [OR], 2.3; Q < 0.001), RRAGC (OR, 2.15; Q = 0.001), and ATP6V1B2 (OR, 2.28; Q = 0.003) (supplemental Figure 1B). The de novo DLBCLs were enriched for mutations in 45 genes including MYD88 (OR, 2.26; Q < 0.001), CD58 (OR, 2.79; Q = 0.003), HLA-B (OR, 2.79; Q = 0.003), and other genes associated with genetic subgroups of DLBCL other than EZB/C3 (supplemental Figure 1B; supplemental Table 7). GISTIC analysis for regions recurrently affected by CNVs identified deletions affecting CD58 (OR, 2.42; Q < 0.001) and amplifications encompassing MIR17HG (OR, 1.81; Q < 0.001) and FCGR2B (OR, 0.65; Q = 0.014) among the CNVs most strongly associated with DLBCL compared with FL (supplemental Figure 2; supplemental Table 8).
Restricting to GCB DLBCL, the subgroup that shares more genetic features with FL, we found that coding mutations in RRAGC, ATP6V1B2, and CREBBP remained significantly enriched in FL (OR, 1.95; Q = 0.02; OR, 2.37; Q = 0.033; and OR, 2.02; Q < 0.001, respectively; supplemental Figure 3A; supplemental Table 9). GCB DLBCL–associated genes included 4 of the 10 genes that had previously been associated with early FL progression, namely B2M, TP53, MYC, and SOCS19 (supplemental Table 9). A similar comparison of the mutation frequencies between FL and EZB DLBCL identified only CREBBP KAT missense mutations as significantly enriched in FL (supplemental Figure 3B; supplemental Table 10). As has previously been described,30 the striking genetic similarities between FL and EZB DLBCL are consistent with the hypothesis that these entities arise from similar precursor cell populations, and in some cases apparent de novo EZB DLBCL may even represent occult transformation from FL.
We separately compared the rate of mutations at genomic loci commonly affected by aSHM in DLBCL41 (supplemental Figure 4; supplemental Table 4). Although many of these sites showed evidence of aSHM among FL genomes, there was a tendency toward fewer mutations relative to DLBCLs (supplemental Figure 4A-B). A higher aSHM load in de novo DLBCL was also supported by significantly higher genome-wide signal for the mutational signature SBS9 compared with no-HT FL (supplemental Figure 4C). Within the no-HT FLs, no mutations were observed at the transcription start sites of MYC, IRF4, or GRHPR, and mutations were sparse at other common aSHM sites such as PIM1 and SGK1. Importantly, the observed difference in the aSHM burden between de novo DLBCL and no-HT FLs cannot be attributed to the difference in tumor purity, which was not significantly different across cohorts (supplemental Figure 4D). The pattern indicates that aSHM is an unappreciated feature of FL, but the regions affected by this process and the abundance of resulting mutations is variable.
Resolution of FL genetic subgroups
Having identified genes and aSHM regions specifically enriched in either FL or DLBCL, we investigated whether mutations in these regions could collectively inform on distinguishing features of FL biology. Working under the assumption that no-HT FL is the most distinct from de novo DLBCL, we developed a classifier to distinguish these 2 groups based on their mutation status within genes (n = 43), hotspots (n = 6), or aSHM regions (n = 19). This naive classifier assigned a probability that each tumor represented FL. Based on the distribution of this probability (Figure 3A) and the optimal Youden Index point, we selected a cutoff value of 0.8 to stratify FL. Using this cutoff, 97% (n = 189 of 195) of de novo DLBCLs were classified as DLBCL, indicating a high sensitivity for detecting tumors with DLBCL-like genetics (Figure 3A). Among no-HT FLs, 53% (n = 97 of 184) were classified as FL, but 47% (87 of 184) of tumors were classified as DLBCL. We named FLs in these 2 classes cFL and dFL. We then used the model to classify the remaining cases held out from training including the pre-HT and COM FLs. The pre-HTs were not enriched for dFL relative to the no-HT cases (P = .83, Fisher exact test) and the tFLs were almost entirely classified as dFL (Figure 3B-C).
Resolution of distinct subgroups with FL. (A) Definition of cFL and dFLs. The y-axis depicts the probability of a tumor to be classified as cFL based on the RF model. (B-C) show distribution of tumors between cFL and dFL for every lymphoma type. (D) Overview of coding mutations in newly discovered FL subgroups. (E) Forest plot of mutations with differential frequency between cFL and dFL. Displayed are only genes or aSHM sites significantly differentially enriched between cFL and dFL (q < 0.1; Fisher test with multiple test correction using Benjamini-Hochberg method). (F) Mutation counts at some aSHM target sites across DLBCL and genetic subgroups of FL. The star indicates significant differences compared with dFL. (G) Schematic representation of mutations across CREBBP in cFL (top) and dFL (bottom).
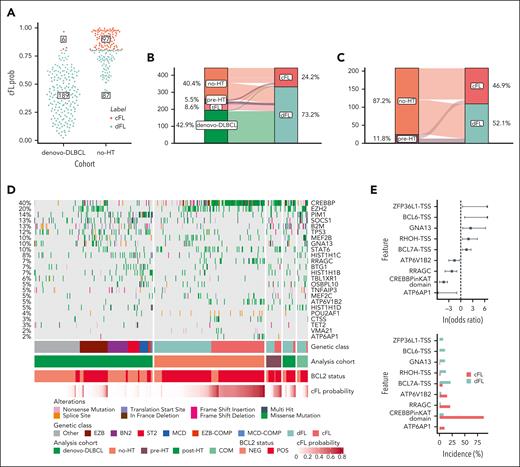
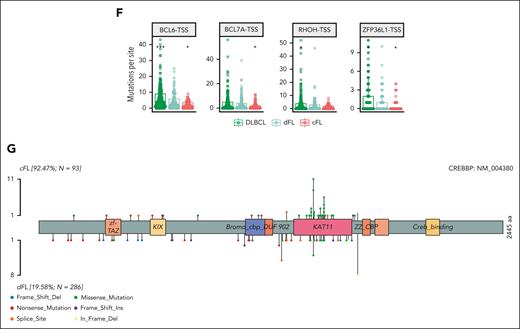
Because the model relies partly on coding mutations (Figure 3D), the dFL tumors resemble DLBCLs. In contrast, cFL had lower frequencies of mutations relative to DLBCL in histone H1 family members B (OR, 2.52; Q = 0.009), C (OR, 1.31; Q = 0.067), SOCS1 (OR, 1.7; Q = 0.003), and BTG1 (OR, 1.4; Q = 0.033), among others (supplemental Figure 5A; supplemental Table 11). Of note, the paucity of these mutations in cFL cannot be explained by tumor purities because there was no significant difference between subgroups (P = .86, Tukey HSD test; supplemental Figure 5B). The frequency of EZH2 mutations was not significantly different between dFL and cFL (OR, 0.26; Q = 0.726), which suggests that they share some potential therapeutic vulnerabilities. Overall, cFL is characterized by enrichment of mutations in ATP6AP1 (OR, Infinity; Q = 0.013), ATP6V1B2 (OR, 1.54; Q = 0.1), RRAGC (OR, 2.25; Q = 0.001), and CREBBP KAT domain missense mutations (OR, 4.3; Q < 0.001) relative to dFL (Figure 3E; supplemental Table 12). The dFL was characterized by a higher frequency of mutations across 3 aSHM loci (the transcription start sites of BCL6, BCL7A, RHOH, and ZFP36L1; Figure 3E-F; supplemental Table 12). When all mutations in regions affected by aSHM are considered rather than coding mutations, the mutation burden at these 3 aSHM loci was also significantly lower in cFL relative to dFL (Figure 3F). The importance of aSHM features in distinguishing these subgroups implies differential exposure to the germinal center reaction.
In addition, we investigated the relation of the CREBBP mutations, loss of heterozygosity (LOH), and the genetic subgroups. The CREBBP mutations were characterized by higher variant allele frequency when LOH was identified from copy-number profiles, and the difference compared with variant allele frequency in tumors without LOH was significant (P < .001, Wilcoxon test). We note that these events often cooccur, because 39.4% (n = 43 of 109) of tumors mutated in the CREBBP KAT domain also contained LOH events, whereas only 10.2% (n = 32 of 314) of tumors lacking this type of mutation had LOH at the CREBBP locus. This difference in distribution of LOH events in tumors with or without CREBBP KAT domain mutation was significant (P < .001, Fisher exact test).
Biological differences between FL genetic subgroups
To evaluate whether the cFL and dFL represent subgroups with other biological distinctions, we performed analyses on cases with additional available molecular data. Considering the strikingly different patterns of CREBBP mutations between de novo DLBCL tumors and FL stratified on genetic subgroup, we analyzed its expression in parallel with FOXP1, a prognostic biomarker in FL,46,47 and MYC, which was previously reported to be elevated in DLBCL harboring frameshift/nonsense mutations in the CREBBP KAT domain but not in FL with missense mutations48 (supplemental Table 13). Despite the significantly lower expression of CREBBP in DLBCL compared with dFL (P < .001, Tukey HSD test) and significant difference in its mutation pattern, we did not observe differential expression of CREBBP between the FL subgroups (Figure 4A, left panel). Expression of FOXP1 was significantly higher in cFL than in dFL (P < .01, Tukey HSD test; Figure 4A, middle panel). MYC messenger RNA levels were significantly lower in cFL (Figure 4A, right panel) relative to both DLBCL (P < .001, Tukey HSD test) and dFL (P = .04, Tukey HSD test), possibly suggesting a difference in the presence of cells undergoing germinal center reentry.

Novel genetic subgroups of FL are characterized by distinct biological features. (A) Expression of CREBBP, FOXP1, and MYC across tumors in de novo DLBCL and within FL cases in each subgroup. (B) Mutational signatures SBS1, SBS5, and SBS9, but not SBS8, are differentially enriched between cFL and dFL tumors.
Novel genetic subgroups of FL are characterized by distinct biological features. (A) Expression of CREBBP, FOXP1, and MYC across tumors in de novo DLBCL and within FL cases in each subgroup. (B) Mutational signatures SBS1, SBS5, and SBS9, but not SBS8, are differentially enriched between cFL and dFL tumors.
To further examine the role of different mutational processes among these classes, we quantified exposure to mutational signatures and compared exposure for all signatures that were detected in at least 20% of genomes (Figure 4B). Whereas SBS8 (associated with late replicating regions49) exposure was not significantly different between groups (Figure 4B, middle right panel), 2 clock-like signatures (SBS1 and 5) were significantly lower in cFL relative to DLBCL (P = .001 and P < .001, respectively, Wilcoxon test). SBS9, which has been attributed to SHM, is significantly depleted in cFL relative to both dFL and DLBCL (P < .001 for both, Wilcoxon test). This finding is consistent with the observation that differentially mutated aSHM loci are strong distinguishing features of cFL and dFL.
Validation of FL subgroup classification
To evaluate the clinical relevance of FL subgroups, we reanalyzed data from a collection of 334 FL tumors, which included 127 pre-HT FLs, 84 no-HT FLs, and 123 tFLs.9 Within the FL cases in this validation cohort, we found a similar distribution of cFL and dFL tumors (Figure 5A). Among the tFLs, 103 (83.7%) were classified as dFL (Figure 5A). Among the no-HT FLs, 47 (56.0%) were classified as cFL and 37 (44.0%) as dFL (Figure 5B). In striking contrast, the diagnostic tissues from patients with eventual transformation into DLBCL (pre-HT) were significantly more frequently classified as dFL (69.3%; n = 88 of 127) than cFL (30.7%; n = 39 of 127; OR, 2.85; P = .0003, Figure 4B) compared with no-HT FLs. This strong underrepresentation of cFL in cases that did not transform is consistent with the notion that cFL have a reduced propensity to undergo HT.

Validation of discovered FL subgroups in a separate cohort. (A-B) Distribution of samples between cFL and dFL for every sample. (C) Forest plot of mutations with differential frequency between cFL and dFL in the validation cohort. (D) Mutation burden at aSHM target sites across tumors in the validation cohort. The star indicates significant differences compared with dFL. (E) Immunohostochemistry results for FOXP1 and KI67 staining in the validation cohort. The star indicates significant differences compared with dFL. (F) The Kaplan-Meier curve showing the TTT (years) between cFL and dFL tumors in the validation cohort.
Validation of discovered FL subgroups in a separate cohort. (A-B) Distribution of samples between cFL and dFL for every sample. (C) Forest plot of mutations with differential frequency between cFL and dFL in the validation cohort. (D) Mutation burden at aSHM target sites across tumors in the validation cohort. The star indicates significant differences compared with dFL. (E) Immunohostochemistry results for FOXP1 and KI67 staining in the validation cohort. The star indicates significant differences compared with dFL. (F) The Kaplan-Meier curve showing the TTT (years) between cFL and dFL tumors in the validation cohort.
Consistent with the discovery cohort, the mutations in ATP6AP1 (OR, 0; Q = 0.016), RRAGC (OR, 0; Q < 0.001), ATP6V1B2 (OR, 0.239; Q = 0.06), and CREBBP KAT missense mutations (OR, 0.01; Q = 0.001) were significantly more abundant in cFL (Figure 5C; supplemental Figure 6), and the cFL tumors from the validation cohort had reduced numbers of mutations in regions associated with aSHM, namely BCL7A (Q = 0.034, Wilcoxon test) and BCL6 (Q = 0.025, Wilcoxon test), when compared with dFL (Figure 5D).
Corroborating the findings of the differential FOXP1 expression between FL subgroups in the training data, the immunohistochemistry staining of the 334 tumors from the validation cohort revealed higher FOXP1 staining in cFL compared with dFL (Figure 5E, top panel). Relative to cFL, dFL showed a significantly higher proliferation (P = .025, Wilcoxon test) measured by KI-67 scored using Aperio ScanScope XT system, suggesting a higher proliferation rate among dFL tumors (Figure 5E, bottom panel).
Although the existence of distinct genetic subgroups in FL has been proposed, neither of the preceding studies identified subgroups associated with transformation. To this end, we separately explored whether the cFL and dFL in our validation cohort had different clinical characteristics. Both genetic subgroups had comparable median patient age and a similar balance of sex (Table 2). The FLIPI scores and proportion of patients with POD24 were not significantly different between cFL and dFL, which might be because of selection bias of the validation cohort featuring the patients who eventually transform and is therefore not necessarily representative of cFL as a whole. However, significantly more patients with FL grade 3A were in the dFL subgroup (OR, 3.18; P = .020; Table 2). This is consistent with a previous report that CREBBP missense mutations, a feature of cFL, are more common among FL grade 1 and 2.50 In our validation cohort, which did not contain samples from any of the cases in our discovery cohort, the FL tumors classified as dFL were associated with a 10-year shorter median time to transformation (TTT) (Figure 5F).
Overview of the patients with FL included in this study
| No-HT (n = 184) | pre-HT (n = 25) | Overall (n = 209) | |
|---|---|---|---|
| Age, y | |||
| Mean (SD) | 59.8 (11.5) | 60.0 (13.2) | 59.8 (11.7) |
| Median (min, max) | 61.0 (33.0, 86.0) | 58.0 (36.0, 84.0) | 61.0 (33.0, 86.0) |
| Sex | |||
| Female | 91 (49.5%) | 11 (44.0%) | 102 (48.8%) |
| Male | 93 (50.5%) | 14 (56.0%) | 107 (51.2%) |
| FLIPI score | |||
| High | 33 (17.9%) | 6 (24.0%) | 39 (18.7%) |
| Low/intermediate | 62 (33.7%) | 7 (28.0%) | 69 (33.0%) |
| Missing | 89 (48.4%) | 12 (48.0%) | 101 (48.3%) |
| Grade | |||
| 1/2 | 174 (94.6%) | 19 (76.0%) | 193 (92.3%) |
| 3A | 9 (4.8%) | 6 (24.0%) | 15 (7.2%) |
| Missing | 1 (0.5%) | 0 (0%) | 1 (0.5%) |
| BCL2 translocated | |||
| Yes | 158 (85.9%) | 20 (80.0%) | 178 (85.2%) |
| No | 26 (14.1%) | 5 (20.0%) | 31 (14.8%) |
| LDH ratio | |||
| Mean (SD) | 0.835 (0.270) | 1.13 (0.693) | 0.883 (0.383) |
| Median (min, max) | 0.759 (0.470, 1.86) | 0.945 (0.573, 3.24) | 0.791 (0.470, 3.24) |
| Missing | 85 (46.2%) | 6 (24.0%) | 91 (43.5%) |
| Overall survival, y | |||
| Mean (SD) | 5.94 (4.36) | 9.37 (6.42) | 6.35 (4.77) |
| Median (min, max) | 5.29 (0.0960, 24.1) | 8.53 (0.680, 21.4) | 5.38 (0.0960, 24.1) |
| Progression-free survival, y | |||
| Mean (SD) | 3.13 (4.44) | 2.25 (2.09) | 3.03 (4.24) |
| Median (min, max) | 0.755 (0, 22.2) | 1.17 (0.390, 7.65) | 0.920 (0, 22.2) |
LDH, lactate dehydrogenase; max, maximum; min, minimum; SD, standard deviation.
Overview of the clinical characteristics of patients with cFL or dFL at the time of initial diagnosis in the validation cohort
| cFL (n = 79) | dFL (n = 124) | Overall (n = 203) | |
|---|---|---|---|
| Age, y | |||
| Mean (SD) | 57.5 (12.1) | 59.2 (12.6) | 58.5 (12.4) |
| Median (min, max) | 57.0 (28.0, 85.0) | 59.5 (29.0, 84.0) | 58.0 (28.0, 84.0) |
| Sex | |||
| Female | 39 (49.4%) | 63 (50.8%) | 102 (50.2%) |
| Male | 40 (50.6%) | 61 (49.2%) | 101 (49.8%) |
| FLIPI score | |||
| High | 21 (26.6%) | 25 (20.2%) | 46 (22.7%) |
| Low/intermediate | 39 (49.4%) | 58 (46.8%) | 97 (47.8%) |
| Missing | 19 (24.1%) | 41 (33.1%) | 60 (29.6%) |
| Grade | |||
| 1/2 | 74 (93.7%) | 102 (82.3%) | 176 (86.7%) |
| 3A | 5 (6.3%) | 22 (17.7%) | 27 (13.3%) |
| BCL2 translocated | |||
| Yes | 57 (72.2%) | 87 (70.2%) | 144 (70.9%) |
| No | 8 (10.1%) | 19 (15.3%) | 27 (13.3%) |
| Failed FISH | 12 (15.2%) | 13 (10.5%) | 25 (12.3%) |
| Missing | 2 (2.5%) | 5 (4.0%) | 7 (3.4%) |
| Clinical trajectory | |||
| Nonprogressed FL | 32 (40.5%) | 33 (26.6%) | 65 (32.0%) |
| Pre-HT | 36 (45.6%) | 82 (66.1%) | 118 (58.1%) |
| Progressed FL | 11 (13.9%) | 9 (7.3%) | 20 (9.9%) |
| POD24 | |||
| No | 46 (58.2%) | 74 (59.7%) | 120 (59.1%) |
| Yes | 33 (41.8%) | 50 (40.3%) | 83 (40.9%) |
FISH, fluorescence in situ hybridization; max, maximum; min, minimum; SD, standard deviation.
Stratification on genetic subgroup membership preserved significant association with transformation timing in patients with FL from low/intermediate FLIPI (P = .01) and POD24-negative (P < .01) groups (supplemental Figure 7). This indicates that the cFL/dFL classifier is informative within the patient population conventionally considered as clinically favorable. When combined with POD24 and m7-FLIPI in a multivariate Cox model, the genetic subgroup stratification was independently predictive of transformation risk (supplemental Figure 7).
As CREBBP KAT domain mutations were the strongest feature associated with cFL, we explored the relevance of this feature to approximate the FL subgroups. Here, samples with a single CREBBP KAT domain missense mutation were considered cFL, whereas samples with multiple or no CREBBP mutations were labeled dFL. Although this had a reduced sensitivity for detecting known cFL cases, using this approximation preserved a significant association with TTT (supplemental Figure 7). Supporting the value of the genetic subgroup, the hazard ratio of TTT was higher when patients were stratified based on the genetic membership status (1.52) compared with CREBBP KAT domain mutation status (1.21). To explore this further, we obtained the targeted sequencing data from the recent FL study by Crouch et al.33 Their panel was missing 16 (23.5%) of the 68 features required by our classifier, including key cFL genes ATP6AP1, RRAGC, and ATP6V1B2. Again, we approximated cFL status using CREBBP KAT domain mutation status. Despite the substantially lower number of transformations in that cohort, cFL cases were significantly associated with a longer TTT (supplemental Figure 7).
Discussion
FL is an indolent disease that transforms to DLBCL in up to 15% of patients. Several studies have attempted to identify acquired genetic features contributing to transformation or inherent driver mutations that can inform on the potential of eventual HT.9,14-16 We hypothesized that many de novo DLBCLs represent FLs that have transformed. Accordingly, by comparing the genetic features of FL and DLBCL, we sought to identify FL tumors, and genetic features thereof, with a greater propensity to undergo HT. To this end, we assembled a cohort of WGS data from diagnostic biopsies from 423 de novo DLBCL, no-HT FL, or paired pre- and post-HT tumors, along with a small number of composite lymphomas presenting with both FL and DLBCL morphology. We subjected these to a comprehensive analysis of genomic abnormalities, including structural variations, CNAs, and SSMs with specific focus on the noncoding variants. Focusing on the pre-HT and no-HT FLs, our supervised machine learning approach identified a subset of FL tumors that more closely resemble DLBCL in genetic profile, called dFL (“DLBCL-like”), and another enriched for CREBBP missense mutations and depleted for aSHM, called cFL (“constrained”).
Through targeted sequencing of a separate set of cases, we recapitulated the newly defined subgroups using a model trained on our WGS data. Most notably, the pre-HT tumors were significantly enriched for dFL, implying a higher propensity of such cases to eventually transform. Consistent with this, dFLs had a median TTT 10 years shorter than cFLs. Approximating the cFL subgroup using the mutation status of CREBBP recapitulated this association in this cohort and the data from another recent study. We speculate that early acquisition of certain driver mutations, including most frequently missense mutations in the CREBBP KAT domain, may limit the ability of these tumors to acquire genetic features required for HT. The relative paucity of aSHM among cFL tumors is consistent with a reduced exposure to the germinal center reaction. These results bear some similarity to those from a recent study of the genetic substructure of FL by Crouch et al,33 which also described a subgroup of FL characterized by higher aSHM rates. In that study, none of the genetic subgroups described were associated with an increased risk of HT. Notably, the study by Crouch et al had several limitations; their analysis relied on a targeted sequencing panel that lacked some of the genes more commonly mutated in FL than in DLBCL, and their analysis did not separately annotate CREBBP KAT domain mutations.
cFL tumors were also characterized by distinct biological features including higher transcript abundances of FOXP1 and CREBBP, lower expression of MYC transcripts, and lower KI-67 and FOXP1 protein abundance relative to dFL. Specifically, the expression of MYC, an oncogene whose overexpression is associated with a dark-zone germinal center–like program in Burkitt lymphoma51 and DLBCL,27 was the lowest in cFL. The relationship between FOXP1 expression and transformation in FL has been explored previously. One study identified elevated FOXP1 only after transformation,47 whereas another found that stratifying on diagnostic tissues with high FOXP1 staining identified a set of FLs with a dark-zone gene expression profile.46 Further exploration of the interplay between FOXP1 expression in transformation and in the dFL/cFL classification is warranted.
Missense mutations in the KAT domain of CREBBP were the strongest distinguishing feature of cFL. Previous studies have exclusively focused on the function of CREBBP knockouts rather than these missense changes. Particularly in light of higher CREBBP expression observed in cFL compared with dFL/DLBCL, the effect of KAT domain missense mutations is likely distinct from other mutations.48,52 A clearer understanding of the differential functions of CREBBP KAT domain mutations may elucidate their role in constraining the evolutionary trajectory of FL and reducing the risk of transformation, which may help refine our genetic subgroups and improve their prognostic value. Considering the lack of currently available stratification models to predict HT of FL into DLBCL, this study nominates the membership in genetic subgroups of cFL and dFL as a promising framework for eventual clinical application.
Acknowledgments
The authors acknowledge the ICGC MALY-DE project (https://dcc.icgc.org) for providing access to their data. Aligned reads for those genomes were obtained through a DACO-approved project (R.D.M.) using a virtual instance on the Cancer Genome Collaboratory. The results published here are in whole, or part, based on data generated by the Cancer Genome Characterization Initiative (phs000235), Non-Hodgkin Lymphoma project, developed by the National Cancer Institute. The data used for this analysis are available at https://www.ncbi.nlm.nih.gov/projects/gap/cgi-bin/study.cgi?study_id=phs000235.v20.p6. Information about Cancer Genome Characterization Initiative projects can be found at https://ocg.cancer.gov/programs/cgci. The authors are grateful for contributions from various groups at Canada’s Michael Smith Genome Sciences Centre including those from the Biospecimen, Library Construction, Sequencing, Bioinformatics, Technology development, Quality Assurance, LIMS, and Purchasing and Project Management teams.
The genome sequence data and RNA sequencing were produced with support from a contract with Genome Canada. This work was supported by a Terry Fox New Investigator Award (#1043) and by an operating grant from the Canadian Institutes of Health Research and a New Investigator Award from the Canadian Institutes of Health Research (R.D.M.). R.D.M. is a Michael Smith Foundation for Health Research scholar. D.W.S is a Michael Smith Foundation for Health Research health professional investigator. M.A.M. is the recipient of the Canada Research Chair in Genome Science.
Authorship
Contribution: K.D. and L.K.H. produced the figures and tables, and with R.D.M., wrote the manuscript with assistance from A.J.M., J.M.C., M.A.M., C.S., and D.W.S.; M.C., H.S., B.C., K.M.C., G.D., B.M.G., P.P., C.K.R., and J.W. helped with data analyses; S.B.-N., P.F., and G.W.S. performed the immunohistochemical and cytological analyses; M.B. and B.M. managed the clinical data records and deposition; R.D.M. and L.K.H. designed the study; M.A.M., R.D.M., and L.K.H. directed the study; and all authors contributed to the interpretation of the data, reviewed the manuscript, and approved it for submission.
Conflict-of-interest disclosure: R.D.M. and D.W.S. are named inventors on a patent application describing the double-hit signature. The remaining authors declare no competing financial interests.
Correspondence: Ryan D. Morin, Department of Molecular Biology and Biochemistry, Simon Fraser University, 8888 University Dr, Burnaby, BC V5A 1S6, Canada; e-mail: rdmorin@sfu.ca.

This feature is available to Subscribers Only
Sign In or Create an Account Close Modal