Key Points
Increased BM IL-1 levels during aging drive Tet2+/− clonal expansion via increased HSPC proliferation and multilineage differentiation.
Genetic deletion of IL-1R1 abolishes, and pharmacologic inhibition of IL-1–IL-1R1 signaling impairs, Tet2+/− clonal expansion during aging.
Abstract
Clonal hematopoiesis of indeterminate potential (CHIP), also referred to as aging-related clonal hematopoiesis, is defined as an asymptomatic clonal expansion of mutant mature hematopoietic cells in ≥4% of blood leukocytes. CHIP associates with advanced age and increased risk for hematological malignancy, cardiovascular disease, and all-cause mortality. Loss-of-function somatic mutations in TET2 are frequent drivers of CHIP. However, the contribution of aging-associated cooperating cell-extrinsic drivers, like inflammation, remains underexplored. Using bone marrow (BM) transplantation and newly developed genetic mosaicism (HSC-SCL-Cre-ERT; Tet2+/flox; R26+/tm6[CAG-ZsGreen1]Hze) mouse models of Tet2+/−driven CHIP, we observed an association between increased Tet2+/− clonal expansion and higher BM levels of the inflammatory cytokine interleukin-1 (IL-1) upon aging. Administration of IL-1 to mice carrying CHIP led to an IL-1 receptor 1 (IL-1R1)–dependent expansion of Tet2+/− hematopoietic stem and progenitor cells (HSPCs) and mature blood cells. This expansion was caused by increased Tet2+/− HSPC cell cycle progression, increased multilineage differentiation, and higher repopulation capacity compared with their wild-type counterparts. In agreement, IL-1α–treated Tet2+/− hematopoietic stem cells showed increased DNA replication and repair transcriptomic signatures and reduced susceptibility to IL-1α–mediated downregulation of self-renewal genes. More important, genetic deletion of IL-1R1 in Tet2+/− HPSCs or pharmacologic inhibition of IL-1 signaling impaired Tet2+/− clonal expansion, establishing the IL-1 pathway as a relevant and therapeutically targetable driver of Tet2+/− CHIP progression during aging.
Introduction
Clonal hematopoiesis of indeterminate potential (CHIP), also termed age-related clonal hematopoiesis, is defined by the presence of an expanded somatic blood cell clone carrying mutations in leukemia driver genes at a variant allele frequency (VAF) of ≥2% (thus affecting at heterozygous states 4% of cells), in the absence of hematological maligancy.1,2 CHIP carriers have an about 13-fold increased risk of developing myeloid hematological malignancies and an increased risk of all-cause mortality, largely due to cardiovascular disease and stroke.1-4 Interestingly, the likelihood of progression to both acute myeloid leukemia (AML) and cardiovascular mortality increases in individuals displaying higher mutant clonal size. Furthermore, progression to hematological malignancies depends on the type and complexity of mutations in CHIP.2,5,6 More important, advanced age is the best predictor of CHIP, with a 5.6% or 18.4% prevalence in the sixth or ninth decade of life, respectively.2 Understanding the drivers of clonal expansion in CHIP-carrying individuals during aging is key to devise potential therapeutic interventions for this population.
Loss-of-function heterozygous mutations in epigenetic regulators DNMT3A (cytosine methyltransferase) and TET2 (methylcytosine dioxygenase) are the most frequently detected mutations in CHIP, accounting for about 50% to 60% and 10% to 30% of mutations found in CHIP carriers, respectively.1-3,7,8 Moreover, TET2 mutations are the most frequent single-gene mutations in myelodysplastic syndrome (MDS), an age-related hematopoietic stem and progenitor cell (HSPC) disease.9 In the context of CHIP, TET2 mutations show highest clonal expansion rates over time (with an estimated 10% annual growth rate compared with 5% of DNMT3A mutations7,8,10). Part of this expansion effect is attributed to cell-intrinsic properties of Tet2 mutant HSPCs. Indeed, Tet2 loss of function in murine HSPCs leads to increased self-renewal and pool expansion, higher competitive repopulation capacity, and a predisposition to hematological malignancy development.11-13 On the other hand, cell-extrinsic inflammatory pressure is emerging as a key selective factor favoring Tet2 mutant fitness. Indeed, Tet2-deficient HSPCs show enhanced proliferation and differentiation in response to microbial-induced interleukin-6 (IL-6)14 and in response to tumor necrosis factor-α (TNF-α).15 Moreover, Tet2-deficient HSPCs maintain a repopulation advantage after exposure to bacterial lipopolysaccharides (LPSs), due to increased resistance to IL-6–mediated apoptosis,16 and exhibit a toll-like receptor–TNF receptor associated factor 6A (TLR-TRAF6A) and noncanonical NF-κB–dependent competitive advantage during low-grade inflammation.17 In sum, these studies confirm an overall increased Tet2 mutant HSPC clonal fitness in acute inflammatory hematopoietic challenge models, highlighting an interdependence between cell-intrinsic and cell-extrinsic factors. However, the precise contribution of these factors in the context of Tet2-mutant clonal hematopoiesis during physiological aging remains to be determined.
Aging associates with chronic low-grade inflammation (ie, inflammaging).18,19 Given the role of IL-1 in this process,20-23 we postulated that IL-1 might be a key extrinsic driver of Tet2-deficient HSPC expansion in aging. Indeed, we identified a direct dependency of Tet2+/− clonal hematopoiesis on the IL-1 pathway and further demonstrate that this can be therapeutically targeted to reduce Tet2+/− clonal expansion during aging.
Materials and methods
Detailed information is provided in the supplemental Materials file, available on the Blood website.
Mice
CD45.1+ CD45.2+ mice were generated in house as an F1 generation by crossing commercially available C57BL/6 (027 from Charles River) with C57BL/6-Ly5.1 (494 from Charles River). Triple-transgenic mouse strains, HSC-SCL-Cre-ERT; Tet2+/flox; R26+/tm6(CAG-ZsGreen1)Hze and HSC-SCL-Cre-ERT; Tet2+/+; R26+/tm6(CAG-ZsGreen1)Hze, were generated in house by crossing commercially available strains Tet2 floxed (017573 from The Jackson Laboratory), R26+/tm6(CAG-ZsGreen1)Hze (007906 from The Jackson Laboratory), and HSC-SCL-Cre-ERt (kindly provided by Radek Skoda). All mice were housed and handled according to the guidelines of the Swiss Federal Veterinary Office under specific pathogen-free conditions. All experiments were approved by the Veterinaramt Kanton Zurich (Zurich, Switzerland).
In vivo assays
Tamoxifen injections: to induce different levels of recombination, 2- to 3-month-old HSC-SCL-Cre-ERT; Tet2+/flox; R26+/tm6(CAG-ZsGreen1)Hze and HSC-SCL-Cre-ERT; Tet2+/+; R26+/tm6(CAG-ZsGreen1)Hze mice were injected intraperitoneally with different tamoxifen doses. We use the following linear equation: y = 0.7505x + 3.966, where x is amount of tamoxifen injected (in mg per kg of mouse) and y is the percentage of ZsG+ CD45+ cells obtained 5 weeks after injection. IL-1 injections: briefly, 8 weeks after tamoxifen injection or bone marrow (BM) transplantation, animals were injected for 2 rounds of 7 consecutive daily intraperitoneal injections separated by 4 rest days with 0.5 μg of IL-1α (Recombinant Mouse IL-1α/IL-1F1; R&D) or IL-1β (Recombinant Mouse IL-1β/IL-1F2; R&D) in 100 μL of phosphate-buffered saline (PBS). Anakinra (Kineret; Sobi) was injected intraperitoneally at a dose of 37 μg/mouse in 100 μL of PBS every other day for 2 months, starting 11 months after tamoxifen injection.
Statistical analysis
Paired and unpaired Student t-test (for bivariate comparison) or 2-way analysis of variance with Tukey multiple comparisons test (for multivariate comparison) was performed in Prism software v8 (GraphPad).
Results
Generation of an irradiation- and transplantation-independent genetic chimerism mouse model of Tet2+/− clonal hematopoiesis
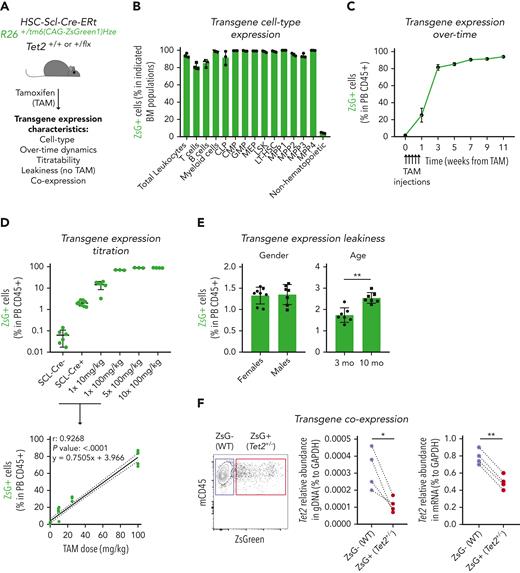
In vivo studies on clonal hematopoiesis rely mostly on BM HSPC transplantation techniques involving high-dose irradiation of recipient mice to favor the engraftment of donor BM cells.16,24,25 To circumvent this, we developed a novel irradiation-independent mouse model to evaluate the clonal dynamics of Tet2+/− hematopoiesis during unperturbed physiological aging (Figure 1A). We used a triple-transgenic mouse strain, HSC-SCL-Cre-ERT; Tet2+/flox; R26+/tm6(CAG-ZsGreen1)Hze, that ensures that floxed exon 3 on 1 Tet2 gene copy12 as well as a floxed stop codon on reporter gene ZsGreen1 (ZsG) are excised by a Cre enzyme that is fused to estrogen receptor (CreERT) and whose expression is under the control of the HSPC-specific Scl gene enhancer.26 Accordingly, exposure to the estrogen receptor ligand tamoxifen (TAM) induces HSPC-specific flox recombination, leading to concomitant loss of 1 Tet2 gene copy and gain of reporter gene ZsG expression. To validate the model, we exposed triple-transgenic mice to 5 consecutive injections of TAM at 100 mg/kg and observed high ZsG expression in all BM hematopoietic mature and progenitor/stem populations (range, 80%-100%) and low ZsG expression in nonhematopoietic cells (range, 3%-5%), thus confirming the relatively high hematopoietic specificity of CreERT activity (Figure 1B-C; supplemental Figure 1A). Moreover, we observed that the amount of ZsG expression in the hematopoietic compartment could be titrated by the amount of TAM injected and extrapolated the linear equation that relates these 2 variables (Figure 1D). Further characterization of the model revealed ZsG expression leakiness, with low expression levels in the absence of TAM injection, which was independent of sex but increased with age (up to 2.5% frequency at 10 months of age; Figure 1E). Finally, to confirm the simultaneous CreERT-mediated recombination in Tet2 and ZsGreen1 gene flox sites, we sorted ZsG– and ZsG+ CD45+ peripheral blood (PB) cells from TAM-injected mice and performed Tet2 gene quantification. As expected, ZsG+ cells showed reduced Tet2 gene levels in genomic and complementary DNA (Figure 1F) compared with ZsG– cells. Altogether, these data validate the generation of an irradiation/transplantation-independent, TAM-dose–dependent inducible, and traceable genetic chimerism model to study Tet2+/− clonal hematopoiesis.
Generation of an inducible hematopoietic genetic mosaicism mouse model of Tet2+/−-driven clonal hematopoiesis. (A) Schematic representation of tamoxifen (TAM)–inducible, dose-dependent, and hematopoietic-specific genetic mosaicism mouse model of Tet2+/−-driven clonal hematopoiesis. (B) Percentage of ZsG+ cells in indicated BM populations 4 weeks after exposure to 5 consecutive TAM injections at 100 mg/kg (n = 3): common lymphoid progenitors (CLPs), common myeloid progenitors (CMPs), granulocyte-macrophage progenitors (GMPs), megakaryocyte-erythrocyte progenitors (MEPs), lineage– Sca-1+ c-Kit+ (LSK), long-term hematopoietic stem cells (LT-HSCs), multipotent progenitors 1 to 4 (MPP1-4), and nonhematopoietic cells. (C) Longitudinal quantification of the percentage of ZsG+ in peripheral blood (PB) CD45+ cells after exposure to 5 consecutive TAM injections at 100 mg/kg (n = 3). (D) Percentage of ZsG+ in PB CD45+ cells 4 weeks after exposure to indicated TAM doses (n = 3) (top). Correlation between the percentage of PB ZsG+ CD45+ cells and the amount of TAM injected. Pearson correlation coefficient (r), P value, and linear equation are indicated (n = 29) (bottom). (E) Percentage of ZsG+ CD45+ cells in the absence of TAM injection (n = 7-8), in female or male adult mice (left); in 3-month-old (3 mo) or 10-month-old (10 mo) mice (right). (F) Representative dot plot of ZsG– wild type (WT; purple box) and ZsG+Tet2+/− (red box) (left). Quantification of Tet2 gene abundance in genomic DNA (gDNA) from ZsG– (WT) and ZsG+ (Tet2+/−) CD45+ cells (n = 4) (right). Quantification of Tet2 gene abundance in complementary DNA from ZsG– (WT) and ZsG+ (Tet2+/−) CD45+ cells (n = 4). ∗P < .05, ∗∗P < .01 by unpaired (E) and paired (F) t-test. Error bars represent standard error of the mean. GAPDH, glyceraldehyde-3-phosphate dehydrogenase.
Generation of an inducible hematopoietic genetic mosaicism mouse model of Tet2+/−-driven clonal hematopoiesis. (A) Schematic representation of tamoxifen (TAM)–inducible, dose-dependent, and hematopoietic-specific genetic mosaicism mouse model of Tet2+/−-driven clonal hematopoiesis. (B) Percentage of ZsG+ cells in indicated BM populations 4 weeks after exposure to 5 consecutive TAM injections at 100 mg/kg (n = 3): common lymphoid progenitors (CLPs), common myeloid progenitors (CMPs), granulocyte-macrophage progenitors (GMPs), megakaryocyte-erythrocyte progenitors (MEPs), lineage– Sca-1+ c-Kit+ (LSK), long-term hematopoietic stem cells (LT-HSCs), multipotent progenitors 1 to 4 (MPP1-4), and nonhematopoietic cells. (C) Longitudinal quantification of the percentage of ZsG+ in peripheral blood (PB) CD45+ cells after exposure to 5 consecutive TAM injections at 100 mg/kg (n = 3). (D) Percentage of ZsG+ in PB CD45+ cells 4 weeks after exposure to indicated TAM doses (n = 3) (top). Correlation between the percentage of PB ZsG+ CD45+ cells and the amount of TAM injected. Pearson correlation coefficient (r), P value, and linear equation are indicated (n = 29) (bottom). (E) Percentage of ZsG+ CD45+ cells in the absence of TAM injection (n = 7-8), in female or male adult mice (left); in 3-month-old (3 mo) or 10-month-old (10 mo) mice (right). (F) Representative dot plot of ZsG– wild type (WT; purple box) and ZsG+Tet2+/− (red box) (left). Quantification of Tet2 gene abundance in genomic DNA (gDNA) from ZsG– (WT) and ZsG+ (Tet2+/−) CD45+ cells (n = 4) (right). Quantification of Tet2 gene abundance in complementary DNA from ZsG– (WT) and ZsG+ (Tet2+/−) CD45+ cells (n = 4). ∗P < .05, ∗∗P < .01 by unpaired (E) and paired (F) t-test. Error bars represent standard error of the mean. GAPDH, glyceraldehyde-3-phosphate dehydrogenase.
Increased Tet2+/− clonal expansion rates associate with high BM IL-1 levels on aging
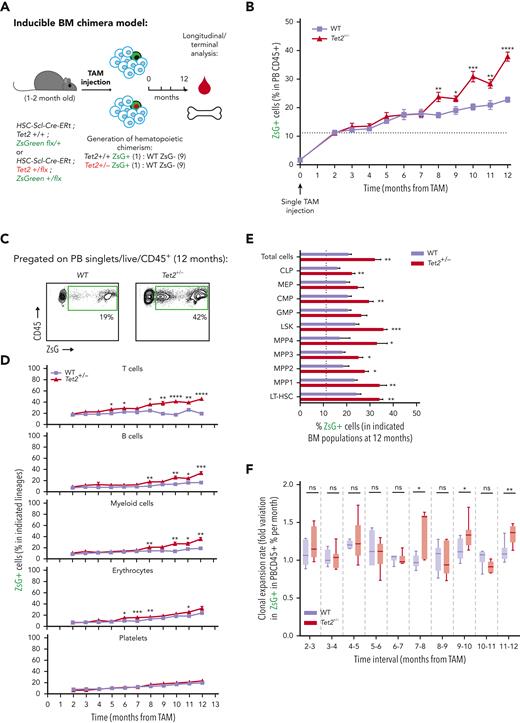
To evaluate the clonal dynamics of Tet2+/− hematopoiesis during aging, triple-transgenic mice carrying wild-type (WT group) or a heterozygous floxed Tet2 gene (Tet2+/− group) were induced with a single TAM injection to generate an about 10% clonal hematopoietic fraction and aged for 12 months (Figure 2A). Longitudinal quantification of ZsG+ WT and ZsG+Tet2+/− clonal fractions in PB CD45+ leukocytes showed that, although both clonal fractions increase over time, there was a significantly higher expansion of the Tet2+/− clone compared with the WT (Figure 2B-C). Moreover, Tet2+/− clonal expansion occurred in multiple hematopoietic lineages (T cells, B cells, myeloid cells, and erythrocytes; Figure 2D), suggesting that Tet2+/− clonal expansion during aging is driven by increased multilineage differentiation from upstream HSPC populations. Of note, we observed no significant alterations in blood cell counts in aged Tet2+/− vs WT mice (supplemental Figure 2A), which is in alignment with the lack of hematopoietic alterations in individuals with CHIP.2 Terminal analysis of BM cell populations in aged mice showed a significant Tet2+/− clonal expansion in multiple HSPC populations (common lymphoid progenitors [CLPs], common myeloid progenitors [CMPs], lineage– Sca-1+ c-Kit+ [LSKs], multipotent progenitors 1 to 4 [MPP1-4], and long-term hematopoietic stem cells [LT-HSCs]; Figure 2E; supplemental Figure 2B). More important, Tet2+/− clonal expansion in PB leukocytes and HSPCs was further increased in animals aged for 28 months (supplemental Figure 2C-E) and in animals induced at a more advanced age (supplemental Figure 2F-H), reflecting a clear competitive advantage of Tet2+/− over WT hematopoiesis during aging.
Hematopoietic Tet2+/− clonal expansion rate increases in aged mice and associates with increased IL-1 BM levels. (A) Experimental design. (B) Longitudinal quantification of the percentage of PB CD45+ WT ZsG+ (n = 6; purple line) and CD45+Tet2+/− ZsG+ (n = 7; red line) cells over 1 year after TAM induction. (C) Representative fluorescence-activated cell sorting plot of ZsG expression on PB CD45+ cells in 12-month-old WT and Tet2+/− mice. (D) Percentage of WT (n = 6) or Tet2+/− (n = 7) ZsG+ cells in PB T cells, B cells, myeloid cells, erythrocytes, and platelets. (E) Percentage of WT ZsG+ (n = 6) and Tet2+/− ZsG+ (n = 7) on indicated BM populations. (F) Monthly expansion rates of PB CD45+ WT ZsG+ (n = 6) and CD45+Tet2+/− ZsG+ (n = 7) populations at indicated time intervals. (G) Gene expression levels of indicated genes in WT ZsG+ (n = 3) and Tet2+/− ZsG+ (n = 3) in total BM white blood cells, 1 year after TAM induction. (H) IL-1α and IL-1β protein levels in BM lysates of WT (n = 6) or Tet2+/− (n = 7) mice, 1 year after TAM induction. (I) Correlation between BM IL-1α/IL-1β levels and the percentage of BM Tet2+/− ZsG+ cells (n = 11). Pearson correlation coefficient (r) and P values are indicated. Dark red dots indicate mice from Figure 1B; light red dots indicate additional mice with low Tet2+/− ZsG+ fractions. (J) Experimental design. (K) Fraction of T cells, B cells, or myeloid cells in WT (ZsG–; n = 3) or Tet2+/− (ZsG+; n = 3) BM CD45+ cells. L. IL-1α (left) and IL-1β (right) protein levels in the conditioned media (CM) of sorted WT and Tet2+/− T cells, B cells, and myeloid cells without or with LPS exposure (n = 3). Data are a pool of at least 2 independent experiments for all graphs, except J through L. ∗P < .05, ∗∗P < .01, ∗∗∗P < .001, and ∗∗∗∗P < .0001 by unpaired t-test (B, E–H, and K) or by 1-way analysis of variance with Tukey correction (L). Error bars represent standard error of the mean. GAPDH, glyceraldehyde-3-phosphate dehydrogenase; ns, not significant.
Hematopoietic Tet2+/− clonal expansion rate increases in aged mice and associates with increased IL-1 BM levels. (A) Experimental design. (B) Longitudinal quantification of the percentage of PB CD45+ WT ZsG+ (n = 6; purple line) and CD45+Tet2+/− ZsG+ (n = 7; red line) cells over 1 year after TAM induction. (C) Representative fluorescence-activated cell sorting plot of ZsG expression on PB CD45+ cells in 12-month-old WT and Tet2+/− mice. (D) Percentage of WT (n = 6) or Tet2+/− (n = 7) ZsG+ cells in PB T cells, B cells, myeloid cells, erythrocytes, and platelets. (E) Percentage of WT ZsG+ (n = 6) and Tet2+/− ZsG+ (n = 7) on indicated BM populations. (F) Monthly expansion rates of PB CD45+ WT ZsG+ (n = 6) and CD45+Tet2+/− ZsG+ (n = 7) populations at indicated time intervals. (G) Gene expression levels of indicated genes in WT ZsG+ (n = 3) and Tet2+/− ZsG+ (n = 3) in total BM white blood cells, 1 year after TAM induction. (H) IL-1α and IL-1β protein levels in BM lysates of WT (n = 6) or Tet2+/− (n = 7) mice, 1 year after TAM induction. (I) Correlation between BM IL-1α/IL-1β levels and the percentage of BM Tet2+/− ZsG+ cells (n = 11). Pearson correlation coefficient (r) and P values are indicated. Dark red dots indicate mice from Figure 1B; light red dots indicate additional mice with low Tet2+/− ZsG+ fractions. (J) Experimental design. (K) Fraction of T cells, B cells, or myeloid cells in WT (ZsG–; n = 3) or Tet2+/− (ZsG+; n = 3) BM CD45+ cells. L. IL-1α (left) and IL-1β (right) protein levels in the conditioned media (CM) of sorted WT and Tet2+/− T cells, B cells, and myeloid cells without or with LPS exposure (n = 3). Data are a pool of at least 2 independent experiments for all graphs, except J through L. ∗P < .05, ∗∗P < .01, ∗∗∗P < .001, and ∗∗∗∗P < .0001 by unpaired t-test (B, E–H, and K) or by 1-way analysis of variance with Tukey correction (L). Error bars represent standard error of the mean. GAPDH, glyceraldehyde-3-phosphate dehydrogenase; ns, not significant.
To dissect the cell-intrinsic or cell-extrinsic nature of the observed competitive differences, we hypothesized that if Tet2+/− clonal populations are intrinsically more fit than their WT counterparts, then they should display higher expansion rates independently of age. Conversely, if there are extrinsic factors derived from the aging process driving Tet2+/− clonal expansion, then Tet2+/− expansion rates should surpass those of the WT only in advanced age. To test this, we calculated ZsG+ WT and ZsG+Tet2+/− monthly expansion rates within PB CD45+ leukocytes over time. Strikingly, we observed that only in advanced age (from 7 months onward), there was a significant increase in Tet2+/− hematopoietic clonal expansion rates over WT (particularly at 7-8, 9-10, and 11-12 monthly periods; Figure 2F), which associated with a concomitant Tet2+/− clonal expansion in LT-HSCs, MPP1s, MPP3s, and LSKs (supplemental Figure 2I). These data suggest that the competitive advantage observed in the Tet2+/− clone could be influenced by altered extrinsic factors, derived from the aging process. Accordingly, we sought to identify the key extrinsic factor driving Tet2+/− expansion during aging. Considering that aging associates with chronic low-grade inflammation18,19 and that Tet2-mutant immune cells display increased proinflammatory phenotypes,24,27 we determined the expression profile of key proinflammatory cytokines genes (Il1a, Il1b, Il6, Ifng, and Tnfa) in aged WT and Tet2+/− total BM cells. We observed a significant increase in IL-1α/β and TNF-α gene expression levels in Tet2+/− total BM cells compared with WT (Figure 2G). Given the contribution of IL-1 to inflammaging and its detrimental impacts on WT HSC function,23,28 we further focused on the IL-1 pathway. IL-1 pathway member quantification in aged WT and Tet2+/− total BM cells showed no differences in Il1r1 and Il1r2 gene expression and a decrease in Ilr1rn (IL1R antagonist) expression in Tet2+/− cells (Figure 2G). In agreement with gene expression data, we detected increased IL-1α protein levels in Tet2+/− BM (Figure 2H) and a significant positive correlation between BM Tet2+/− clonal size and IL-1α concentration levels (Figure 2I). Further dissection of the BM hematopoietic cell types producing IL-1 revealed that Tet2+/− myeloid cells are the main IL-1α producers, particularly in response to LPS (Figure 2J-L), which is in line with our previous findings on WT aged BM hematopoietic and nonhematopoietic cells.23 Collectively, these data indicate that during aging, starting at about 7 to 8 months, there is a multilineage Tet2+/− hematopoietic clonal expansion, which associates with increased cell-extrinsic proinflammatory IL-1 levels, produced mainly by the myeloid BM compartment.
IL-1α–IL-1R1 axis drives directly Tet2+/− clonal expansion via increased multilineage differentiation
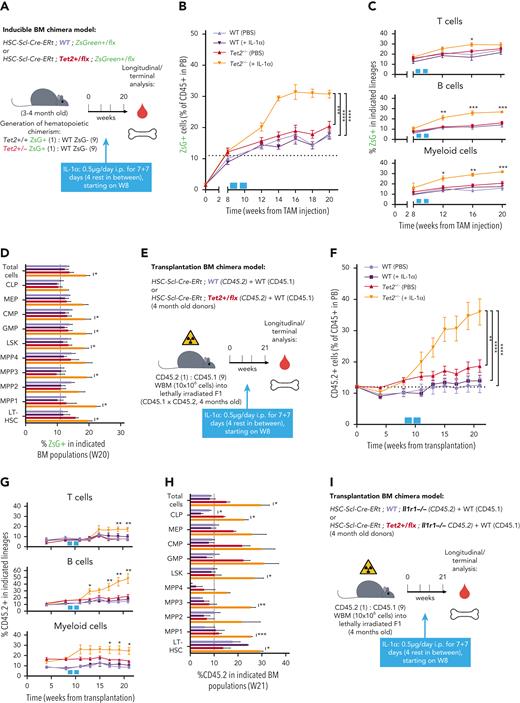
We next investigated a causality link between increased IL-1 levels and increased Tet2+/− hematopoietic clonal size. For this purpose, we generated young (3-4 months old) triple-transgenic mice carrying a 10% WT or Tet2+/− ZsG+ clonal fraction, exposed them for 14 days to IL-1α, and measured its effects on clonal dynamics (Figure 3A). Strikingly, IL-1α exposure resulted in a significant increase uniquely in ZsG+Tet2+/− clonal fraction in PB CD45+ leukocytes (Figure 3B), whereas this was not observed in respective controls. This occurred in multiple hematopoietic lineages (T cells, B cells, and myeloid cells; Figure 3C). Moreover, terminal analysis of BM cell populations in IL-1α–exposed mice also showed a significant Tet2+/− clonal expansion in multiple HSPCs (granulocyte-macrophage progenitors, CMPs, LSKs, MPP1s, MPP3s, and LT-HSCs; Figure 3D), reflecting a clear competitive advantage of Tet2+/− hematopoiesis over WT during IL-1α exposure. Next, to exclude potential model bias, we used standard BM transplantation chimera models to test the effect of IL-1α exposure on Tet2+/− clonal dynamics. Lethally irradiated CD45.1+ × CD45.2+ (F1) mice were transplanted with donor mixed BM populations carrying 90% CD45.1+ together with 10% WT or Tet2+/− CD45.2+ total cells. At 2 months after transplantation, chimeric mice were exposed for 14 days to IL-1α, and we determined effects on clonal dynamics (Figure 3E). As observed in the inducible BM chimera model, IL-1α exposure led to a specific and significant expansion of CD45.2+Tet2+/− clone size in all leukocyte lineages (Figure 3F-G) and in multiple hematopoietic progenitors (CLPs, LSKs, MPP1,3, and LT-HSCs; Figure 3H). More important, we observed a similar, significant effect, although with a lower magnitude, in transplanted BM chimeric mice exposed to IL-1β (supplemental Figure 3A-D).
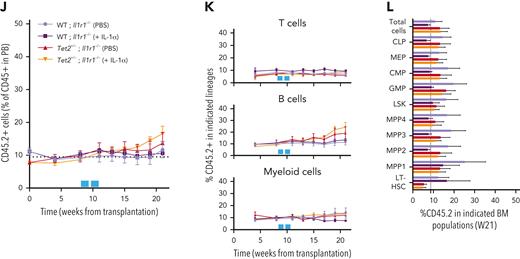
IL-1α–IL-1R1 axis directly drives Tet2+/− clonal expansion via increased multilineage differentiation. (A) Experimental design. (B) Longitudinal quantification of the percentage of CD45+ WT ZsG+ and CD45+Tet2+/− ZsG+ in PB of mice exposed to PBS or IL-1α (n = 2-5). (C) Longitudinal assessment of the percentage of WT or Tet2+/− ZsG+ cells in PB T cells, B cells, and myeloid cells of mice exposed to PBS or IL-1α (n = 4-6). Blue boxes on x-axis indicate IL-1α exposure period. (D) Terminal assessment of the percentage of WT or Tet2+/− ZsG+ cells in indicated BM populations of mice exposed to PBS or IL-1α (n = 4-6). (E) Experimental design. (F) Longitudinal quantification of the percentage of CD45.2+ WT and CD45.2+Tet2+/− in PB of mice exposed to PBS or IL-1α (n = 5-6). Blue boxes on x-axis indicate IL-1α exposure period. (G) Percentage of WT or Tet2+/− CD45.2+ cells in PB T cells, B cells, and myeloid cells of mice exposed to PBS or IL-1α (n = 5-6). (H) Percentage of WT or Tet2+/− CD45.2+ cells in indicated BM populations of mice exposed to PBS or IL-1α (n = 5-6). (I) Experimental design. (J) Longitudinal quantification of the percentage of CD45.2+ WT; Ilr1–/– and CD45.2+Tet2+/−; Ilr1–/– cells in PB of mice exposed to PBS or IL-1α (n = 5-6). Blue boxes on x-axis indicate IL-1α exposure period. (K) Percentage of CD45.2+ WT; Ilr1–/– and CD45.2+Tet2+/−; Ilr1–/– cells in PB T cells, B cells, and myeloid cells of mice exposed to PBS or IL-1α (n = 5-6). (L) Percentage of CD45.2+ WT; Ilr1–/– and CD45.2+Tet2+/−; Ilr1–/– cells in indicated BM populations of mice exposed to PBS or IL-1α (n = 5-6). ∗P < .05, ∗∗P < .01, ∗∗∗P < .001, and ∗∗∗∗P < .0001 by unpaired t-test (between PBS and IL-1α conditions, within the same genotype for C, D, G, H, K, and L) or by a 1-way analysis of variance with Tukey correction (for last time point in B, F, and J). Error bars represent standard error of the mean. WBM, whole bone marrow.
IL-1α–IL-1R1 axis directly drives Tet2+/− clonal expansion via increased multilineage differentiation. (A) Experimental design. (B) Longitudinal quantification of the percentage of CD45+ WT ZsG+ and CD45+Tet2+/− ZsG+ in PB of mice exposed to PBS or IL-1α (n = 2-5). (C) Longitudinal assessment of the percentage of WT or Tet2+/− ZsG+ cells in PB T cells, B cells, and myeloid cells of mice exposed to PBS or IL-1α (n = 4-6). Blue boxes on x-axis indicate IL-1α exposure period. (D) Terminal assessment of the percentage of WT or Tet2+/− ZsG+ cells in indicated BM populations of mice exposed to PBS or IL-1α (n = 4-6). (E) Experimental design. (F) Longitudinal quantification of the percentage of CD45.2+ WT and CD45.2+Tet2+/− in PB of mice exposed to PBS or IL-1α (n = 5-6). Blue boxes on x-axis indicate IL-1α exposure period. (G) Percentage of WT or Tet2+/− CD45.2+ cells in PB T cells, B cells, and myeloid cells of mice exposed to PBS or IL-1α (n = 5-6). (H) Percentage of WT or Tet2+/− CD45.2+ cells in indicated BM populations of mice exposed to PBS or IL-1α (n = 5-6). (I) Experimental design. (J) Longitudinal quantification of the percentage of CD45.2+ WT; Ilr1–/– and CD45.2+Tet2+/−; Ilr1–/– cells in PB of mice exposed to PBS or IL-1α (n = 5-6). Blue boxes on x-axis indicate IL-1α exposure period. (K) Percentage of CD45.2+ WT; Ilr1–/– and CD45.2+Tet2+/−; Ilr1–/– cells in PB T cells, B cells, and myeloid cells of mice exposed to PBS or IL-1α (n = 5-6). (L) Percentage of CD45.2+ WT; Ilr1–/– and CD45.2+Tet2+/−; Ilr1–/– cells in indicated BM populations of mice exposed to PBS or IL-1α (n = 5-6). ∗P < .05, ∗∗P < .01, ∗∗∗P < .001, and ∗∗∗∗P < .0001 by unpaired t-test (between PBS and IL-1α conditions, within the same genotype for C, D, G, H, K, and L) or by a 1-way analysis of variance with Tukey correction (for last time point in B, F, and J). Error bars represent standard error of the mean. WBM, whole bone marrow.
Next, we tested if IL-1α–mediated increase in Tet2+/− clone size resulted from a direct sensing of IL-1α by Tet2+/− hematopoietic cells or if it resulted from a secondary signal emerging from IL-1α sensing by WT hematopoietic and nonhematopoietic cells. For this, we generated transplantation BM chimeras carrying 90% CD45.1+ and 10% WT; Il1r1–/– or Tet2+/−; Il1r1–/– CD45.2+ total BM cells and exposed them to IL-1α (Figure 3I). In stark contrast to IL-1R1–proficient Tet2+/− cells, we observed no expansion of Tet2+/−; Il1r1–/– cells after IL-1α exposure (Figure 3J-L; supplemental Figure 3E). This indicates that IL-1α–mediated Tet2+/− clonal expansion results from direct sensing of IL-1α via IL-1R1 expressed by Tet2+/− hematopoietic cells. Overall, these data establish the IL-1α–IL-1R1 axis as a direct driver of increased Tet2+/− multilineage differentiation, leading to Tet2+/− hematopoietic clonal fitness gain and dominance over WT hematopoiesis.
Tet2+/− HSPCs maintain higher proliferative and repopulation capacity than WT in response to long-term IL-1α
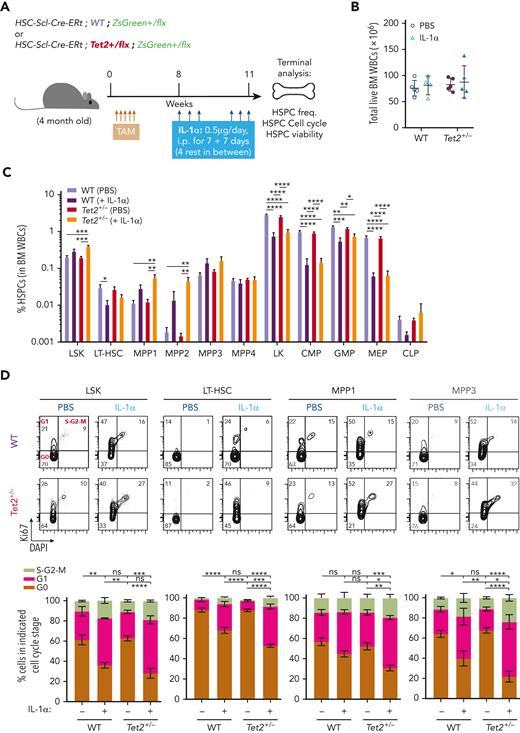
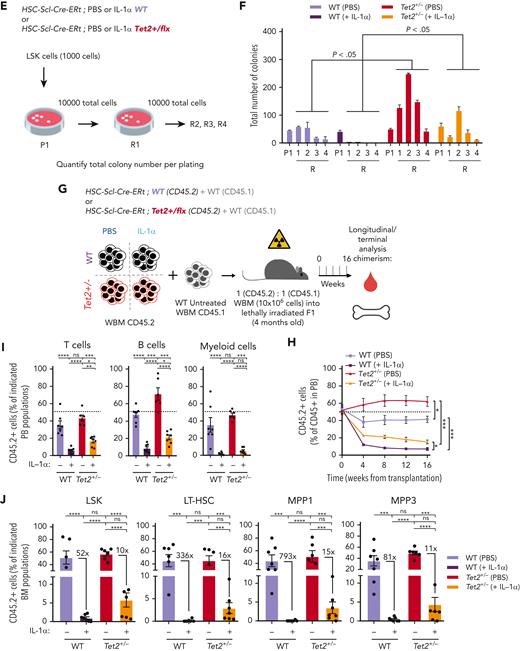
Next, we sought to determine the cellular mechanisms governing IL-1α–mediated increase in Tet2+/− hematopoietic clonal expansion. We focused on HSPC apoptotic and proliferative readouts, previously implicated in inflammatory responses.16 For this purpose, we used triple-transgenic mice carrying full WT or Tet2+/− hematopoiesis, to have sufficient WT or Tet2+/− HSPC numbers for apoptosis and cell cycle analysis. Eight weeks after TAM injection, mice were exposed for 14 days to IL-1α and analyzed 24 hours after the last injection (Figure 4A). IL-1α exposure resulted in a significant increase in PB white blood cell counts, particularly in neutrophils and monocytes, in both WT and Tet2+/−-induced mice (supplemental Figure 4A; Figure 4B). Concerning the BM HSPC frequencies, we observed a general trend for IL-1α treatment to reduce the LK compartment (Lin–c-Kit+Sca-1– cells: CMPs, granulocyte-macrophage progenitors, and megakaryocyte-erythrocyte progenitors) in both genotypes, whereas expansion of the LSK compartment (Lin–c-Kit+Sca-1+: MPP1, MPP2, and MPP3) was more evident in Tet2+/− HSPCs (Figure 4C). Viability analysis showed no effect of IL-1α exposure on HSPC apoptotic levels, except for CLPs that showed decreased viability in both genotypes (supplemental Figure 4B). In contrast, cell cycle analysis revealed a major impact of IL-1α exposure on HSPC proliferative responses, particularly in the LSK compartment (minor impact in LK cells; supplemental Figure 4C). In detail, IL-1α exposure decreased the frequency of cells in G0 in both genotypes, although this effect was significantly stronger in Tet2+/− LT-HSCs, MPP1s, and MPP3 (Figure 4D). This suggests that these cells are more sensitive to IL-1α–mediated proliferation and possibly less likely to return to a quiescent state after long-term IL-1α stimulation than WT. HSPC divisions can be differentiating and self-renewing, particularly in less committed populations.29 Our data suggest that IL-1α–mediated increase in Tet2+/− clonal fraction is likely due to increased differentiating divisions in Tet2+/− HSPCs compared with WT HSPCs. To test the impact of IL-1α on Tet2+/− HSPC self-renewal, we exposed WT and Tet2+/− LSK cells to IL-1α and assessed their in vitro serial colony-forming capacity in methylcellulose on replating (Figure 4E). Interestingly, although IL-1α exposure reduced the replating capacity of HSPCs in both genotypes, the Tet2+/− HSPCs were more resistant to this effect and were able to form colonies up to the fourth replating cycle (Figure 4F), suggesting that IL-1–dependent increased proliferative activity in Tet2+/− HSPCs is both differentiating and self-renewing.
Tet2+/− HSPCs maintain higher proliferative and repopulation capacity than WT in response to long-term IL-1α. (A) Experimental design. (B) Number of total white blood cells in BM (2 femurs and 2 tibias) of WT and Tet2+/− mice exposed to PBS or IL-1α (n = 4-5). (C) Percentage of indicated BM populations in WT and Tet2+/− mice exposed to PBS or IL-1α (n = 4-5). (D) Representative fluorescence-activated cell sorting plot of cell cycle analysis of indicated populations; percentage per quadrant is indicated. Percentage of indicated BM populations in G0, G1, or S-G2-M phases of cell cycle from WT and Tet2+/− mice exposed to PBS or IL-1α (n = 4-5). Statistical analysis performed for G0 stage. (E) Experimental design. (F) Quantification of total colony numbers after plating (P)/replating (R) of WT and Tet2+/− LSK/total cells in methylcellulose after initial exposure to PBS or IL-1α (n = 3). (G) Experimental design. (H) Longitudinal quantification of percentage of donor-derived PB CD45.2+ WT and CD45.2+Tet2+/− from mice exposed to PBS or IL-1α in a 50:50 BM competition in vivo setting with untreated CD45.1 WT BM cells (n = 6-7). (I) Percentage of CD45.2+ cells in indicated PB and BM (J) populations from in WT and Tet2+/− mice exposed to PBS or IL-1α (n = 6-7). (J) Depicted in the graphs are the fold variation values between indicated means. Data are a pool of at least 2 independent experiments. ∗P < .05, ∗∗P < .01, ∗∗∗P < .001, and ∗∗∗∗P < .0001 by a 1-way analysis of variation with Tukey correction. Error bars represent standard error of the mean. ns, not significant; WBM, whole bone marrow.
Tet2+/− HSPCs maintain higher proliferative and repopulation capacity than WT in response to long-term IL-1α. (A) Experimental design. (B) Number of total white blood cells in BM (2 femurs and 2 tibias) of WT and Tet2+/− mice exposed to PBS or IL-1α (n = 4-5). (C) Percentage of indicated BM populations in WT and Tet2+/− mice exposed to PBS or IL-1α (n = 4-5). (D) Representative fluorescence-activated cell sorting plot of cell cycle analysis of indicated populations; percentage per quadrant is indicated. Percentage of indicated BM populations in G0, G1, or S-G2-M phases of cell cycle from WT and Tet2+/− mice exposed to PBS or IL-1α (n = 4-5). Statistical analysis performed for G0 stage. (E) Experimental design. (F) Quantification of total colony numbers after plating (P)/replating (R) of WT and Tet2+/− LSK/total cells in methylcellulose after initial exposure to PBS or IL-1α (n = 3). (G) Experimental design. (H) Longitudinal quantification of percentage of donor-derived PB CD45.2+ WT and CD45.2+Tet2+/− from mice exposed to PBS or IL-1α in a 50:50 BM competition in vivo setting with untreated CD45.1 WT BM cells (n = 6-7). (I) Percentage of CD45.2+ cells in indicated PB and BM (J) populations from in WT and Tet2+/− mice exposed to PBS or IL-1α (n = 6-7). (J) Depicted in the graphs are the fold variation values between indicated means. Data are a pool of at least 2 independent experiments. ∗P < .05, ∗∗P < .01, ∗∗∗P < .001, and ∗∗∗∗P < .0001 by a 1-way analysis of variation with Tukey correction. Error bars represent standard error of the mean. ns, not significant; WBM, whole bone marrow.
Next, we tested the effect of IL-1α on WT and Tet2+/− HSPC in vivo repopulating capacity. For this purpose, BM chimeras carrying 50% CD45.1+ and 50% PBS or IL-1α–treated, WT or Tet2+/− CD45.2+ total BM cells were assessed longitudinally and terminally for CD45.2 chimerism (Figure 4G). As previously reported, we observed increased repopulating capacity in Tet2+/− PB CD45.2+ compared with WT in the PBS groups.11-13 Moreover, although IL-1α pretreatment reduced significantly PB CD45.2+ chimerism in all lineages in both genotypes, Tet2+/− cells were more resistant to this effect (Figure 4H-I). More important, terminal assessment of CD45.2+ chimerism in BM HSPCs revealed that although IL-1α–treated HSPCs were overall underrepresented, the fold reduction observed in WT HSPCs was of a much higher magnitude compared with Tet2+/− (Figure 4J). Collectively, these data demonstrate that Tet2+/− HSPCs maintain higher proliferative responses on long-term IL-1α exposure that result in a higher repopulation capacity compared with WT, thus contributing to an overall enhanced cellular competitive fitness in this setting.
Tet2+/− HSCs exposed to IL-1α upregulate proliferation and maintain self-renewal transcriptomic signatures
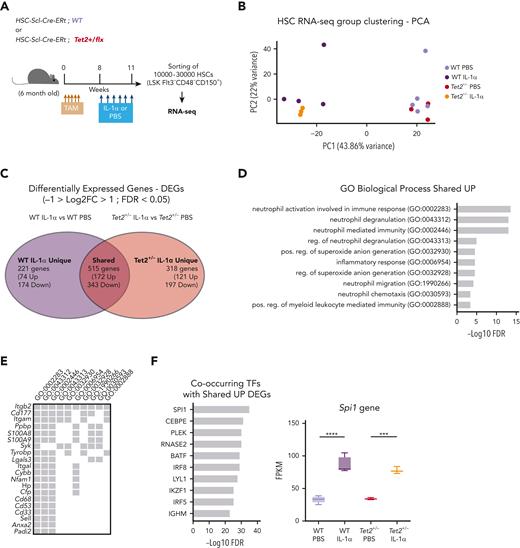
To gain more mechanistic insight into the differential effects of IL-1α exposure on WT and Tet2+/− HSCs, we performed bulk RNA sequencing on HSCs (LSK FLt3– CD48– CD150+) from triple-transgenic mice, carrying complete WT or Tet2+/− hematopoiesis and which were exposed for 14 days to PBS or IL-1α (Figure 5A). Principal component analysis of obtained transcriptomes revealed that in vivo PBS-treated HSC samples separate from IL-1α–treated ones, according to principal component 1, whereas IL-1α–treated WT further separate from IL-1α–treated Tet2+/− HSCs, according to principal component 2 (Figure 5B). To further characterize these transcriptomic alterations, we analyzed the differentially expressed genes (DEGs; −1 > log2 fold change > 1; false discovery rate < 0.05; supplemental Table 1) induced by IL-1α treatment in both WT and Tet2+/− genotypes. By intersecting DEGs induced by IL-1α in WT and Tet2+/− samples, we obtained DEGs that are unique to IL-1α–treated WT HSCs (221 genes), unique to IL-1α–treated Tet2+/− HSCs (318 genes), and shared by both genotypes on IL-1α treatment (515 genes; Figure 5C; supplemental Table 1). To gain insight into the functional and molecular characteristics of these DEG groups, we performed global gene ontology (GO) analysis. There were few GO terms related to biological processes (BPs) enriched in downregulated DEGs; however, there was a clear enrichment in GO BPs in the upregulated DEGs (supplemental Table 2). Accordingly, we observed that IL-1α induces myeloid differentiation gene expression in both WT and Tet2+/− HSCs (with enrichment in GO BPs implicated in neutrophil biology, inflammatory response, and myeloid differentiation; Figure 5D) that associate with increased expression of myeloid differentiation master transcription factor Spi1 and its downstream transcriptional program (Figure 5E-F). Strikingly, although there were no GO BPs enriched in DEGs unique to IL-1α–treated WT HSCs, Tet2+/− HSCs exposed to IL-1α showed an enrichment in BPs implicated in DNA replication initiation (associated with overexpression of Mcm2-4 and 10, Cdc6, and Orc1 genes), cell cycle progression (associated with increased e2f1 expression and downstream transcriptional program), and DNA repair pathways (associated with overexpression of Rad51, Rad51b, and Fanca/i genes) (Figure 5G-I). Of note, we also observed increased expression of genes implicated in proliferation in IL-1α–treated WT HSCs, albeit to a lower extent than observed in IL-1α–treated Tet2+/− HSCs (supplemental Figure 5A). More important, this higher proliferative response in IL-1α–treated Tet2+/− HSCs could not be clearly attributed to differences in gene expression of IL-1 pathway members (supplemental Figure 5B). Having observed that Tet2+/− HSPCs maintain a higher self-renewal and repopulation capacity on IL-1α treatment compared with WT counterparts (Figure 4E), we focused the analysis on genes implicated in HSC self-renewal.30-37 Although most genes were significantly downregulated in both WT and Tet2+/− HSCs on long-term IL-1α exposure (22 genes; eg, Gata3, Mllt3, and Mpo), we observed a set of 9 genes (eg, Mecom, Hmox1, and Plag1) that were significantly downregulated exclusively in IL-1α–treated WT HSCs (Figure 5J). These data suggest that long-term IL-1α treatment significantly impairs HSC self-renewal, as previously shown28; however, the data also reveal that Tet2+/− HSCs are more resistant to this impairment. Thus, our transcriptomic data together with functional data (Figure 4) indicate that long-term IL-1α exposure has a differential effect on WT and Tet2+/− HSCs, inducing higher proliferation and proliferative stress response in Tet2+/− HSCs while impairing more significantly the self-renewal capacity of WT HSCs.
IL-1α–exposed Tet2+/−HSCs upregulate proliferation and maintain self-renewal transcriptomic signatures. (A) Experimental design. (B) Principal component analysis (PCA) plot of WT HSCs treated with PBS (n = 5) or IL-1 (n = 4) and Tet2+/− HSCs treated with PBS (n = 3) or IL-1α (n = 3) based on regularized log gene-level counts. (C) Venn diagram depicting differentially expressed genes (DEGs; −1 > log2[fold change {FC}] > 1; false discovery rate [FDR] < 0.05) in HSCs exposed to IL-1α or PBS, which are unique to WT, unique to Tet2+/−, or shared between the 2 groups. (D) Overrepresented GO BP terms (maximum of 10 terms) for upregulated DEGs, shared between WT and Tet2+/− HSCs exposed to IL-1α. GO BPs are displayed in ascending order, according to –logFDR value. (E) Upregulated shared DEGs (maximum of 20 genes) present in indicated overrepresented GO BPs. (F) Co-occurring transcription factors (TFs; maximum of 10) with shared UP DEGs. TFs are displayed in ascending order, according to –logFDR value. Boxplot Spi1 gene expression values (fragments per kilobase million [FPKMs]) in indicated groups (right). (G) Overrepresented GO BP terms (maximum of 10 terms) for upregulated DEGs unique to Tet2+/− HSCs exposed to IL-1α. GO BPs are displayed in ascending order, according to –logFDR value. (H) Upregulated DEGs (maximum of 20 genes) unique to Tet2+/− IL-1α group present in indicated overrepresented GO BPs. (I) Co-occurring TFs (maximum of 10) with upregulated DEGs unique to Tet2+/− IL-1α group. TFs are displayed in ascending order, according to –logFDR value. Boxplot of E2f1 gene expression values (FPKMs) in indicated groups (right). (J) Heat map showing expression of genes implicated in HSC self-renewal. Column Z-scores are normalized. All genes displayed are significantly downregulated between PBS and IL-1α conditions, independently of HSC genotype (first gene set); PBS and IL-1α condition in WT HSCs (second gene set); and PBS and IL-1α condition in Tet2+/− HSCs (third gene set). ∗P < .05, ∗∗P < .01, ∗∗∗P < .001, and ∗∗∗∗P < .0001 by a 1-way analysis of variance with Tukey correction. RNA-seq, RNA sequencing.
IL-1α–exposed Tet2+/−HSCs upregulate proliferation and maintain self-renewal transcriptomic signatures. (A) Experimental design. (B) Principal component analysis (PCA) plot of WT HSCs treated with PBS (n = 5) or IL-1 (n = 4) and Tet2+/− HSCs treated with PBS (n = 3) or IL-1α (n = 3) based on regularized log gene-level counts. (C) Venn diagram depicting differentially expressed genes (DEGs; −1 > log2[fold change {FC}] > 1; false discovery rate [FDR] < 0.05) in HSCs exposed to IL-1α or PBS, which are unique to WT, unique to Tet2+/−, or shared between the 2 groups. (D) Overrepresented GO BP terms (maximum of 10 terms) for upregulated DEGs, shared between WT and Tet2+/− HSCs exposed to IL-1α. GO BPs are displayed in ascending order, according to –logFDR value. (E) Upregulated shared DEGs (maximum of 20 genes) present in indicated overrepresented GO BPs. (F) Co-occurring transcription factors (TFs; maximum of 10) with shared UP DEGs. TFs are displayed in ascending order, according to –logFDR value. Boxplot Spi1 gene expression values (fragments per kilobase million [FPKMs]) in indicated groups (right). (G) Overrepresented GO BP terms (maximum of 10 terms) for upregulated DEGs unique to Tet2+/− HSCs exposed to IL-1α. GO BPs are displayed in ascending order, according to –logFDR value. (H) Upregulated DEGs (maximum of 20 genes) unique to Tet2+/− IL-1α group present in indicated overrepresented GO BPs. (I) Co-occurring TFs (maximum of 10) with upregulated DEGs unique to Tet2+/− IL-1α group. TFs are displayed in ascending order, according to –logFDR value. Boxplot of E2f1 gene expression values (FPKMs) in indicated groups (right). (J) Heat map showing expression of genes implicated in HSC self-renewal. Column Z-scores are normalized. All genes displayed are significantly downregulated between PBS and IL-1α conditions, independently of HSC genotype (first gene set); PBS and IL-1α condition in WT HSCs (second gene set); and PBS and IL-1α condition in Tet2+/− HSCs (third gene set). ∗P < .05, ∗∗P < .01, ∗∗∗P < .001, and ∗∗∗∗P < .0001 by a 1-way analysis of variance with Tukey correction. RNA-seq, RNA sequencing.
Genetic and pharmacologic blockage of IL-1–IL-1R1 signaling reduces Tet2+/− clonal expansion during aging
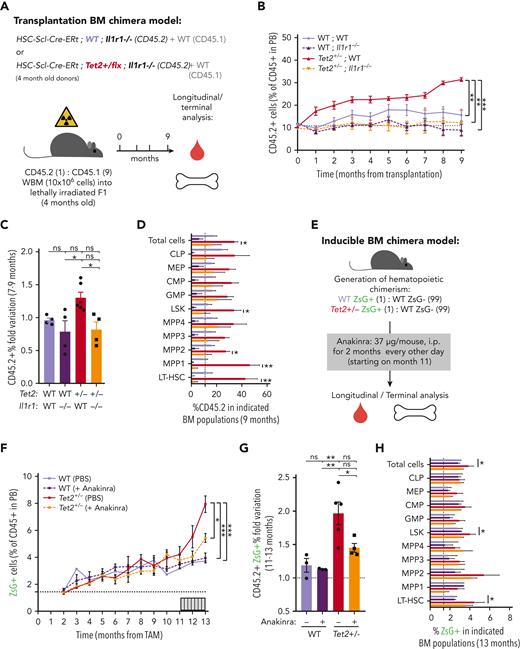
To validate IL-1 as a mediator of WT and Tet2+/− HSPC cellular responses in the context of physiological aging, we evaluated the functional parallels between young HSPCs exposed to IL-1α and aged HSPCs. Accordingly, as observed for young animals exposed to IL-1α (see above), there was a significant increase in PB white blood cell counts, particularly in neutrophils (supplemental Figure 4D-E) and increased frequencies of BM LSKs, LT-HSCs, MPP1s, and MPP3s (supplemental Figure 4F-G) in aged Tet2+/− triple-transgenic mice compared with WT. Moreover, as for IL-1–exposed young animals, there was a significant increase in the proliferative activity of aged Tet2+/− LT-HSC, MPP1, and MPP3 populations compared with their aged WT counterparts (supplemental Figure 4H). These data suggest that in the context of both artificial IL-1α exposure in young mice and physiological inflammaging, Tet2+/− HSPCs show higher clonal fitness. We then tested whether the previously observed increase in Tet2+/− clonal expansion on aging (Figure 2A-E) could be prevented by IL-1R1 genetic ablation. Accordingly, we generated transplantation BM chimeras carrying 90% CD45.1+ and 10% WT; WT, WT; Il1r1–/–, Tet2+/−; WT or Tet2+/−; Il1r1–/– CD45.2+ total BM cells and longitudinally and terminally assessed CD45.2 chimerism upon aging (Figure 6A). As for the inducible BM chimera model, we observed a significant peripheral expansion of the IL-1R1–expressing Tet2+/− hematopoietic clone over time (Figure 6B), which occurred in multiple lineages (B cells and myeloid cells; supplemental Figure 6A). Of note, we observed 2 separate phases of Tet2+/− expansion: an initial expansion within the first 2 months after transplantation (possibly resulting from irradiation-derived inflammation), which is not observed in the inducible model; and a later expansion between months 7 and 9, which is shared with the inducible model (Figure 6C). Strikingly, both expansion phases were completely abrogated in the absence of IL-1R1 on hematopoietic cells (Figure 6B). More important, expansion of the IL-1R1–expressing Tet2+/− hematopoietic clone was also evident in BM HSPCs, whereas it was completely abrogated in the absence of IL-1R1 (LSKs, MPP1-2, and LT-HSCs; Figure 6D), further establishing IL-1–IL-1R1 is a key pathway driving Tet2+/− clonal expansion during aging.
Genetic and pharmacologic blockage of IL-1–IL-1R1 signaling reduces Tet2+/−clonal expansion during aging. (A) Experimental design. (B) Longitudinal quantification of the percentage of donor-derived peripheral blood (PB) CD45.2+ cells from indicated genotypes: WT; WT, WT; Ilr1–/–, Tet2+/−; WT and Tet2+/−; Ilr1–/–, over 9 months after transplantation (n = 4-6). (C) Fold variation (within 7- to 9-month period) in the percentage of donor-derived PB CD45.2+ cells from indicated genotypes. (D) Terminal assessment of the percentage of donor-derived BM populations from indicated genotypes. (E) Experimental design. (F) Longitudinal quantification of the percentage of CD45+ WT ZsG+ and CD45+Tet2+/− ZsG+ in PB of mice exposed to PBS or anakinra treatment (hIL1ra) (n = 3-5). (G) Fold variation (within 11-13 months) in the percentage of CD45+ WT ZsG+ and CD45+Tet2+/− ZsG+ cells in PB of mice exposed to PBS or hIL1ra (n = 3-5). (H) Percentage of WT ZsG+ and Tet2+/− ZsG+ on indicated BM populations after PBS or anakinra treatment (n = 3-5). ∗P < .05, ∗∗P < .01, ∗∗∗P < .001, and ∗∗∗∗P < .0001 by unpaired t-test (within the same genotype; D and H) or by a 1-way analysis of variance with Tukey correction (last time point on B, C, F, and G). Error bars represent standard error of the mean. ns, not significant; WBM, whole bone marrow.
Genetic and pharmacologic blockage of IL-1–IL-1R1 signaling reduces Tet2+/−clonal expansion during aging. (A) Experimental design. (B) Longitudinal quantification of the percentage of donor-derived peripheral blood (PB) CD45.2+ cells from indicated genotypes: WT; WT, WT; Ilr1–/–, Tet2+/−; WT and Tet2+/−; Ilr1–/–, over 9 months after transplantation (n = 4-6). (C) Fold variation (within 7- to 9-month period) in the percentage of donor-derived PB CD45.2+ cells from indicated genotypes. (D) Terminal assessment of the percentage of donor-derived BM populations from indicated genotypes. (E) Experimental design. (F) Longitudinal quantification of the percentage of CD45+ WT ZsG+ and CD45+Tet2+/− ZsG+ in PB of mice exposed to PBS or anakinra treatment (hIL1ra) (n = 3-5). (G) Fold variation (within 11-13 months) in the percentage of CD45+ WT ZsG+ and CD45+Tet2+/− ZsG+ cells in PB of mice exposed to PBS or hIL1ra (n = 3-5). (H) Percentage of WT ZsG+ and Tet2+/− ZsG+ on indicated BM populations after PBS or anakinra treatment (n = 3-5). ∗P < .05, ∗∗P < .01, ∗∗∗P < .001, and ∗∗∗∗P < .0001 by unpaired t-test (within the same genotype; D and H) or by a 1-way analysis of variance with Tukey correction (last time point on B, C, F, and G). Error bars represent standard error of the mean. ns, not significant; WBM, whole bone marrow.
Finally, we aimed at targeting the IL-1 dependency of Tet2+/− clonal hematopoiesis progression in a preclinical therapeutic setting. For this, we used noninjected triple-transgenic mice carrying minor (≈2%) WT or Tet2+/− ZsG+ clonal fractions, to mimic the smaller clonal fractions observed in individuals with CHIP,2 and aged them for ≈1 year. To target the IL-1 pathway, aged WT and Tet2+/− chimeric mice were treated with the clinically approved human IL-1R1 antagonist (anakinra) every other day from the 11th to the 13th month of age, and longitudinal/terminal quantification of ZsG+ WT and ZsG+Tet2+/− clonal fraction in PB CD45+ cells and BM HSPCs was preformed, respectively (Figure 6E). As expected, we observed an expansion of Tet2+/− PB CD45+ cells and total BM cells as well as LSKs and LT-HSCs (Figure 6F-H). More important, anakinra treatment significantly decreased Tet2+/− clonal expansion in PB CD45+ cells (Figure 6F-G) and in all hematopoietic lineages (supplemental Figure 6B), thus confirming the direct contribution of the IL-1 pathway in promoting Tet2+/− clonal expansion during aging via enhanced multilineage differentiation. Interestingly, the anakinra regimen used was not sufficient to fully prevent Tet2+/− HSPC clonal expansion (Figure 6H), suggesting that the anakinra treatment doses and timing used were not sufficient to revert an already established clonal dominance. Collectively, these data confirm the direct dependency of Tet2+/−-mediated clonal hematopoiesis on the IL-1 pathway during aging and highlight inflammaging as a therapeutically targetable driver of CHIP.
Discussion
TET2 heterozygous loss-of-function mutations are frequent in CHIP (about 10%-30% prevalence) and are predicted to have high expansion rates (10% increase in mean VAF per year1-3,7). Higher TET2 mutant clone sizes associate with higher risk of progression to AML (VAF > 10%)6 and mortality from heart failure (VAF > 2%).38 Herein, we addressed which cooperating cell-extrinsic factors might be major drivers of Tet2+/− clonal expansion during aging. We demonstrate the following: (a) murine Tet2+/− clonal expansion rates increase with age and associate with increased BM levels of myeloid-derived inflammatory cytokine IL-1; (b) IL-1 signaling on HSPCs via IL-1R1 directly drives Tet2+/− clonal expansion via increased multilineage differentiation; (c) aged or IL-1–exposed young Tet2+/− HSPCs maintain a higher proliferative and repopulation capacity than WT HSPCs; and (d) genetic and pharmacologic blockage of IL-1–IL-1R1 signaling reduces Tet2+/− clonal expansion during aging.
In vivo assessment of inflammatory cues acting throughout aging calls for a careful CHIP mouse model choice. Currently, most CHIP mouse models rely on BM transplantation following high-dose irradiation and inevitably increased inflammatory milieus.16,24,39 Although alternatives have been established via adoptive transfer of unfractionated BM cells into nonirradiated mice, these models are limited by a fixed availability of BM niche space and, thus, restricted starting clonal fractions.40,41 To circumvent these limitations, we established a triple-transgenic mouse model of unperturbed Tet2+/− clonal hematopoiesis (HSC-SCL-Cre-ERT; Tet2+/flox; R26+/tm6[CAG-ZsGreen1]Hze), where titratable and traceable Tet2+/− hematopoietic clonal fractions can be induced via a single tamoxifen injection. Indeed, this approach revealed a Tet2+/− clonal expansion stage exclusive to advanced aged and associated with increased BM IL-1 levels, which contrasted with transplantation models where this was preceded by an initial, posttransplantation Tet2+/− expansion, potentially resulting from postradiation inflammation.
Increased IL-1 BM level, produced by different cellular sources, is a hallmark of hematopoietic inflammaging in mice.21,22,42 It results, as demonstrated by us recently, partially from hematopoietic sensing of increased circulating levels of microbiota derived TLR4 and TLR8 agonists upon aging.23 Moreover, in the context of CHIP, Tet2 loss-of-function mutations in myeloid cells result in increased proinflammatory responses, with reported increases in both IL-124,43 and IL-6 production,27 potentially adding inflammatory burden on aging. Herein, we identified upregulated BM IL-1 levels in mice carrying higher Tet2+/− hematopoietic clonal fractions and established the IL-1α–IL-1R1 axis as a direct driver of Tet2+/− clonal expansion in advanced aging. More important, we observed that BM myeloid Tet2+/− cells were significantly enhanced IL-1α producers on LPS exposure. These data suggest that in the context of aging, the synergy generated by an aging hematopoietic system exposed to increased circulating levels of microbiome signals together with an increasing fraction of mature cells with heterozygous Tet2 expression (which produce more IL-1) is a likely driver of the observed increased IL-1 levels in aged mice carrying Tet2+/− clonal hematopoiesis. More important, a recent screen for inflammatory markers in up to 22 092 individuals with CHIP revealed that increased IL-1β circulating levels associate significantly and exclusively with TET2 mutant CHIP, thus in parallel validating our mouse model findings of IL-1 as a likely relevant inflammatory determinant of TET2 CHIP in the human population.44
The effects of inflammatory pressure on the selection of HSPCs carrying CHIP mutations have been documented in multiple contexts.45 Indeed, microbiota bacterial translocation into circulation has been implicated in IL-6–mediated Tet2–/– preleukemic myeloproliferation14 and in TNF-α–mediated Tet2–/– chronic myelomonocytic leukemia in vivo growth.46 In addition, LPS treatment was shown to drive Tet2–/– clonal expansion via hyperactivation of the IL-6/Shp2/Stat3/long noncoding RNA–Morrbid axis, resulting in reduced apoptosis and a minor proliferative increase in Tet2–/– HSPCs.16 In another study, mycobacterium-induced interferon gamma was shown to select for Dnmt3a–/– HSCs, mostly due to reduced differentiation and apoptosis induction.47 Moreover, long-term IL-1β exposure was implicated in Cebpa–/– HSPCs (mainly MPP3) selection via activation of a self-renewal over a myeloid differentiation gene program.48 Herein, we show that although continuous IL-1α exposure had no effect on WT or Tet2+/− HSPC apoptosis, it led to an IL-1R1–dependent increased proliferative response in Tet2+/− HSPCs (mainly LT-HSCs, MPP1s, and MPP3s), which associated with increased DNA replication, DNA repair, and proliferative stress transcriptomic signatures in HSCs. Indeed, IL-1 can stimulate HSC proliferation, driving their myeloid differentiation at the expense of self-renewal, thus eroding their repopulating capacity.28,49,50 According to our data, this IL-1–mediated proliferative response resulted in increased differentiation of Tet2+/− over WT HSPCs, leading to expansion of the Tet2+/− clone in all blood lineages. More important, although HSPC self-renewal and repopulation capacity were reduced in both genotypes after IL-1 exposure, Tet2+/− cells were more resistant to this effect. This likely results from a higher basal level of self-renewal, repopulation capacity, and general fitness reported in Tet2 loss-of-function HSPCs.11-13 In agreement with this hypothesis, we observed that Tet2+/− HSCs maintained a higher expression of a restricted set of genes implicated in HSC self-renewal compared with WT HSCs. However, the exact in-depth molecular mechanisms by which Tet2+/− HSCs display differential differentiating and self-renewing proliferative responses to IL-1 compared with WT remain to be elucidated.
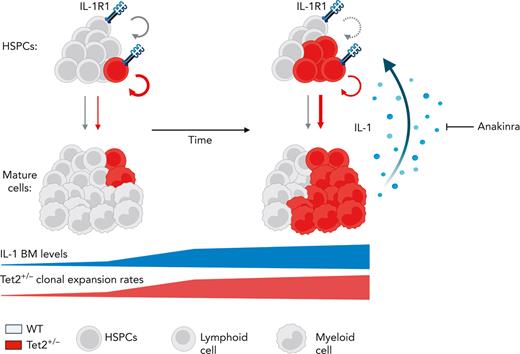
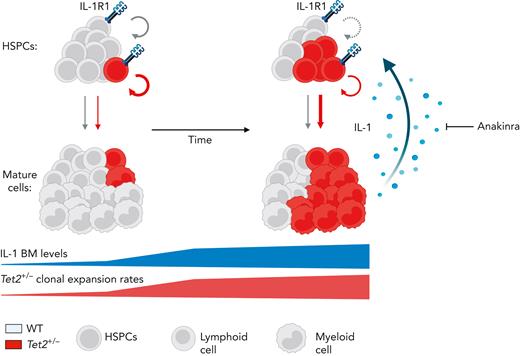
Our study demonstrates a critical role for aging-derived IL-1 in promoting Tet2+/− clonal hematopoiesis progression. We, therefore, propose an integrative working model (Figure 7) where upon aging, and in the presence of an initially minor Tet2+/− hematopoietic clone, there is a progressive increase of BM cytokine levels, particularly IL-1. IL-1 is sensed directly by the HSPC pool via IL-1R1 and favors the dominance of Tet2+/− HSPCs via enhanced proliferation and differentiation into mature blood cells, increasing Tet2+/− cell frequency over WT cells. Given their exacerbated proinflammatory responses, mature Tet2+/− myeloid cells contribute to higher IL-1 levels. Over time, this proinflammatory vicious cycle results in the expansion of intrinsically more self-renewing Tet2+/− over WT HSPCs. Interestingly, this model represents a prototypical case of adaptative oncogenesis,51,52 whereby the oncogenic Tet2 mutation, by endowing mutant HSPCs more resistant to the deleterious effects of high IL-1 levels, increases cellular fitness exclusively in the context of an aged and inflammatory environment, whereas the same mutation in a younger and noninflammatory milieu is less selectively expanded. Further supporting this notion, hematological malignancies that frequently carry TET2 founding mutations, such as MDS and AML, display dependencies on IL-1 signaling.53-55 Whether this IL-1 dependency is exclusive to TET2 mutant AML remains to be determined. Interestingly, during the revision of our article, Burns et al reported that progression of Tet2–/– hematopoiesis into myeloid malignancy is abrogated in the absence of Il1r1,56 which aligns with our findings. However, it remains to be determined whether acquisition of additional age-associated driver mutations (eg, co-occurring mutation in fms-related tyrosine kinase 3 [Flt3]57) synergizes with Tet2 loss of function and with the IL-1R1 pathway to drive clonal expansion and leukemogenesis.
Model of IL-1–mediated inflammaging as a driver of Tet2+/−clonal hematopoiesis. Working model on positive feedback loop driving development of aberrant Tet2+/− hematopoiesis induced by inflammaging-derived IL-1. Increased IL-1 levels derived from aged Tet2+/− mature myeloid cells act directly on HSPCs favoring Tet2+/− HSPC expansion (circular arrows), repopulation capacity, and multilineage differentiation (linear arrows) over WT HSPCs. IL-1–mediated Tet2+/− clonal expansion can be modulated by the administration of IL-1R1 antagonist (anakinra). See Discussion for detailed explanation.
Model of IL-1–mediated inflammaging as a driver of Tet2+/−clonal hematopoiesis. Working model on positive feedback loop driving development of aberrant Tet2+/− hematopoiesis induced by inflammaging-derived IL-1. Increased IL-1 levels derived from aged Tet2+/− mature myeloid cells act directly on HSPCs favoring Tet2+/− HSPC expansion (circular arrows), repopulation capacity, and multilineage differentiation (linear arrows) over WT HSPCs. IL-1–mediated Tet2+/− clonal expansion can be modulated by the administration of IL-1R1 antagonist (anakinra). See Discussion for detailed explanation.
On the basis of our data using a human recombinant IL-1R antagonist, it is tempting to speculate that use of IL-1/IL-1R or inflammasome inhibitors might be of value in advanced human TET2 mutant CHIP or MDS. Of note, canakinumab, an IL-1β blocker, was particularly effective in reducing cardiovascular events in patients carrying hematopoietic TET2 mutations, although it is not reported if treatment also led to reduction of TET2 clone size.58 Our data suggest that although IL-1R1 genetic ablation completely abrogated Tet2+/− clonal expansion in the mature and HSPC compartments, IL-1R antagonist treatment prevented HSPC differentiation but did not revert an established clonal dominance in the HSPC pool. Although this might be partially addressed by increasing treatment dose and duration, it is possible that reversion of Tet2+/− HSPC dominance in individuals with CHIP or MDS will require combination therapy. Indeed, combining IL-1 pathway inhibition with targeting of TET2 mutant hematopoiesis with hypomethylating agents59 or with vitamin C supplementation60 might represent future combinatory therapeutic alternatives.
In summary, we demonstrate a direct dependency of Tet2+/− clonal hematopoiesis on the IL-1 pathway during aging, further highlighting an oncogenic role for inflammaging and with this also opening a future potential therapeutic avenue for targeting Tet2 mutant hematopoiesis.
Acknowledgments
The authors thank Veronika Lysenko for technical assistance with experiments and Nicole Wildner and Angelina Oestmann for technical assistance with mouse colony management. The authors also thank Timothy Sykes, Lennart Opitz, and the Functional Genomic Centre Zurich sequencing team for technical assistance.
This work was supported by research grants from the Swiss National Science Foundation (310030B_16673/1 and 310030_184747/1 [M.G.M.])
Authorship
Contribution: F.C. designed and performed experiments, analyzed data, and wrote the manuscript; L.V.K., N.G.G., and J.F. performed experiments and analyzed data; S.B. supervised research; and M.G.M. designed and supervised research and wrote the manuscript.
Conflict-of-interest disclosure: The authors declare no competing financial interests.
Correspondence: Markus G. Manz, Department of Medical Oncology and Hematology, Comprehensive Cancer Center Zurich, University of Zurich and University Hospital Zurich, Raemistr 100, CH-8091 Zurich, Switzerland; e-mail: markus.manz@usz.ch.
References
Author notes
The online version of this article contains a data supplement.
There is a Blood Commentary on this article in this issue.
The publication costs of this article were defrayed in part by page charge payment. Therefore, and solely to indicate this fact, this article is hereby marked “advertisement” in accordance with 18 USC section 1734.


![IL-1α–exposed Tet2+/−HSCs upregulate proliferation and maintain self-renewal transcriptomic signatures. (A) Experimental design. (B) Principal component analysis (PCA) plot of WT HSCs treated with PBS (n = 5) or IL-1 (n = 4) and Tet2+/− HSCs treated with PBS (n = 3) or IL-1α (n = 3) based on regularized log gene-level counts. (C) Venn diagram depicting differentially expressed genes (DEGs; −1 > log2[fold change {FC}] > 1; false discovery rate [FDR] < 0.05) in HSCs exposed to IL-1α or PBS, which are unique to WT, unique to Tet2+/−, or shared between the 2 groups. (D) Overrepresented GO BP terms (maximum of 10 terms) for upregulated DEGs, shared between WT and Tet2+/− HSCs exposed to IL-1α. GO BPs are displayed in ascending order, according to –logFDR value. (E) Upregulated shared DEGs (maximum of 20 genes) present in indicated overrepresented GO BPs. (F) Co-occurring transcription factors (TFs; maximum of 10) with shared UP DEGs. TFs are displayed in ascending order, according to –logFDR value. Boxplot Spi1 gene expression values (fragments per kilobase million [FPKMs]) in indicated groups (right). (G) Overrepresented GO BP terms (maximum of 10 terms) for upregulated DEGs unique to Tet2+/− HSCs exposed to IL-1α. GO BPs are displayed in ascending order, according to –logFDR value. (H) Upregulated DEGs (maximum of 20 genes) unique to Tet2+/− IL-1α group present in indicated overrepresented GO BPs. (I) Co-occurring TFs (maximum of 10) with upregulated DEGs unique to Tet2+/− IL-1α group. TFs are displayed in ascending order, according to –logFDR value. Boxplot of E2f1 gene expression values (FPKMs) in indicated groups (right). (J) Heat map showing expression of genes implicated in HSC self-renewal. Column Z-scores are normalized. All genes displayed are significantly downregulated between PBS and IL-1α conditions, independently of HSC genotype (first gene set); PBS and IL-1α condition in WT HSCs (second gene set); and PBS and IL-1α condition in Tet2+/− HSCs (third gene set). ∗P < .05, ∗∗P < .01, ∗∗∗P < .001, and ∗∗∗∗P < .0001 by a 1-way analysis of variance with Tukey correction. RNA-seq, RNA sequencing.](https://ash.silverchair-cdn.com/ash/content_public/journal/blood/141/8/10.1182_blood.2022016835/8/m_blood_bld-2022-016835-gr5b.jpeg?Expires=1769084338&Signature=ZwHthXMrMag4KYRKXJnYbAXv7sAh~GtqlqhXq4hdIYvgETPBwabonisxQ2u-RHojmOqG9QgGtcoFkpdIjCncefHBm65rbYo99FTub2XNWN7GN3eb-FMyCmjsd-7Sx0r2Yn~~AG6FLt2TDstvXPTUpq4RmcanwwhF3rLX2tosoBUe9X8oEMaq7xQRwgRri8FqwwMqj68ak7kFnq-ctUoqd6Z706X1-sFNeELt6GL6pzkzhg8CQWSATHaze5HjX4iI3tKRrbp-OIju86Hp5pjX6F~usGd-e4VDu7lcYLxp8rusCX6nqqHXSWeHtC~BydMKReUkgVu~Wp7~PEHAfGCrXA__&Key-Pair-Id=APKAIE5G5CRDK6RD3PGA)
This feature is available to Subscribers Only
Sign In or Create an Account Close Modal