

Key Points
STAT3-mutated patients have increased mutational burden and neutropenia, whereas select STAT3-activating mutations are associated with anemia.
Recurrent mutations in epigenetic and chromatin modifiers, especially KMT2D and SETD1B, co-occur with STAT3 mutations in LGL leukemia.

Abstract
Large granular lymphocyte (LGL) leukemia comprises a group of rare lymphoproliferative disorders whose molecular landscape is incompletely defined. We leveraged paired whole-exome and transcriptome sequencing in the largest LGL leukemia cohort to date, which included 105 patients (93 T-cell receptor αβ [TCRαβ] T-LGL and 12 TCRγδ T-LGL). Seventy-six mutations were observed in 3 or more patients in the cohort, and out of those, STAT3, KMT2D, PIK3R1, TTN, EYS, and SULF1 mutations were shared between both subtypes. We identified ARHGAP25, ABCC9, PCDHA11, SULF1, SLC6A15, DDX59, DNMT3A, FAS, KDM6A, KMT2D, PIK3R1, STAT3, STAT5B, TET2, and TNFAIP3 as recurrently mutated putative drivers using an unbiased driver analysis approach leveraging our whole-exome cohort. Hotspot mutations in STAT3, PIK3R1, and FAS were detected, whereas truncating mutations in epigenetic modifying enzymes such as KMT2D and TET2 were observed. Moreover, STAT3 mutations co-occurred with mutations in chromatin and epigenetic modifying genes, especially KMT2D and SETD1B (P < .01 and P < .05, respectively). STAT3 was mutated in 50.5% of the patients. Most common Y640F STAT3 mutation was associated with lower absolute neutrophil count values, and N647I mutation was associated with lower hemoglobin values. Somatic activating mutations (Q160P, D170Y, L287F) in the STAT3 coiled-coil domain were characterized. STAT3-mutant patients exhibited increased mutational burden and enrichment of a mutational signature associated with increased spontaneous deamination of 5-methylcytosine. Finally, gene expression analysis revealed enrichment of interferon-γ signaling and decreased phosphatidylinositol 3-kinase–Akt signaling for STAT3-mutant patients. These findings highlight the clinical and molecular heterogeneity of this rare disorder.
Medscape Continuing Medical Education online
In support of improving patient care, this activity has been planned and implemented by Medscape, LLC and the American Society of Hematology. Medscape, LLC is jointly accredited by the Accreditation Council for Continuing Medical Education (ACCME), the Accreditation Council for Pharmacy Education (ACPE), and the American Nurses Credentialing Center (ANCC), to provide continuing education for the healthcare team.
Medscape, LLC designates this Journal-based CME activity for a maximum of 1.0 AMA PRA Category 1 Credit(s)™. Physicians should claim only the credit commensurate with the extent of their participation in the activity.
Successful completion of this CME activity, which includes participation in the evaluation component, enables the participant to earn up to 1.0 MOC points in the American Board of Internal Medicine's (ABIM) Maintenance of Certification (MOC) program. Participants will earn MOC points equivalent to the amount of CME credits claimed for the activity. It is the CME activity provider's responsibility to submit participant completion information to ACCME for the purpose of granting ABIM MOC credit.
All other clinicians completing this activity will be issued a certificate of participation. To participate in this journal CME activity: (1) review the learning objectives and author disclosures; (2) study the education content; (3) take the post-test with a 75% minimum passing score and complete the evaluation at http://www.medscape.org/journal/blood; and (4) view/print certificate. For CME questions, see page 3100.
Disclosures
Associate Editor Freda K. Stevenson declares no competing financial interests. CME questions author Laurie Barclay owns stock, stock options, or bonds from the following ineligible company: AbbVie Inc (former).
Learning objectives
Upon completion of this activity, participants will:
- 1.
Describe nonsynonymous somatic variants in large granular lymphocyte (LGL) leukemia exomes, potential differences of these mutational profiles across LGL leukemia subtypes, and potential associations of mutational groups with clinical features, according to a paired exome and transcriptome study of LGL leukemia
- 2.
Determine shared and unique molecular characteristics of LGL leukemia subtypes (T-LGL, where cells express αβ T-cell receptor [TCR], and GD-LGL, where cells express TCRγδ) based on putative driver genes; and the transcriptomic and somatic mutational landscape of STAT3-mutated patients compared with STAT3 wild type to identify their distinct molecular signatures and STAT3-mutation–specific clinical associations, according to a paired exome and transcriptome study of LGL leukemia
- 3.
Identify clinical implications of mutations and clinical features associated with LGL leukemia, according to a paired exome and transcriptome study of LGL leukemia
Release date: May 19, 2022; Expiration date: May 19, 2023
Introduction
Large granular lymphocyte (LGL) leukemia is a rare lymphoproliferative disorder of primarily CD8+ T- or natural killer (NK)-cell lineage usually manifested in elderly patients.1,2 T-LGL accounts for 85% of all LGL cases.3 NK-LGL, or chronic lymphoproliferative disorder of NK cells,4 affects ∼10% of the patients. The majority of T-LGL cells express T-cell receptor αβ (TCRαβ; hereafter referred to as T-LGL), and few express TCRγδ (hereafter referred to as GD-LGL).5,6
One-third of LGL patients are asymptomatic at the time of presentation, and the remaining two-thirds display symptoms related to neutropenia, such as oral ulcers and recurrent infections.2 Asymptomatic anemia is also frequently observed during routine blood exams, and transfusion dependence is seen in 10% to 30% of cases. Patients are diagnosed based on the presence of expanded clonal T or NK cells. Treatment is noncurative and includes immunosuppressives such as methotrexate, cyclophosphamide, and cyclosporine.7
Somatic activating STAT3 mutations are observed in 28% to 75% of T-LGL and 30% to 48% NK-LGL leukemia patients.8-11STAT5B mutations are infrequently observed in LGL in general but commonly detected in rare CD4+ variants.12,13 Patients with STAT3 mutations exhibit lower absolute neutrophil counts (ANC), whereas the association with anemia is variable in the literature.8,14-17 Since the discovery of STAT3 mutations, 3 small-scale whole-exome sequencing (WES) studies have been reported for 16 T-LGL and 3 NK-LGL, 4 NK-LGL, and 13 NK-LGL cases,18-20 along with our report of 7 whole genomes in NK-LGL with a main emphasis on TET2 biology.21 Exome sequencing studies have not been reported for the GD-LGL subtype. Mutations in genes that are frequently altered in clonal hematopoiesis of indeterminate potential (CHIP) such as TET2 and DNMT3A have been reported in LGL leukemia.19-23 However, their prevalence and effect on the rest of the genomic landscape remain unclear.
In the present study, we completed the most extensive paired exome and transcriptome study of LGL leukemia to date with 105 patients, composed of T-LGL (n = 93) and GD-LGL (n = 12) subtypes. We defined the landscape of nonsynonymous somatic variants in LGL leukemia exomes, asked whether these mutational profiles differed across LGL leukemia subtypes, and tested whether mutational groups were associated with clinical features. We identified putative driver genes and used them to determine the shared and unique molecular characteristics of T- and GD-LGL leukemia subtypes. Finally, we compare the transcriptomic and somatic mutational landscape between STAT3-mutated and –wild-type (WT) patients to reveal their distinct molecular signatures and STAT3 mutation–specific clinical associations.
Methods
Patient selection and sample processing
The study was conducted under institutional review board–approved protocols for the LGL Leukemia Registry at the University of Virginia School of Medicine. One hundred five T-LGL leukemia patients (CD8+ TCRαβ and TCRγδ; no CD4+) meeting diagnosis criteria by the World Health Organization4 (evidence of clonality, persistence of chronic expansion >6 months) were recruited for this study. See supplemental Methods for additional details (available on the Blood Web site).
WES and data processing
WES samples were sequenced by Tempus (Chicago, IL) to a target depth of 100× and 200× for the normal (saliva) and the leukemic (peripheral blood mononuclear cell [PBMC]) genome, respectively, using an Illumina HiSeq.24 The paired-end sequences were aligned with Novoalign (Novocraft, Selangor, Malaysia) to an in-house g1k_v37_novoindex of human genome version GRCh37. Capture probes from Integrated DNA Technologies’ xGen Exome Research Panel were used, and samples were prepped using the KAPA HyperPrep Kit as described previously.24
The somatic mutations were identified using Mutect2 in the Genome Analysis Toolkit25 v4.1.2.0, following Genome Analysis Toolkit best practices. Additionally, databases of known cancer mutations from COSMIC v77 and known population polymorphisms from dbSNP v138 were used as a whitelist and blacklist, respectively, during somatic variant calling. The low-quality variants were filtered away, and the variant call format files were annotated with Ensembl’s Variant Effect Predictor.26 Annotated variant call format files were converted to mutation annotation format using vcf2maf.27
RNA sequencing (RNA-seq) and data processing
RNA libraries were constructed and sequenced (Tempus) as described previously.24 Samples were hybridized with Integrated DNA Technologies’ xGen Exome Research Panel followed by amplification using a KAPA HiFi Library Amplification Kit.24 The RNA libraries were sequenced to obtain at least 50 million reads on an Illumina HiSeq 4000.
Results
Somatic variants within and across LGL disease subtypes and their association with clinical phenotypes are incompletely defined by previous sequencing studies.18-20 To better understand the underlying molecular landscape of LGL leukemia, we collected saliva and peripheral blood specimens from 105 LGL patients, which included T-LGL (n = 93) and GD-LGL (n = 12). Genomic and transcriptomic analyses were performed after paired WES and leukemic bulk–RNA-seq. Patient demographics are summarized in supplemental Table 1. Detailed clinical annotations are provided in supplemental Table 2.
Landscape of somatic variants in LGL leukemia exomes
We focused our efforts on nonsilent variants to increase the likelihood of identifying changes that alter protein structure or function and contribute to disease pathogenesis. Paired saliva-leukemic WES of 105 individuals revealed a range of 1 to 169 (median: 45) nonsilent somatic variants per patient after high confidence filtering. There were no statistically significant differences between the 2 subtypes in either nonsilent mutation burden or mean affected gene count (range: 1-163; median: 45; Kruskal-Wallis test; nonsilent somatic variants, P = .475; mean affected gene count, P = .468) (Figure 1A-B). After excluding intron, 5′ flank, 3′ and 5′ untranslated region, intergenic region, and RNA mutation classes, 2717 genes were affected by these nonsilent mutations, with 76 genes being mutated in 3 or more patients (supplemental Table 3). Within these 76 genes, STAT3, KMT2D, PIK3R1, SULF1, EYS, and TTN (Figure 1C) were found to be mutated across T and GD subtypes. All somatic variants including silent variants are displayed in supplemental Table 4. We observed broad chromosomal arm-level somatic copy-number aberrations in 5 patients, with 22q and 3p amplifications observed in 2 patients in each category (supplemental Table 5). C>T and G>A base substitutions (seen in 50.5% of all single nucleotide variant events) dominated the somatic variant calls in this cohort (Figure 1D). Differences in the percent of C>T base substitutions were not statistically significant among the subtypes (P = .988) (Figure 1E). We also identified 1 patient (1822 GD-LGL) with many mutations within microsatellites (microsatellite instability [MSI]-high; MSIsensor score >3.5; Figure 1F), though MSI scores were not significantly different among the 2 LGL subtypes (P = .339). Additionally, we used signeR to determine that the cohort was enriched for the SBS1 signature.28 The C>T mutations dominate the SBS1 signature at CpG dinucleotides. This likely represents deamination of 5-methylcytosine at CpG dinucleotides, leading to T:G mismatches that are not repaired before DNA replication.29 The relative contribution of the SBS1 signature was not significantly different between the 2 LGL subtypes (P = .427) (Figure 1G). Together, these results show that multiple genomic level changes and somatic variants were shared between T and GD subtypes.
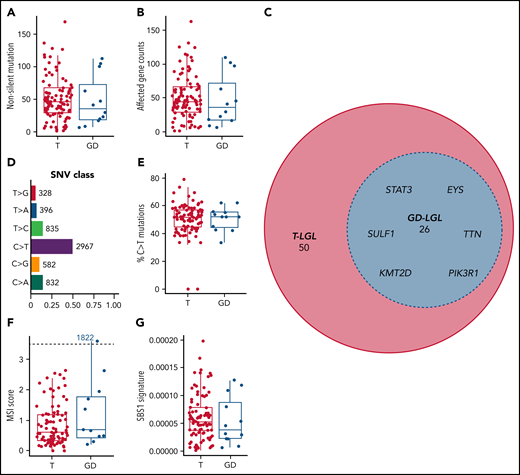
Mutational characteristics of T and GD LGL leukemia subtypes. (A-B) Nonsilent mutation burden and affected gene counts in T and GD subtypes. (C) Euler diagram of genes that are mutated in at least 3 patients, sectioned by LGL subtypes. Genes that are mutated in 4 or more patients and are shared between T and GD-LGL (blue area) are labeled. (D-E) Single nucleotide variant class in the cohort and percent C>T mutation comparison in T and GD subtypes. (F-G) Microsatellite instability scores and SBS1 signature contributions in T and GD subtypes.
Mutational characteristics of T and GD LGL leukemia subtypes. (A-B) Nonsilent mutation burden and affected gene counts in T and GD subtypes. (C) Euler diagram of genes that are mutated in at least 3 patients, sectioned by LGL subtypes. Genes that are mutated in 4 or more patients and are shared between T and GD-LGL (blue area) are labeled. (D-E) Single nucleotide variant class in the cohort and percent C>T mutation comparison in T and GD subtypes. (F-G) Microsatellite instability scores and SBS1 signature contributions in T and GD subtypes.
Identification and function of putative driver mutations
We used a driver analysis approach30 to identify 15 genes with putative roles (“putative drivers”) in the etiology of LGL leukemia out of the 76 genes that were mutated in 3 or more patients (Figure 2A; supplemental Figure 1). Thus, only a select few genes with nonsilent mutations were identified by our analysis pipeline as putative drivers. STAT3 was by far the most frequently mutated gene across all LGL subtypes, with nonsilent mutations in 53 out of 105 patients (50.5%). Putative drivers that passed the loss-of-function transcript effect estimator filter to identify loss-of-function mutations are annotated in supplemental Table 6. These included several genes encoding epigenetic modifiers (KMT2D, KDM6A, TET2, and DNMT3A). Putative drivers that interact with the STAT3-signaling pathway (TNFAIP3, PIK3R1, and FAS) were also identified. Of note, TNFAIP3 mutations in our cohort did not overlap with previously reported mutations in LGL leukemia.31 These 9 frameshift and nonsense mutations spanned across the gene and were identified as high-confidence loss-of-function mutations (supplemental Table 6). Another putative driver, ABCC9, has a known role as a potassium channel and is a STAT3 target gene.32STAT5B mutations were detected in far fewer samples than STAT3 as previously described.12 Kyoto Encyclopedia of Genes and Genomes pathways that are recurrently altered by nonsilent mutations in the cohort (Figure 2B) include the pathways involved in cancer, including pancreatic cancer and acute myeloid leukemia. Additional pathways include genes involved in JAK-STAT signaling, chemokine signaling, and cytokine-cytokine receptor interaction.
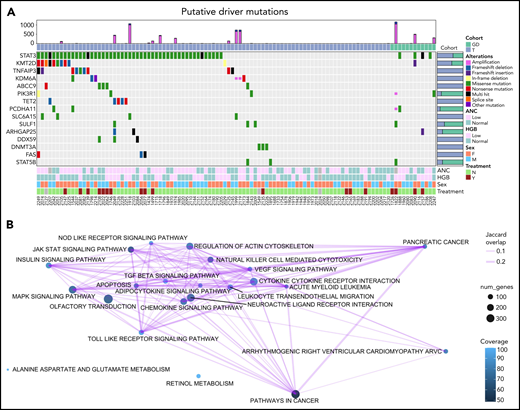
Oncoplot of putative drivers in LGL leukemia. (A) Seven different driver analysis tools identified 15 gene variants with putative driver roles present in at least 3 LGL leukemia samples. Each row represents 1 of the 15 putative drivers, whereas the columns represent individual patients. LGL disease cohorts are color coded at the top. Type of alteration in putative driver genes is indicated by the colored boxes, which are defined under “Alterations,” and gray indicates WT. The top bar graph shows the number of amplification and deletion events. Right bar graph shows the distribution of variants for a given gene across the 2 LGL cohorts. Bottom annotations represent clinical phenotypes of individual patients, with color definitions found in the rightmost annotation. ANC values above 1.5k/µl and HGB values above 12 are annotated as “Normal,” and anything below is “Low.” Treatment indicates if patients were on LGL treatment (methotrexate, cyclophosphamide, or cyclosporine) at the time of sample acquisition. Unknown values are colored in gray. (B) Kyoto Encyclopedia of Genes and Genomes pathway analysis of somatic mutations observed in the cohort using SLAPenrich. The size of the nodes represents the number of genes in the cohort observed in the pathway. The color of the nodes represents the percent of those genes that uniquely belong in each pathway. The thickness of the edges represents the Jaccard index between the nodes.
Oncoplot of putative drivers in LGL leukemia. (A) Seven different driver analysis tools identified 15 gene variants with putative driver roles present in at least 3 LGL leukemia samples. Each row represents 1 of the 15 putative drivers, whereas the columns represent individual patients. LGL disease cohorts are color coded at the top. Type of alteration in putative driver genes is indicated by the colored boxes, which are defined under “Alterations,” and gray indicates WT. The top bar graph shows the number of amplification and deletion events. Right bar graph shows the distribution of variants for a given gene across the 2 LGL cohorts. Bottom annotations represent clinical phenotypes of individual patients, with color definitions found in the rightmost annotation. ANC values above 1.5k/µl and HGB values above 12 are annotated as “Normal,” and anything below is “Low.” Treatment indicates if patients were on LGL treatment (methotrexate, cyclophosphamide, or cyclosporine) at the time of sample acquisition. Unknown values are colored in gray. (B) Kyoto Encyclopedia of Genes and Genomes pathway analysis of somatic mutations observed in the cohort using SLAPenrich. The size of the nodes represents the number of genes in the cohort observed in the pathway. The color of the nodes represents the percent of those genes that uniquely belong in each pathway. The thickness of the edges represents the Jaccard index between the nodes.
Out of 15 putative driver genes, select candidates demonstrated high potential impact on LGL pathogenesis based on previous literature and the occurrence of hotspot mutations (Figure 3). We observed high-confidence loss-of-function mutations across the coding region of KMT2D, the second most frequently mutated driver gene (Figures 2 and 3A). KMT2D encodes histone H3 lysine 4 mono-methyltransferase and is thought to be a tumor suppressor as loss of Kmt2d is shown to promote lung tumorigenesis33 and increase incidence of germinal center–derived lymphomas in mice.34 Additionally, we detected nonsense, frameshift, and missense mutations in the death domain of FAS in 3 T-LGL patients (Figure 3B). Somatic mutations in this domain are associated with a related disorder, autoimmune lymphoproliferative syndrome, characterized by lymphoid precursor resistance to Fas-mediated apoptosis.35,36 Finally, we observed 3 distinct mutations affecting the inter-SH2 domain of PIK3R1 (Figure 3C). Specifically, the mutations were detected in 3 T-LGL patients (1 in-frame deletion at K448_L449del, 2 K567E mutations) and 1 GD-LGL patient (N564D mutation). Additional phosphatidylinositol 3-kinase (PI3K) family mutations were observed in PIK3CD, PIK3CA, PIK3AP1, PIK3R3, PIK3R4, and PIK3C2A (supplemental Table 7). These observations indicate that the somatic mutations in T-LGL patients frequently lead to aberrant PI3K signaling.
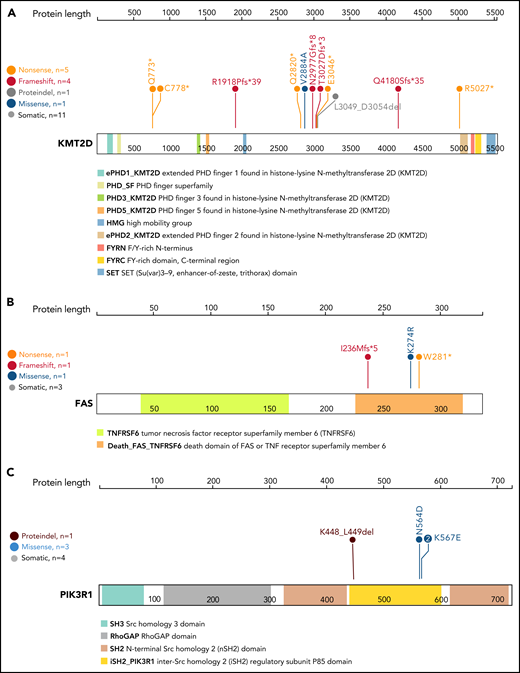
Lollipop plot of KMT2D, FAS, and PIK3R1 genes. Lollipop plot of (A) KMT2D, (B) FAS, and (C) PIK3R1 mutations detected in the 105-patient LGL leukemia cohort. Annotations for individual domains are described at the bottom. Domain information was curated from simple modular architecture research tool and conserved domain database.
Lollipop plot of KMT2D, FAS, and PIK3R1 genes. Lollipop plot of (A) KMT2D, (B) FAS, and (C) PIK3R1 mutations detected in the 105-patient LGL leukemia cohort. Annotations for individual domains are described at the bottom. Domain information was curated from simple modular architecture research tool and conserved domain database.
Other notable drivers included genes with known tumor-suppressor function in leukemia and solid cancers. Four T-LGL patients exhibited mutations in KDM6A, which encodes a lysine-specific demethylase with deleterious mutations previously reported in T-cell acute lymphoblastic leukemia and other cancers (supplemental Table 4).37-41 High-confidence loss-of-function mutations (S495Pfs*65, Y129Mfs*80, M90Hfs*24) in ARHGAP25, a GTPase-activating protein for Rac that is associated with tumor-suppressive functions,42,43 were observed for 2 T-LGL and 1 GD-LGL patient (supplemental Table 4).
Co-occurrence and mutual exclusivity of putative driver mutations
Comutation analysis was completed to identify putative redundant or cooperating molecular events. KMT2D mutation exhibited significant co-occurrence with STAT3 mutation, being observed in 10 out of 11 total KMT2D mutant patients (P = .0084; Figure 4A). SETD1B mutations also significantly co-occurred with STAT3 mutations (P = .027; Figure 4A). Furthermore, approximately half of the KMT2D-mutated samples showed similar variant allele frequencies (VAF) of KMT2D and STAT3 mutations, compatible with coexistence in the same clone (Figure 4B; see supplemental Figure 2 for analysis on all KMT2D-mutated samples). Three out of 6 SETD1B-mutated samples also showed coexistence in the same clone with STAT3 (Figure 4C). Of note, all 5 T-LGL patients with TET2 and STAT3 mutations had TET2 mutations in the same predicted clone as STAT3 based on VAF density clustering (supplemental Figure 3). No direct association with specific STAT3 amino acid change and TET2, KMT2D, or SETD1B mutation was observed (Figure 4B-C; supplemental Figure 3). The significant co-occurrence of STAT3 mutations with KMT2D, SETD1B, and TET2 mutations suggests that STAT3 activation may cooperate with epigenetic modifications in driving the disease.
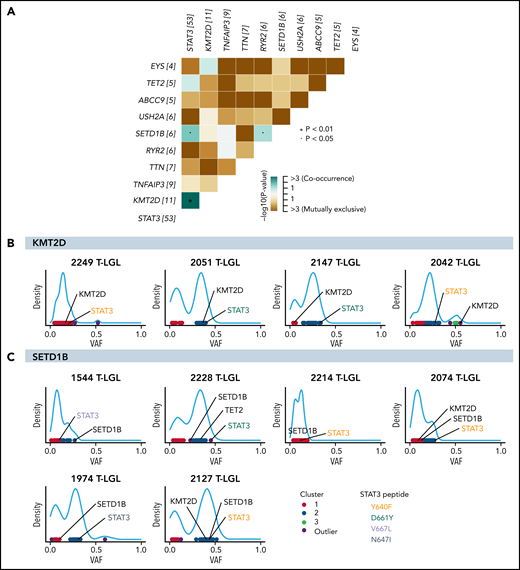
Significant co-occurrence of STAT3 with KMT2D or SETD1B mutations. (A) Comutation plot of all nonsilent mutations observed in the 105-patient LGL leukemia cohort. Numbers in brackets after gene names represent the number of mutations in this gene in the cohort. Significant pairs of genes were detected by pairwise Fisher’s exact test. (B-C) VAF density plots were used to infer clones or “clusters.” Each dot represents individual somatic variants observed in a given patient. The color of the dots represents inferred clusters. Colored annotations indicate different types of STAT3 mutations. (B) Four representative KMT2D VAF density plots. The first 2 demonstrate inclusion of both STAT3 and KMT2D in the same predicted clone. The following 2 plots demonstrate 2 mutations associating with 2 different clones. (C) VAF density plot of all patients harboring SETD1B mutations in the cohort.
Significant co-occurrence of STAT3 with KMT2D or SETD1B mutations. (A) Comutation plot of all nonsilent mutations observed in the 105-patient LGL leukemia cohort. Numbers in brackets after gene names represent the number of mutations in this gene in the cohort. Significant pairs of genes were detected by pairwise Fisher’s exact test. (B-C) VAF density plots were used to infer clones or “clusters.” Each dot represents individual somatic variants observed in a given patient. The color of the dots represents inferred clusters. Colored annotations indicate different types of STAT3 mutations. (B) Four representative KMT2D VAF density plots. The first 2 demonstrate inclusion of both STAT3 and KMT2D in the same predicted clone. The following 2 plots demonstrate 2 mutations associating with 2 different clones. (C) VAF density plot of all patients harboring SETD1B mutations in the cohort.
Functional and clinical characterization of STAT3 mutation
Previous studies have found recurrent, somatic activating mutations affecting the SH2 domain of STAT3. In agreement with those previous studies, we found nonsilent mutations in the SH2 domain of STAT3 in 51 out of 105 (48.6%) patients (Figure 5A; supplemental Table 4). We also observed a single mutation in the DNA-binding domain (H410R) and previously unreported mutations in the coiled-coil domain (Q160P, D170Y, and L287F; Figure 5A; supplemental Figure 4). To explore the functional significance of novel mutations in the coiled-coil domain, we transfected HEK293 cells with expression vectors for WT, Q160P, D170Y, L287F, and Y640F (positive control8) along with a STAT3 luciferase reporter vector containing a STAT3-responsive cis-inducible element. All novel mutants exhibited luminescence signal 129- to 794-fold higher than empty vector and WT STAT3 controls (Figure 5B; supplemental Figure 5). Y640F exhibited the strongest signal and was statistically significant compared with all other examined mutations. Phospho-Y705 STAT3 levels were also strongly increased (1.5- to 2.7-fold higher) in all novel mutants relative to WT (Figure 5C; supplemental Figure 5).
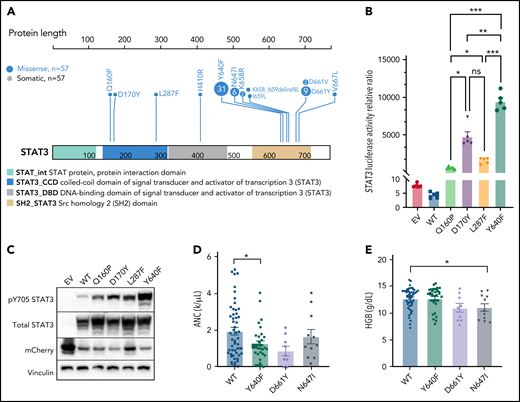
Novel activating STAT3 mutations in the coiled-coil domain and clinical phenotype of patients harboring specific STAT3 somatic mutations. (A) Lollipop plot of STAT3 somatic mutations detected in the 105-patient LGL leukemia cohort. Annotations for individual domains are described at the bottom. (B) STAT3 expression vectors, Q160P, L287F, D170Y, and Y640F as well as empty vector and WT STAT3 were transfected into HEK293 cells along with STAT3 luciferase reporter. Shown is a quantification of the relative ratio between firefly STAT3 responsive element against cytomegalovirus-controlled renilla luciferase. Two independent experiments were performed. Shown is 1 representative experiment. (C) Western blot of phospho-Y705 STAT3, total STAT3, mCherry, and vinculin from parallel whole-cell lysates obtained from transfection of empty vector, WT, and mutant STAT3 constructs as in panel B. Two independent experiments were performed. Shown is 1 representative experiment. (D-E) Plots of hematologic parameters ANC and HGB segregated by STAT3 WT, Y640F, D661Y, and N647I mutations. This includes 5 additional patients with N647I mutations identified using Sanger sequencing outside of the original 105-patient cohort. For panel D, Dunnett’s test with WT as a comparison control, P = .045, P = .059, and P = .853 for Y640F, D661Y, and N647I mutations, respectively. For panel E, Dunnett’s test with WT as a comparison control, P = .999, P = .074, and P = .047 for Y640F, D661Y, and N647I mutations, respectively. P values are indicated as follows: *P < .05; **P < .01; ***P < .001.
Novel activating STAT3 mutations in the coiled-coil domain and clinical phenotype of patients harboring specific STAT3 somatic mutations. (A) Lollipop plot of STAT3 somatic mutations detected in the 105-patient LGL leukemia cohort. Annotations for individual domains are described at the bottom. (B) STAT3 expression vectors, Q160P, L287F, D170Y, and Y640F as well as empty vector and WT STAT3 were transfected into HEK293 cells along with STAT3 luciferase reporter. Shown is a quantification of the relative ratio between firefly STAT3 responsive element against cytomegalovirus-controlled renilla luciferase. Two independent experiments were performed. Shown is 1 representative experiment. (C) Western blot of phospho-Y705 STAT3, total STAT3, mCherry, and vinculin from parallel whole-cell lysates obtained from transfection of empty vector, WT, and mutant STAT3 constructs as in panel B. Two independent experiments were performed. Shown is 1 representative experiment. (D-E) Plots of hematologic parameters ANC and HGB segregated by STAT3 WT, Y640F, D661Y, and N647I mutations. This includes 5 additional patients with N647I mutations identified using Sanger sequencing outside of the original 105-patient cohort. For panel D, Dunnett’s test with WT as a comparison control, P = .045, P = .059, and P = .853 for Y640F, D661Y, and N647I mutations, respectively. For panel E, Dunnett’s test with WT as a comparison control, P = .999, P = .074, and P = .047 for Y640F, D661Y, and N647I mutations, respectively. P values are indicated as follows: *P < .05; **P < .01; ***P < .001.
STAT3 mutation at any site was significantly associated with lower neutrophil (ANC, P = .0042) counts (supplemental Figure 6) as previously observed.8 We also observed lower hemoglobin (HGB, P = .071) and hematocrit (HCT, P = .063) values in STAT3-mutated patients (supplemental Figure 6). Lastly, we retrospectively collected bone marrow pathology on 42 patients to detect differences between STAT3-WT (n = 18) vs -mutant patients (n = 24) (supplemental Figures 7 and 8). No association with bone marrow cellularity, lymphocyte percent, myeloid to erythroid ratio, reticulin grade, presence of TCR clone, T-cell intracellular antigen, or granzyme staining was found with STAT3 mutation. Other somatic mutations, such as TET2, were not analyzed given the very low number of mutated samples (n = 2) with associated bone marrow data.
Our large patient cohort allowed us to further stratify the STAT3 mutation group into common somatic activating variants Y640F (n = 31), D661Y (n = 9), and N647I (n = 11) to determine their association with the key clinical features, neutropenia, and anemia, which are indicators for treatment in LGL leukemia. Previous studies and supplemental Figure 6 analyzed all STAT3 mutants together in comparisons with STAT3 WT.8,14-17 We found that Y640F mutation exhibited significantly lower ANC values (P = .045; Figure 5D). ANC values for D661Y (P = .059) and N647I (P = .853) mutation also trended toward lower levels than WT. Notably, N647I mutation was associated with significantly lower HGB values (P = .047), with D661Y mutation trending similarly (P = .074). However, the range of HGB values was not significantly different for the most frequent somatic activating mutation, Y640F, compared with WT (P = .9999) (Figure 5E). HCT and red blood cell values showed similar changes (supplemental Figure 8). There was no association with white blood cell, absolute lymphocyte count, mean corpuscular volume, red cell distribution width, platelets, or age for STAT3 mutation groups.
Mutational landscape of STAT3-WT and -mutant LGL leukemia
As defined by the counts of nonsilent somatic variants in exomes, the total mutational burden has been reported to be a function of age in other hematological malignancies.44 We investigated if there were a relationship between the mutational burden and clinical features in LGL leukemia, which includes mutation status for STAT3 and flow-cytometric profiling. We used least absolute shrinkage and selection operator regularization and determined that the STAT3 mutation status, the CD3+CD57+ fraction, and the patient’s age at the time of sequencing were all significant predictors of the mutational burden (Figure 6A-C). Additional analysis including silent variants also showed increased mutational burden in STAT3-mutated samples (supplemental Figure 9). Together, these variables explain only ∼35% of the variance in the mutation burden, highlighting the heterogeneity of the disease. Additionally, overall mutational burden was not significantly different among the Y640F, D661Y, and N647I STAT3 mutation groups (P = .7512, Kruskal-Wallis).
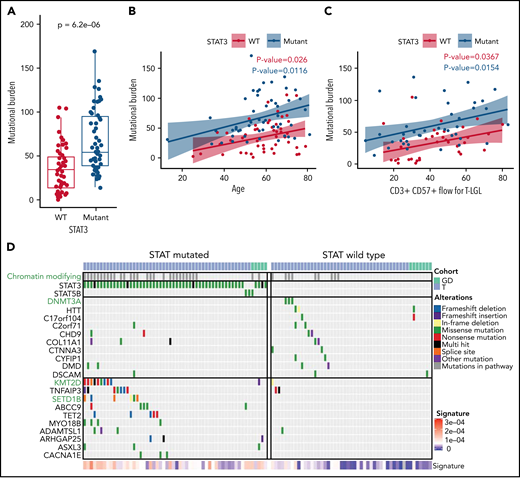
Increased mutational burden in STAT3-mutated patients. (A) Boxplot of nonsilent mutational burden comparing STAT3 WT against mutant patients. P value from Wilcoxon t test. (B) Plot of the mutational burden against age for WT and mutant STAT3 patients with linear regression and colored annotation representing STAT3 mutation status. (C) Plot of mutation burden against CD3+ CD57+ fraction for T-LGL patients with linear regression and colored annotation representing STAT3 mutation status. (D) Top recurrent somatic mutations observed in STAT-mutated and WT groups. The left oncoplot shows patients with STAT3 or STAT5B mutations (n = 56), and the right oncoplot shows STAT WT (n = 49) patients. The top annotation indicates the LGL subtype. Patients with mutations in the chromatin-modifying enzyme gene list (supplemental Table 9) are annotated in the second row in gray. Three chromatin-modifying genes are highlighted in green font. The 10 genes that are most frequently mutated in WT patients are shown in the top half, followed by the 10 genes most frequently mutated in STAT3- and STAT5B-mutated patients in the bottom half. Annotation of “Alterations” indicates the type of mutation affecting the gene. SBS1 signature explains the degree of intensity of the COSMIC SBS1 signature present for each patient.
Increased mutational burden in STAT3-mutated patients. (A) Boxplot of nonsilent mutational burden comparing STAT3 WT against mutant patients. P value from Wilcoxon t test. (B) Plot of the mutational burden against age for WT and mutant STAT3 patients with linear regression and colored annotation representing STAT3 mutation status. (C) Plot of mutation burden against CD3+ CD57+ fraction for T-LGL patients with linear regression and colored annotation representing STAT3 mutation status. (D) Top recurrent somatic mutations observed in STAT-mutated and WT groups. The left oncoplot shows patients with STAT3 or STAT5B mutations (n = 56), and the right oncoplot shows STAT WT (n = 49) patients. The top annotation indicates the LGL subtype. Patients with mutations in the chromatin-modifying enzyme gene list (supplemental Table 9) are annotated in the second row in gray. Three chromatin-modifying genes are highlighted in green font. The 10 genes that are most frequently mutated in WT patients are shown in the top half, followed by the 10 genes most frequently mutated in STAT3- and STAT5B-mutated patients in the bottom half. Annotation of “Alterations” indicates the type of mutation affecting the gene. SBS1 signature explains the degree of intensity of the COSMIC SBS1 signature present for each patient.
Next, we compared the mutational landscapes of STAT3-mutant and -WT LGL leukemia. STAT3-mutant samples exhibit increased mutation prevalence for genes such as KMT2D and SETD1B involved in chromatin modification (Figure 6D; see supplemental Table 9 for entire list) as well as epigenetic modifier TET2. Conversely, DNMT3A mutations were found exclusively in STAT3-WT patients in our cohort. Further analysis revealed that the relative contribution of the SBS1 signature, which is enriched in LGL leukemia (Figure 1E), was significantly higher in STAT3-mutated patients compared with STAT3 WT (Figure 6D; supplemental Figure 10). Taken together, this suggests that STAT3-mutated patients harbor a distinct genomic profile characterized by epigenetic and mutational aberrations.
Transcriptomic analysis of STAT3-WT and -mutant LGL leukemia
We next examined the transcriptome differences of patients with somatic mutations in STAT3 compared with STAT3 WT. Six hundred fifty four genes were significantly upregulated and 458 genes were significantly downregulated in T-LGL patients with STAT3 mutations after accounting for batch effects, sex, and purity of the samples (supplemental Table 10). The top 10 differentially expressed genes with higher expression in the STAT3-mutated group (Figure 7A) included PDGFRB, which was previously reported as highly expressed in LGL leukemic cells,45 and JAK3, which is activated in various hematologic malignancies.46,47 Aberrant expression of myeloid lineage–specific genes was also observed, including ZBTB46, C1QB, and C1QC for STAT3 mutants, and PGC and FGFR2 for STAT3 WT. Functional enrichment analysis using gProfiler followed by EnrichmentMap visualization revealed key module differences in cytokine signaling, antigen processing, apoptosis, PI3K-Akt signaling, Runx2 activity, and hedgehog signaling between STAT3-mutant and -WT patients (supplemental Figure 11A). Gene set enrichment analysis of these network modules demonstrated over-representation in STAT3 mutants, except for enrichment of PI3K-Akt signaling in STAT3-WT samples (Figure 7B).

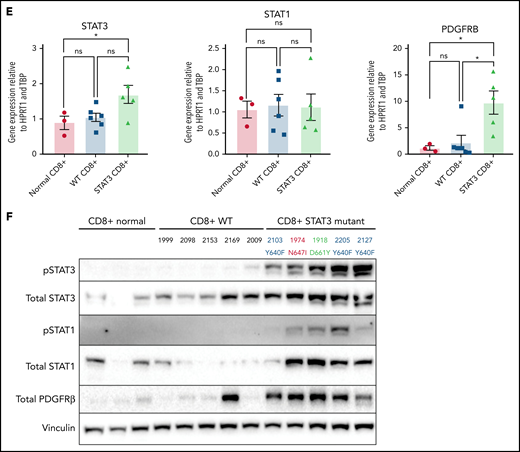
Transcriptomic and protein expression comparison of STAT3-mutated patients against STAT3-WT patients. (A-B) RNA-seq analysis of T-LGL leukemia patients. (A) Volcano plot of DESeq2 output of T-LGL STAT3 mutant vs STAT3 WT. Genes with positive log2 fold changes are more highly expressed in STAT3 mutants, and genes with negative log2 fold changes are more highly expressed in STAT3 WT. (B) Gene set enrichment analysis of the nodes from the functional modular network analysis. Positive enrichment scores indicate pathways that are positively enriched in STAT3-mutant patients. Negative enrichment scores indicate pathways enriched in STAT3-WT patients. (C) RT-qPCR comparison of mRNA levels of ZBTB46, AKT3, and PDGFB from CD8+-isolated normal controls (n = 3; ZBTB46 n = 2 due to signal below the limit of detection in 1 sample), WT (n = 6; ZBTB46 n = 5 due to signal below the limit of detection in 1 sample), and STAT3-mutant LGL patient samples (n = 5). Analysis of variance (ANOVA) P = .028, .014, and .018 for ZBTB46, AKT3, and PDGFB, respectively. (D) Western blotting of pS473 AKT, total AKT, phospho-p44/42 MAPK, total p44/42 MAPK, pS9 GSK3β, and total GSK3β from CD8+-isolated normal controls (n = 3) compared with WT and STAT3-mutant LGL patient samples (n = 5). STAT3 mutation type and LGL registry ID are indicated. (E) RT-qPCR comparison of mRNA levels of STAT3, STAT1, and PDGFRB from CD8+-isolated normal controls, WT, and STAT3-mutant LGL patients. ANOVA P = .049, .963, and .026 for STAT3, STAT1, and PDGFRB, respectively. (F) Western blotting of pSTAT3, total STAT3, pSTAT1, total STAT1, total PDGFRβ, and vinculin loading control from CD8+-isolated normal controls compared with WT and STAT3-mutant LGL patient samples. STAT3 mutation type and LGL registry ID are indicated. Welch’s or Brown-Forsythe ANOVA was used for all RT-qPCR analyses depending on the distribution of the data. Unpaired t with Welch’s correction as a post hoc test. P values are indicated as follows: *P < .05; **P < .01.
Transcriptomic and protein expression comparison of STAT3-mutated patients against STAT3-WT patients. (A-B) RNA-seq analysis of T-LGL leukemia patients. (A) Volcano plot of DESeq2 output of T-LGL STAT3 mutant vs STAT3 WT. Genes with positive log2 fold changes are more highly expressed in STAT3 mutants, and genes with negative log2 fold changes are more highly expressed in STAT3 WT. (B) Gene set enrichment analysis of the nodes from the functional modular network analysis. Positive enrichment scores indicate pathways that are positively enriched in STAT3-mutant patients. Negative enrichment scores indicate pathways enriched in STAT3-WT patients. (C) RT-qPCR comparison of mRNA levels of ZBTB46, AKT3, and PDGFB from CD8+-isolated normal controls (n = 3; ZBTB46 n = 2 due to signal below the limit of detection in 1 sample), WT (n = 6; ZBTB46 n = 5 due to signal below the limit of detection in 1 sample), and STAT3-mutant LGL patient samples (n = 5). Analysis of variance (ANOVA) P = .028, .014, and .018 for ZBTB46, AKT3, and PDGFB, respectively. (D) Western blotting of pS473 AKT, total AKT, phospho-p44/42 MAPK, total p44/42 MAPK, pS9 GSK3β, and total GSK3β from CD8+-isolated normal controls (n = 3) compared with WT and STAT3-mutant LGL patient samples (n = 5). STAT3 mutation type and LGL registry ID are indicated. (E) RT-qPCR comparison of mRNA levels of STAT3, STAT1, and PDGFRB from CD8+-isolated normal controls, WT, and STAT3-mutant LGL patients. ANOVA P = .049, .963, and .026 for STAT3, STAT1, and PDGFRB, respectively. (F) Western blotting of pSTAT3, total STAT3, pSTAT1, total STAT1, total PDGFRβ, and vinculin loading control from CD8+-isolated normal controls compared with WT and STAT3-mutant LGL patient samples. STAT3 mutation type and LGL registry ID are indicated. Welch’s or Brown-Forsythe ANOVA was used for all RT-qPCR analyses depending on the distribution of the data. Unpaired t with Welch’s correction as a post hoc test. P values are indicated as follows: *P < .05; **P < .01.
RNA-seq analysis was confirmed by sorting CD8+ cells from normal controls as well as the original date-matched sample used for whole-exome and RNA-seq. RNA and protein expression were determined using RT-qPCR (Figure 7C,E) and western blotting (Figure 7D,F). STAT3-mutated CD8+ samples strongly overexpress the myeloid lineage–specific ZBTB46 compared with WT samples and CD8+ normal controls (Figure 7C). We also demonstrated decreased expression of AKT3 and PDGFB, both genes in the PI3K-Akt signaling axis, in STAT3 mutants compared with STAT3-WT samples and normal controls (Figure 7C). We then probed for PI3K-Akt signaling cascades in CD8+ isolated normal, WT, and STAT3-mutated samples. Three patients in both groups exhibited increased levels of phospho-AKT, phospho-p44/42 MAPK, and phospho-GSK3β compared with normal CD8+. Conversely, 2 patients in both groups showed little activation of these readouts (Figure 7D). There was no statistical difference in PI3K-Akt signaling, primarily due to this patient heterogeneity (supplemental Figure 12A-C).
Finally, unbiased clustering of patients with leading edges from the hallmark interferon-γ gene set revealed increased expression of interferon-γ pathway genes in STAT3-mutant patients (supplemental Figure 11B). We examined STAT3 and STAT1 gene expression in CD8+ isolated samples (Figure 7E) but did not observe statistically significant differences in messenger RNA (mRNA) levels. However, immunoblots showed high abundance of phospho-STAT3 and phospho-STAT1 in STAT3 mutant relative to WT patient samples and normal controls (Figure 7F; supplemental Figure 12D-E). We also detected high PDGFRβ protein expression levels in STAT3 mutants (Figure 7F; supplemental Figure 12F), consistent with RNA-seq analysis (Figure 7A,E). In sum, these analyses show a distinct transcriptomic profile of STAT3-mutant patients with highlights in interferon and interleukin signaling.
Discussion
Here, we define the genomic landscape of LGL leukemia using an integrated and comprehensive genomic approach in 105 samples. This is the first WES report for GD-LGL subtype. We identified shared somatic mutations and putative drivers between T-LGL and GD-LGL leukemia. We detected nonsilent mutations in 2717 genes, including novel somatic mutations that are minor in frequency in LGL leukemia. Moreover, 76 genes were mutated in 3 or more patients, thus more clearly defining the prevalence and gene targets of recurrent mutational events as well as high-confidence loss-of-function variants. Overall, the numbers of nonsilent mutations, affected genes, and mutational signatures were similar across both subtypes. Multiple algorithms were used to predict driver mutations in 15 genes, which were generally detected across subtypes. The 12 GD-LGL samples did not reveal any unique mutational events from 93 T-LGL samples. Most studies that rely on STAT3 molecular profiling for mutational subgroup analysis in LGL leukemia target the SH2 domain. We found mutations in the coiled-coil and DNA-binding domains in 3.8% of the cohort. Our functional assays determined that the novel mutations in the coiled-coil domain of STAT3 are also activating and should be included in any subgroup analysis.
We observed multiple mutational and transcriptomic landscape differences between STAT3-mutated and -WT groups and clinical differences between different STAT3 point mutations that previous studies were underpowered to detect. Thus, we have refined the molecular characterization of this disease and identified genes that may contribute to lymphoproliferation, such as recurrent mutations in the death domain of FAS and hotspot PIK3R1 mutations. PDGFRB was strongly overexpressed at the mRNA and protein levels in STAT3-mutated samples, providing additional insight into our previous observation.45
Our mutational signature analysis showed that a SBS1 replicative signature has a higher relative contribution toward the somatic mutation profile in STAT3-mutated samples, indicating increased cell division in those samples relative to STAT3 WT. Unlike acute myeloid leukemia, where age is the most significant predictor of mutation burden, both STAT3 status and the CD3+CD57+ fraction are better predictors of mutational burden in LGL. CD57 expression in T lymphocytes is a well-recognized marker of replicative senescence (clonal exhaustion).48 In summary, our analysis indicates that the increased mutational burden in STAT3-mutant patients may be associated with lymphocyte replication stress.
The frequent co-occurrence of STAT3 mutations with mutations in epigenetic modifiers in LGL leukemia is an important theme emerging from this study. Others recently reported that STAT3-mutated patients have high protein levels of epigenetic regulator DNMT1 and are characterized by global hypermethylation.49 In our study, all TET2 mutations were found in the same predicted clone as STAT3 if STAT3 mutations were present. KMT2D and SETD1B mutations were associated with a STAT3-mutated clone approximately half the time. Since our original discoveries in LGL leukemia,8,9,12,50STAT3 or STAT5B activation/mutation has been a prominent pathogenic mechanism in T-cell leukemia/lymphomas.51-55 However, to our knowledge, concurrent epigenetic modifier mutations in patients with predominant STAT3 mutation have only been observed in a rare T-cell lymphoma, breast implant–associated anaplastic large cell lymphoma.56 The significant co-occurrence of loss-of-function mutations in KMT2D and TET2 with STAT3 suggests a unique cooperative relationship in LGL leukemia.
Previously, we reported that dysregulation of Fas-mediated apoptosis is a fundamental pathogenic mechanism in LGL leukemia.57 Genetic lesions in the death domain of Fas were previously not detected in studies that included 5 and 7 patient PBMC samples, respectively.57,58 Somatic FAS mutations, clustered mainly in the death domain, are observed in autoimmune lymphoproliferative syndrome type 3, which is characterized by elevated numbers of double-negative TCRαβ CD3+ CD4− CD8− T cells.35,36 These mutations impair normal FAS signaling, leading to accumulation of autoreactive lymphocytes.59 Here, we discovered that T-LGL leukemia cells also harbor mutations in the death domain of FAS. FAS mutation was present in a patient harboring STAT3, KMT2D, and TNFAIP3 mutations, and 2 patients with a concurrent STAT3 mutation. Somatic FAS mutations in T-LGL leukemia provide another etiologic mechanism for LGL leukemic cells to resist apoptosis, persist in the circulation, and accumulate to elevated numbers.
Our discovery of PIK3R1 mutations in T-LGL (K567E) and GD-LGL (N564D), combined with a previously reported mutation in NK-LGL (S565IinsEYREIDKRMNS),18 identifies a hotspot of mutations in PIK3R1 in all 3 LGL subtypes. This hotspot region resides in the binding domain of the p110α subunit of PI3K, and mutations in this region lead to its activation.60,61PIK3CA encodes p110α, and activating mutations of PIK3CA are found in other cancers and reported to be oncogenic.60,62 Notably, heterozygous germline mutations affecting the inter-SH2 domain of PIK3R1, where LGL leukemia mutations were observed, led to activated PI3 kinase δ syndrome 2 that is characterized by prominent expansion of peripheral blood CD8+ T cells.63-66PIK3R1 mutation is also reported in other cancers, with the highest frequency in endometrial and pancreatic cancer.67 Additionally, activation of the PI3K-Akt pathway promotes resistance to apoptosis in LGL leukemia.68 Furthermore, additional PI3K family mutations in our cohort (supplemental Table 7), including PIK3CA and PIK3CD, provide further support for the potential role of this pathway in T-LGL leukemia, consistent with our previous report of PIK3CD and PIK3AP1 mutations in NK-LGL.21 The PI3K-Akt pathway is a central hub for many signaling pathways and is known to be activated in LGLs relative to normal controls.69 Our data suggest decreased transcriptional activation of the pathway in STAT3-mutant leukemic samples that exhibit other mechanisms of PI3K-Akt activation at the protein level. Heterogeneity of PI3K-Akt signaling in patient samples (Figure 7) limits the ability to draw firm conclusions and highlights the need for additional studies in a larger cohort. In sum, observance of somatic mutations in PI3K family genes and increased phospho-protein levels in select patients demonstrate multiple mechanisms of PI3K pathway activation in both WT and STAT3-mutant patients.
Previous studies have described an association between STAT3 mutation status and lower ANC values.8,14,15,17 However, the association of STAT3 mutation with indicators of anemia has not been reported consistently.8,14-17 Here, we found that the most common Y640F mutation was associated with lower ANC values, and N647I mutation was associated with lower HGB values. Unexpectedly, patients with the most common somatic activating mutation, Y640F, exhibited similar HGB and HCT values to STAT3 WT in our large cohort with 52 STAT3-WT, 31 Y640F, 9 D661Y, and 11 N647I patients. This observation may explain why general STAT3 mutation status is inconsistently associated with anemia in previous studies that did not define or separate specific STAT3 mutation groups. Consistent with this result, male patients harboring D661Y, but not Y640F, mutations were previously associated with higher mean corpuscular volume and lower HGB values.17 Exact mechanisms to explain how different STAT3 mutations lead to such striking and selective differences in blood parameters remain to be elucidated. Further, bone marrow pathology was similar between STAT3-mutated patients and WT patients, including when STAT3 mutation types were stratified.
Our use of nonsorted PBMC to generate whole-exome and RNA-seq data are a potential limitation of this study. Even though the median leukemic fraction as assessed by clinical flow cytometry in the study is 66%, and the samples were sequenced to an average coverage of 200-fold, this approach has limitations in its ability to characterize the various minor clones. In a sample with a leukemic fraction of 66% and an average coverage of 200-fold, somatic mutations with a mean expected allelic fraction of 0.03 with power 0.8 can be detected. The approach of using bulk PBMC samples may also detect somatic variants within nonlymphocyte compartments. For example, 2 putative driver genes in this study, KMT2D and TET2, have been proposed to reflect early stages of hematopoiesis, resulting in mutation detection within myeloid as well as NK-LGL leukemia compartments.20 However, the precise definition of clonal compartments and evolution in LGL leukemia, and potential interplay with clonal hematopoiesis of indeterminate potential mutations, awaits more detailed single-cell and longitudinal analyses. Finally, an additional potential concern is that gene expression profiles may represent signals that are not autonomous to the leukemic LGLs. However, we modeled the leukemic fraction along with gender and batch differences so that the gene expression reflected sample purity in our analyses. Importantly, we directly confirmed overexpression of representative genes identified by RNA-seq in purified CD8+ cells from LGL patients.
In conclusion, we identified recurrent putative driver mutations that may underlie the pathogenesis of LGL leukemia. However, we also observed that a significant percentage of LGL patients sequenced do not harbor notable recurrent somatic mutations in the exonic region. These findings suggest the possibility that mutations in nonexonic regions of the genome, epigenetic mechanisms, or germline involvement could contribute to pathogenesis and are worthy of future research. Finally, we found unique differences between STAT3-mutant and -WT leukemic samples in mutational burden and signature, transcriptome, and clinical associations. These findings highlight the emerging etiologic insights into this rare and heterogeneous disorder, which in turn may be leveraged as potential targets to improve therapeutic outcomes in this disease.
Acknowledgments
The authors thank Bryna Shemo, Andrea Hines, Rachel Stidham, Matthew Schmachtenberg, Wendy Dunton, and Shubha Dighe for LGL Leukemia Registry and technical support. They also thank Kristine C. Olson, Jun Yang, and Mary Poss for their critical reading of the manuscript and feedback.
LGL leukemia research in the Loughran laboratory is supported by the National Cancer Institute, National Institutes of Health grants R01CA178393 and P30CA044579 (T.P.L.); T32LM012416, T32GM007267, and T32CA009109 (H.C., J.C.X., and J.U.); and F30CA225046 (J.C.X.). Additional support was provided by the Bess Family Charitable Fund, the LGL Leukemia Foundation, Charles and Katharine Hutton Tweedy, William J. Branch, Szabolcs Szentpetery, Robert R. Wagner Fellowship (H.C.), and a generous anonymous donor (T.P.L.).
Authorship
Contribution: H.C., J.C.X., R.C.H., T.L.O., S.-F.T., D.J.F., A.R., and T.P.L. conceived the study; H.C., D.J.F., and A.R. wrote the manuscript; H.C. and A.R. made the figures; H.C., J.C.X., K.B.M., J.U., V.W.C., and A.R. analyzed results; H.C., J.C.X., K.B.M., J.U., V.W.C., D.S.C., M.F.T., O.E., J.S.W., and C.E.H. designed experiments and collected data; and all authors have edited and approved the manuscript.
Conflict-of-interest disclosure: T.P.L is on the scientific advisory board and has stock options for Keystone Nano, Bioniz Therapeutics, and Dren Bio. T.P.L. and D.J.F. received honoraria from Kymera Therapeutics. D.J.F. has research funding from AstraZeneca. There are no conflicts of interest with the work presented in this manuscript. The remaining authors declare no competing financial interests.
Correspondence: Thomas P. Loughran Jr, University of Virginia Cancer Center, PO Box 800334, Charlottesville, VA 22908-0334; e-mail: tl7cs@virginia.edu.
Presented in abstract form at the 62nd annual meeting of the American Society of Hematology, 5 December 2020.
The whole exome and RNA sequencing data can be accessed in the NCBI dbGaP database under accession number phs002359.v1.p1. Additional patient selection, whole-exome and RNA-seq analysis, STAT3 reporter assay, western blotting, quantitative reverse transcription polymerase chain reaction (RT-qPCR), and statistical analysis details are presented in supplemental Methods. Requests for data sharing may be submitted to Thomas P. Loughran Jr at tl7cs@virginia.edu.
The online version of this article contains a data supplement.
There is a Blood Commentary on this article in this issue.
The publication costs of this article were defrayed in part by page charge payment. Therefore, and solely to indicate this fact, this article is hereby marked “advertisement” in accordance with 18 USC section 1734.

This feature is available to Subscribers Only
Sign In or Create an Account Close Modal