

Key Points
Lama4 loss results in bone marrow niche alterations and impaired hematopoiesis recovery after irradiation-induced stress.
Lama4−/− niche accelerates AML onset and relapse and confers AML LSC chemoresistance by regulating ROS level via mitochondrial transfer.

Abstract
Impairment of normal hematopoiesis and leukemia progression are 2 well-linked processes during leukemia development and are controlled by the bone marrow (BM) niche. Extracellular matrix proteins, including laminin, are important BM niche components. However, their role in hematopoiesis regeneration and leukemia is unknown. Laminin α4 (Lama4), a major receptor-binding chain of several laminins, is altered in BM niches in mice with acute myeloid leukemia (AML). So far, the impact of Lama4 on leukemia progression remains unknown. We here report that Lama4 deletion in mice resulted in impaired hematopoiesis regeneration following irradiation-induced stress, which is accompanied by altered BM niche composition and inflammation. Importantly, in a transplantation-induced MLL-AF9 AML mouse model, we demonstrate accelerated AML progression and relapse in Lama4−/− mice. Upon AML exposure, Lama4−/− mesenchymal stem cells (MSCs) exhibited dramatic molecular alterations, including upregulation of inflammatory cytokines that favor AML growth. Lama4−/− MSCs displayed increased antioxidant activities and promoted AML stem cell proliferation and chemoresistance to cytarabine, which was accompanied by increased mitochondrial transfer from the MSCs to AML cells and reduced reactive oxygen species in AML cells in vitro. Similarly, we detected lower levels of reactive oxygen species in AML cells from Lama4−/− mice post–cytarabine treatment. Notably, LAMA4 inhibition or knockdown in human MSCs promoted human AML cell proliferation and chemoprotection. Together, our study for the first time demonstrates the critical role of Lama4 in impeding AML progression and chemoresistance. Targeting Lama4 signaling pathways may offer potential new therapeutic options for AML.
Introduction
Adequate hematopoiesis regeneration under stress determines the disease outcome and is governed by bone marrow (BM) hematopoietic stem cell (HSC) niche, which controls HSC self-renewal, differentiation, and migration.1-3 The niche is composed of cellular components, including mesenchymal stem cells (MSCs), mesenchymal progenitor cells (MPCs), mature lineages like osteoblasts and adipocytes,4-6 endothelial cells (ECs), and the factors produced by them. These cells can be identified based on their marker expression by fluorescence-activated cell sorting (FACS)5,7-9 and confocal imaging.10 Extracellular matrix (ECM) proteins represent an important family of molecular niche components, forming a complex structural network but also transducing signals via cellular receptors. Nevertheless, so far, most studies have been focusing on the role of the cellular niches.5,11,12 Little is known about the role of ECM molecules in controlling hematopoiesis and leukemia.
Laminins are a large family of heterotrimeric ECM glycoproteins composed of α, β, and γ chains. The laminin α chain contains major binding sites for their receptors,13,14 and thus, is crucial for the functional activities of the laminins.15 Laminin α4 (LAMA4), the active chain for several laminin isoforms (laminin-411, -421, and -423), is expressed in BM and plays a role in HSC proliferation and migration.16-18 Deletion of Lama4 in mice led to disruption of angiogenesis perinatally19 but had a minor impact on hematopoiesis under steady-state.16 However, the impact of Lama4 on hematopoiesis regeneration and leukemia progression remains largely unclear.
Acute myeloid leukemia (AML) is an aggressive hematological malignancy with a poor survival rate.20 Progressive loss of normal hematopoiesis is directly associated with morbidity and mortality in leukemias.21 The hematopoietic insult induced by radiotherapy or chemotherapy further increases the risk for death due to pancytopenia. Thus, quick and efficient hematopoiesis recovery is essential for successful treatment outcomes. It has been shown that AML cells can alter BM niche and render the niche more supportive for AML cells but hostile for normal hematopoiesis.5,22 Furthermore, emerging evidence suggests that BM stromal cells protect leukemic cells from chemotherapy by providing metabolic support23-29 and maintaining them in quiescence.30 However, the molecular mechanisms remain to be elucidated.
We have shown that Lama4 is upregulated in mouse BM MSCs and MPCs but not ECs during AML progression.5 However, the functional impact of the LAMA4 expression alteration on AML has been unexplored. Here, we have used Lama4−/− mice and an MLL-AF9 AML model and demonstrated that Lama4 deficiency caused impaired hematopoiesis recovery, accelerated AML progression, and relapse following treatment, demonstrating a critical role of Lama4 in maintaining normal hematopoiesis while suppressing AML. Importantly, LAMA4 inhibition or knockdown in human BM MSCs had a similar impact on human AML cell proliferation and protection. Mechanistically, in addition to altered cellular niche composition in Lama4−/− BM, upregulated genes for inflammatory response were detected in Lama4−/− MSCs and MPCs. Upon AML exposure, Lama4−/− MSCs seemed to be more susceptible to remodeling by AML cells. They provided a stronger antioxidant defense through increased mitochondrial transfer to the AML cells, thereby contributing to increased AML proliferation and chemoprotection.
Methods
Mice
Wild type (Lama4+/+) and Lama4−/− CD45.2 C57BL/6J mice19 aged 7 to 14 weeks were used for this study. Transplantation-induced MLL-AF9 AML mouse model was generated as described.5 Animal procedures were performed with approval (2018-1869) from the local ethics committee at Karolinska Institute (Stockholm, Sweden). See more details in the supplemental Data, available on the Blood Web site.
RNA sequencing
BM MSCs or MPCs were sorted, and RNA was extracted using RNeasy MicroKit (Qiagen) according to the manufacturer’s recommendations. cDNA was prepared using SMART-Seq v4 Ultra Low Input RNA Kit for Sequencing (Takara Bio). The cDNA quality was examined on the Agilent TapeStation system using a High Sensitivity D5000 ScreenTape (Agilent). One ng cDNA was used for library preparation using Nextera XT DNA Library Preparation Kit (FC-131-1024 & FC-131-1096, Illumina). The yield and quality of the amplified libraries were analyzed using Qubit (Thermo Fisher Scientific) and the Agilent TapeStation System. The indexed cDNA libraries were normalized, combined, and sequenced on the Illumina Nextseq 550 or 2000 for a 75-cycle v2 or 130-cycle P2 sequencing run generating 75 bp single-end or pair-end reads. See supplemental Data for data analysis.
Detection of reactive oxygen species (ROS) level and mitochondrial membrane potential (MMP)
The cultured or freshly isolated cells were washed with phosphate-buffered saline (PBS) and incubated with 2 µM of H2-DCFDA (C6827, ThermoFisher) or 4 nM tetramethylrhodamine methyl ester perchlorate (TMRM) (9105, Immunochemistry Technologies) in DMEM at 37°C for 40 minutes to detect ROS and MMP level, respectively. The cells were then rinsed twice with PBS and resuspended with 150 µL of propidium iodide (1:1000) in 5% fetal bovine serum/PBS. ROS and MMP levels were measured by FACS.
Mitochondrial transfer
MSCs were stained with MitoTracker™ Green FM (M7514, Thermo Fisher) at 37°C for 60 minutes, according to the manufacturer’s instructions. The cells were washed twice with PBS, then incubated for 3 to 4 hours to remove the unbound probe before a final wash. Subsequently, 15 000 to 30 000 MLL-AF9 AML cells in Myelocult (M5300, StemCell Technologies) were plated and cocultured with prelabeled MSCs for 24 hours. Mitochondrial transfer was quantified in AML cells (CD45.1+) by FACS and visualized by confocal microscope.
Statistics
Unpaired Student t test or Mann-Whitney U test was used to determine the differences based on the data distribution. The Kaplan-Meier survival curves of the mice were generated by Log-rank (Mantel-Cox test) in Prism 8.0. All reported P values were obtained using the Prism 8.0 software, and P < .05 was considered statistically significant.
See additional methods including confocal imaging, colony assays, and MSC isolation in the supplemental Data.
Results
LAMA4 distribution in mouse BM cellular niches
We determined LAMA4 distribution in BM vascular structure by confocal imaging. We observed colocalization of LAMA4 with SCA1 and endomucin, markers for arteriolar and sinusoidal vessels, respectively, indicating that LAMA4 is expressed in arteriolar and sinusoidal vessels. Scattered expression of LAMA4 was detected in intersinusoidal spaces of BM (Figure 1A-B). As expected, no LAMA4 was detected in Lama4−/− BM (Figure 1C), showing the specificity of the LAMA4 antibody staining. To examine Lama4 expression in specific BM cellular niches, we performed quantitative PCR (Q-PCR) of FACS-sorted MSCs (CD45−LIN−CD31−CD44−CD51+SCA1+), MPCs (CD45−LIN−CD31−CD44−CD51+SCA1−), and ECs (CD45−LIN−CD31+) from mouse BM. Notably, Lama4 mRNA was expressed in Lama4+/+ BM MSCs and MPCs, even at a higher level than that in ECs (Figure 1D-E). Low or undetectable expression was found in mature stromal cells (CD44−SCA1−CD51− and CD44+) and CD45+/TER119+ hematopoietic cells (Figure 1E).
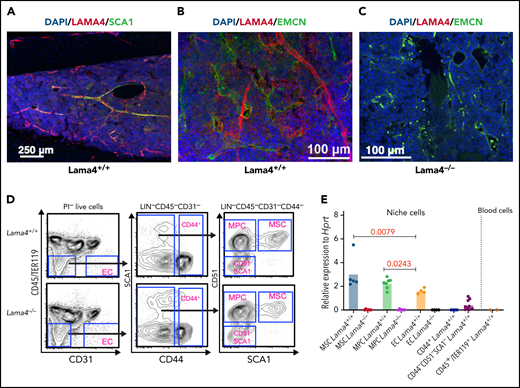
LAMA4 is expressed in vascular and mesenchymal cells of adult mouse BM. Representative confocal image of immunofluorescence staining of LAMA4, SCA1, and endomucin (EMCN) in BM of adult mice at steady-state. (A,B) Colocalization of LAMA4 and SCA1(A) or EMCN (B) in BM of adult Lama4+/+ mouse femur. (C) LAMA4 staining in Lama4−/− mouse tibia shows specificity of LAMA4 staining. (D) Representative FACS profile for sorting mesenchymal stem cells (MSCs), mesenchymal progenitors (MPC), endothelial cells (ECs), and mature stromal cells (CD44+ and CD44−SCA1−CD51−) from adult Lama4+/+ and Lama4−/− mouse BM. (E) Q-PCR analysis of Lama4 mRNA expression in the Lama4+/+ and Lama4−/− stromal cells and CD45+TER119+ hematopoietic cells. Each dot represents the average values of triplicate measurements. The horizontal bars indicate the mean of the expression levels. The data are from 2 to 4 independent sorting experiments. The P values in the figure were determined by unpaired Student t test (MPCs vs ECs) or Mann-Whitney test (MSCs vs ECs).
LAMA4 is expressed in vascular and mesenchymal cells of adult mouse BM. Representative confocal image of immunofluorescence staining of LAMA4, SCA1, and endomucin (EMCN) in BM of adult mice at steady-state. (A,B) Colocalization of LAMA4 and SCA1(A) or EMCN (B) in BM of adult Lama4+/+ mouse femur. (C) LAMA4 staining in Lama4−/− mouse tibia shows specificity of LAMA4 staining. (D) Representative FACS profile for sorting mesenchymal stem cells (MSCs), mesenchymal progenitors (MPC), endothelial cells (ECs), and mature stromal cells (CD44+ and CD44−SCA1−CD51−) from adult Lama4+/+ and Lama4−/− mouse BM. (E) Q-PCR analysis of Lama4 mRNA expression in the Lama4+/+ and Lama4−/− stromal cells and CD45+TER119+ hematopoietic cells. Each dot represents the average values of triplicate measurements. The horizontal bars indicate the mean of the expression levels. The data are from 2 to 4 independent sorting experiments. The P values in the figure were determined by unpaired Student t test (MPCs vs ECs) or Mann-Whitney test (MSCs vs ECs).
Impaired hematopoiesis recovery in Lama4−/− mice following irradiation
The effect of Lama4 deletion on hematopoietic lineage production remains to be examined. Under steady-state, we detected lower platelets (PLTs) and reduced frequency of granulocytes (CD11B+GR1+) but no significant changes in white blood cells and red blood cells (RBCs) in peripheral blood (PB) of Lama4−/− mice (supplemental Figure 1). There was no difference in BM cellularity and frequency of hematopoietic stem and progenitor cells (HSPCs) in Lama4+/+ and Lama4−/− mouse BM (supplemental Figure 2A-D).
To study the role of Lama4 in hematopoiesis under stress, we analyzed hematopoiesis recovery after irradiation (7Gy) in Lama4−/− and Lama4+/+ mice (supplemental Figure 1A). The Lama4−/− mice displayed a slower recovery of RBCs and PLTs in PB (supplemental Figure 1B). The increased mean corpuscular volume of Lama4−/− RBCs suggested defective maturation. FACS analysis showed reduced numbers of granulocytes (CD11B+GR1+) but increased T cells in Lama4−/− PB (supplemental Figure 1C). In addition, we observed slower regeneration of granulocyte-macrophage progenitors and megakaryocyte progenitors (MkPs), but higher frequencies of megakaryocyte-erythrocyte progenitors and erythrocyte precursor (CFU-E) in Lama4−/− BM and spleen at 4 to 6 weeks postirradiation (supplemental Figure 1D-E). The phenotypically defined HSCs remained unchanged (supplemental Figure 1D). The changes in CFU-E and CFU-GM were confirmed by CFU-C assays and further supported by the increased spleen cellularity (supplemental Figures 1E and 3A-C). This finding, together with the reduced production of mature RBCs and PLTs, points to a possible differentiation block of erythropoiesis and megakaryopoiesis between the intermediate progenitors and the mature lineages. Taken together, these data suggest that Lama4 is important for efficient hematopoiesis regeneration following irradiation-induced stress.
Lama4 deletion in host BM niche leads to acceleration of AML and greater loss of normal hematopoiesis
We have recently found that Lama4 is upregulated in BM MSCs and MPCs in AML mice.5 Data mining in Prognoscan31 suggests that lower expression of LAMA4 in BM mononuclear cells (MNCs) in the patients with AML correlates with poor survival rate (supplemental Figure 4). However, the functional impact on AML progression remains unknown. To investigate this, we employed a transplantation-induced MLL-AF9 AML mouse model without prior irradiation (Figure 2A). Interestingly, Lama4−/−-recipient mice developed AML faster than Lama4+/+ mice, reflected in the earlier onset of symptomatic AML, reduced survival rate, and increased AML burden in BM and PB (Figure 2B-C,E; supplemental Figure 5). The AML-initiating stem cells (LSCs, KIT+)32 were significantly increased in Lama4−/− mouse BM and PB relative to that in Lama4+/+ mice (Figure 2D-E; supplemental Figure 5C). Concurrently, Lama4−/− mice showed more pronounced splenomegaly (Figure 2F), and their normal hematopoiesis seemed to be further decreased although not statistically significant (Figure 2G; supplemental Figure 5D-F). Lama4−/− mice had increased egress of leukemic cells and normal HSPCs in PB (Figure 2H), as well as more severe reduction in PLTs (Figure 2I) than Lama4+/+ mice. The PLT width (PDW) was correspondingly increased, indicating further impaired PLT maturation in the Lama4−/− mice during AML progression (Figure 2I). Notably, we did not observe any homing advantage of the AML cells into Lama4−/− recipient BM and spleen (Figure 2J-K; supplemental Figure 5H), pointing to enhanced proliferation rather than homing of AML cells that caused AML acceleration in Lama4−/− mice.

Deletion of Lama4 accelerates AML progression. (A) Experimental layout for inducing AML by transplanting MLL-AF9 AML cells in nonirradiated young adult mice. The primary MLL-AF9 AML cells expressing CD45.1 were injected via tail vein into the CD45.2+Lama4+/+ and Lama4−/− mice at the dose of 100 000 cells per mouse. AML was monitored by blood cell counting using Sysmex, AML engraftment analysis by FACS, and spleen weight. (B) The survival rate of the Lama4+/+- and Lama4−/−-recipient mice after AML cell injection. The mice were found dead or moribund mice were terminated due to ethical reasons. (C) AML burden in Lama4+/+ and Lama4−/− mouse BM post-AML cell injection. The data shown are the percent of CD45.1+ cells of total live cells in BM (left) and the proportion of the mice with less or more than 20% AML cells in BM (right). The difference between the 2 groups on the right panel was determined by χ-square test. (D) The frequency of AML-initiating stem cells (LSCs) in Lama4+/+ and Lama4−/− mouse BM at 24 days post-AML cell injection. The LSCs were determined by the percent of KIT+CD45+ cells in the mouse BM by FACS. (E) The frequency of circulating AML cells in Lama4+/+ and Lama4−/− mouse PB at day 24 post-AML injection. (F) Spleen weight of Lama4+/+ and Lama4−/− AML mice at day 24 post-AML injection. (G) The residual host-derived CD45.2+ cells in BM at day 17 and 24 post-AML cell injection. (H) The residual host CD45.2+ cells in PB at day 24 post-AML transplantation. (I) Platelet (PLT) counts and PDW in Lama4+/+ and Lama4−/− mouse PB at 24 days after AML injection. (J) Experimental layout for assessing homing of the AML cells into Lama4+/+ and Lama4−/− mice 3 hours after transplantation. CD45.1+ AML cells (10 million per mouse) were transplanted into the mice via tail vein injection without prior irradiation. Blood, femurs, and spleen of the recipients were harvested 3 hours after transplantation, and homing of donor CD45.1+ AML cells were examined by FACS based on CD45.1 expression. (K) The frequencies of the AML cells in total nucleated cells in the recipient PB, BM, and spleen. The statistical difference was determined by an unpaired parametric Student t test. The horizontal bars represent mean values. Each dot represents the individual recipient mouse. (L) Experimental design for assessing AML relapse after transplantation of normal BM cells. The Lama4+/+ and Lama4−/− mice were first injected with 100 000 AML cells. On day 24 post-AML cell injection, the recipient mice were subjected to total body irradiation (TBI) followed by transplantation of 5 million normal BM MNCs. The AML relapse was then monitored by FACS of the AML burden in PB and BM. (M) The survival rate of the Lama4+/+ and Lama4−/− AML mice after BM transplantation. The mice were found dead or sacrificed because of a moribund state due to the fast AML relapse. (N) Percentages of AML cells in BM and PB of Lama4+/+ and Lama4−/− mice post-AML relapse. The analysis was done at the endpoint when the mice were moribund. The data were from 2 to 3 independent experiments. Each dot represents the data from 1 mouse. The horizontal bars are median values. The P values were determined by the Mann-Whitney U test. See also in supplemental Figures 4-6.
Deletion of Lama4 accelerates AML progression. (A) Experimental layout for inducing AML by transplanting MLL-AF9 AML cells in nonirradiated young adult mice. The primary MLL-AF9 AML cells expressing CD45.1 were injected via tail vein into the CD45.2+Lama4+/+ and Lama4−/− mice at the dose of 100 000 cells per mouse. AML was monitored by blood cell counting using Sysmex, AML engraftment analysis by FACS, and spleen weight. (B) The survival rate of the Lama4+/+- and Lama4−/−-recipient mice after AML cell injection. The mice were found dead or moribund mice were terminated due to ethical reasons. (C) AML burden in Lama4+/+ and Lama4−/− mouse BM post-AML cell injection. The data shown are the percent of CD45.1+ cells of total live cells in BM (left) and the proportion of the mice with less or more than 20% AML cells in BM (right). The difference between the 2 groups on the right panel was determined by χ-square test. (D) The frequency of AML-initiating stem cells (LSCs) in Lama4+/+ and Lama4−/− mouse BM at 24 days post-AML cell injection. The LSCs were determined by the percent of KIT+CD45+ cells in the mouse BM by FACS. (E) The frequency of circulating AML cells in Lama4+/+ and Lama4−/− mouse PB at day 24 post-AML injection. (F) Spleen weight of Lama4+/+ and Lama4−/− AML mice at day 24 post-AML injection. (G) The residual host-derived CD45.2+ cells in BM at day 17 and 24 post-AML cell injection. (H) The residual host CD45.2+ cells in PB at day 24 post-AML transplantation. (I) Platelet (PLT) counts and PDW in Lama4+/+ and Lama4−/− mouse PB at 24 days after AML injection. (J) Experimental layout for assessing homing of the AML cells into Lama4+/+ and Lama4−/− mice 3 hours after transplantation. CD45.1+ AML cells (10 million per mouse) were transplanted into the mice via tail vein injection without prior irradiation. Blood, femurs, and spleen of the recipients were harvested 3 hours after transplantation, and homing of donor CD45.1+ AML cells were examined by FACS based on CD45.1 expression. (K) The frequencies of the AML cells in total nucleated cells in the recipient PB, BM, and spleen. The statistical difference was determined by an unpaired parametric Student t test. The horizontal bars represent mean values. Each dot represents the individual recipient mouse. (L) Experimental design for assessing AML relapse after transplantation of normal BM cells. The Lama4+/+ and Lama4−/− mice were first injected with 100 000 AML cells. On day 24 post-AML cell injection, the recipient mice were subjected to total body irradiation (TBI) followed by transplantation of 5 million normal BM MNCs. The AML relapse was then monitored by FACS of the AML burden in PB and BM. (M) The survival rate of the Lama4+/+ and Lama4−/− AML mice after BM transplantation. The mice were found dead or sacrificed because of a moribund state due to the fast AML relapse. (N) Percentages of AML cells in BM and PB of Lama4+/+ and Lama4−/− mice post-AML relapse. The analysis was done at the endpoint when the mice were moribund. The data were from 2 to 3 independent experiments. Each dot represents the data from 1 mouse. The horizontal bars are median values. The P values were determined by the Mann-Whitney U test. See also in supplemental Figures 4-6.
To test the impact of Lama4−/− environment on AML relapse, we transplanted normal BM MNCs into lethally irradiated Lama4−/− and Lama4+/+ mice after they developed AML to mimic clinical therapeutic transplantation (Figure 2L). We observed a faster relapse of AML in the Lama4−/− mice, as shown by earlier recurrence of symptoms and reduced survival (Figure 2M-N). Notably, reconstitution from normal donor BM in lethally irradiated Lama4−/− mice was comparable to that in Lama4+/+ recipients shortly posttransplantation (supplemental Figure 6A), excluding the possibility that the faster relapse of AML in Lama4−/− mice was due to impaired donor cell homing and regeneration in Lama4−/− mice. These data suggest Lama4 expression is required for maintaining normal hematopoiesis while restricting AML proliferation.
Reduced vessel density and vessel-associated megakaryocytes in Lama4−/− mouse BM
BM vasculature plays an important role in maintaining normal hematopoiesis by impacting hematopoietic cell proliferation, migration, and differentiation.33Lama4 deletion resulted in impaired microvessel maturation perinatally.19 We examined BM vascular structure to explore whether it is related to the hematopoiesis regeneration defects and AML progression in Lama4−/− mice. We observed reduced vessel density in Lama4−/− mice at steady-state and 6 weeks after irradiation (Figure 3A; supplemental Figure 7A-B). Concurrently, CD31 fluorescence intensity in Lama4−/− BM was reduced (supplemental Figure 7C). No difference in vessel leakiness was detected using Evans blue (data not shown).
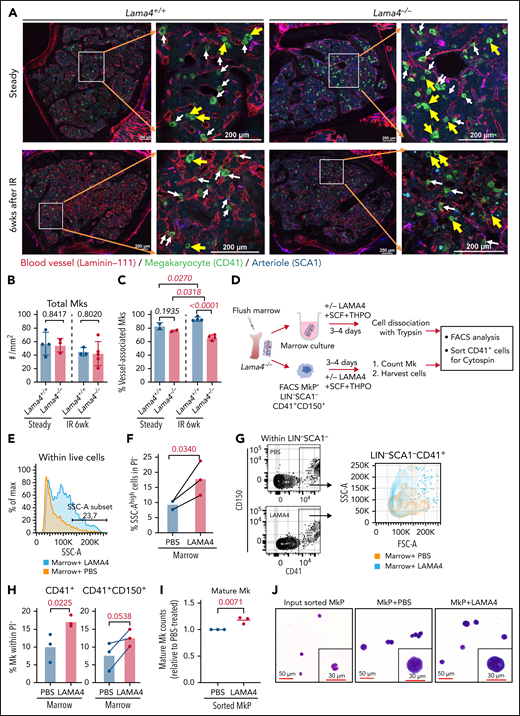
Reduced megakaryocyte (Mk)-vessel interactions in adult Lama4−/− mouse BM and the effect of LAMA4 protein on Mk maturation. (A) Confocal images showing fluorescence staining of Mks and blood vessels in Lama4+/+ and Lama4−/− femur sections 6 weeks (6wk) after the irradiation (IR). The enlarged images show the MKs (CD41+) associated with vessels stained by pan-laminin antibody (laminin-111), and arterioles were stained with SCA1. Mks were identified by CD41 staining. The yellow arrows point to Mks that are not adjacent to vessels, and white arrows point to Mks associated with vessels. (B-C) The total number (B) and vessel-associated Mks (C) in Lama4+/+ and Lama4−/− femurs at steady-state and 6 weeks after IR. Each dot represents the average value of 2 measurements from 2 bone sections from 1 sample. The Mks in 2 different microscopic areas (metaphysis and diaphysis) in each section were counted and calculated. The horizontal bars represent mean ± SD. Data were from 3 to 4 mice of each genotype. The P values were determined by unpaired parametric t test. (D) Experimental setup for assessing the impact of recombinant LAMA4 protein for Mk maturation in in vitro culture. Lama4−/− marrow from femurs and sorted MkP (LIN−SCA1−CD41+CD150+) were cultured with LAMA4 proteins or vehicle (PBS) for 4 days in the presence of SCF and THPO. Mk-counting and FACS were performed on day 3 and day 4, respectively. (E) Representative histograms showing size distribution (FSC-A) of total live cells from Lama4−/− marrow cultured with LAMA4 proteins or PBS. (F) The percent of cells with high intensity of SSC-A after stimulation with LAMA4 proteins or PBS. The cells were first gated from PI−LIN− cells. (G) Representative FACS profiles showing gating of total CD41+ cells from Lama4−/− marrow cultured with LAMA4 proteins or PBS (left) and histograms showing the cell size distribution indicated by the intensity of FSC-A (right). (H) The percent of CD41+ and CD41+CD150+ cells from the marrow after culture with LAMA4 proteins or PBS. The cells were first gated from PI−LIN−SCA1− cells. (I) Normalized mature Mk counts 3 days after culture with LAMA4 or PBS. The numbers of Mks counted in each experiment were normalized to that in PBS-treated culture due to variations among independent experiments. (J) May Grunwald-Giemsa staining showing the morphology of CD41+ Mks sorted from the cultures on day 4. The data in D-J were from 3 independent experiments with 3 Lama4−/− mice (2 female and 1 male). See also supplemental Figure 7
Reduced megakaryocyte (Mk)-vessel interactions in adult Lama4−/− mouse BM and the effect of LAMA4 protein on Mk maturation. (A) Confocal images showing fluorescence staining of Mks and blood vessels in Lama4+/+ and Lama4−/− femur sections 6 weeks (6wk) after the irradiation (IR). The enlarged images show the MKs (CD41+) associated with vessels stained by pan-laminin antibody (laminin-111), and arterioles were stained with SCA1. Mks were identified by CD41 staining. The yellow arrows point to Mks that are not adjacent to vessels, and white arrows point to Mks associated with vessels. (B-C) The total number (B) and vessel-associated Mks (C) in Lama4+/+ and Lama4−/− femurs at steady-state and 6 weeks after IR. Each dot represents the average value of 2 measurements from 2 bone sections from 1 sample. The Mks in 2 different microscopic areas (metaphysis and diaphysis) in each section were counted and calculated. The horizontal bars represent mean ± SD. Data were from 3 to 4 mice of each genotype. The P values were determined by unpaired parametric t test. (D) Experimental setup for assessing the impact of recombinant LAMA4 protein for Mk maturation in in vitro culture. Lama4−/− marrow from femurs and sorted MkP (LIN−SCA1−CD41+CD150+) were cultured with LAMA4 proteins or vehicle (PBS) for 4 days in the presence of SCF and THPO. Mk-counting and FACS were performed on day 3 and day 4, respectively. (E) Representative histograms showing size distribution (FSC-A) of total live cells from Lama4−/− marrow cultured with LAMA4 proteins or PBS. (F) The percent of cells with high intensity of SSC-A after stimulation with LAMA4 proteins or PBS. The cells were first gated from PI−LIN− cells. (G) Representative FACS profiles showing gating of total CD41+ cells from Lama4−/− marrow cultured with LAMA4 proteins or PBS (left) and histograms showing the cell size distribution indicated by the intensity of FSC-A (right). (H) The percent of CD41+ and CD41+CD150+ cells from the marrow after culture with LAMA4 proteins or PBS. The cells were first gated from PI−LIN−SCA1− cells. (I) Normalized mature Mk counts 3 days after culture with LAMA4 or PBS. The numbers of Mks counted in each experiment were normalized to that in PBS-treated culture due to variations among independent experiments. (J) May Grunwald-Giemsa staining showing the morphology of CD41+ Mks sorted from the cultures on day 4. The data in D-J were from 3 independent experiments with 3 Lama4−/− mice (2 female and 1 male). See also supplemental Figure 7
Mk maturation is controlled by their adhesive interactions with the vascular niche.34-36 We analyzed the colocalization of Mk with vasculature in Lama4−/− BM. While there was no difference in the total number of Mk in Lama4−/− mouse BM, the Mks adjacent to sinusoidal vessels were reduced in Lama4−/− mouse BM by about 20% 6 weeks after irradiation (Figure 3A,C). Such a reduction was not observed at steady-state (Figure 3C). To examine whether this defect could be rescued by exogenous LAMA4 proteins, we cultured Lama4−/− marrow or LIN−SCA1−CD41+CD150+ MkPs with recombinant LAMA4 (Figure 3D). We observed increased Mk maturation after culture with LAMA4, reflected in a higher proportion of CD41+ cells with larger size and higher granularity (Figure 3E-J). Altogether, our data suggest LAMA4 plays a role in Mk maturation.
Mesenchymal niche alterations in Lama4−/− mice
BM MSCs and MPCs are critical for maintaining normal hematopoiesis and regulating myeloid malignancies.1 Therefore, we next investigated the impact of Lama4 deletion on BM mesenchymal cell niches. FACS analysis showed reduced frequency of MPCs and ECs in Lama4−/− mouse BM at steady-state (Figure 4A-B). However, the frequency of Lama4−/− MSCs and mature stromal cells remained unchanged under steady state (Figure 4A-B; supplemental Figure 7E) and 6 weeks postsublethal irradiation (supplemental Figure 7F), which was supported by similar CFU-Fs in Lama4+/+ and Lama4−/− mouse BM (Figure 4C). To explore the molecular mechanisms contributing to the impaired hematopoiesis regeneration, we determined erythropoietin (EPO) level in blood plasma and found reduced EPO in Lama4−/− mice 6 weeks postirradiation (supplemental Figure 7G). This might explain the impaired erythropoiesis in Lama4−/− mice postirradiation. Additionally, Q-PCR showed no dramatic molecular alterations at steady-state in several genes known to be important for hematopoiesis in Lama4−/− BM MSCs, MPCs, and ECs (Figure 4D). However, Angpt1 and Cxcl10 were downregulated, but Tgfb1 was upregulated in Lama4−/− MPCs at 6 weeks postirradiation (Figure 4E). Thus, we decided to perform global gene expression profiling by RNA sequencing on these stressed BM MPCs.
![Mesenchymal niche alterations in adult Lama4−/− mouse BM. BM MSCs, MPCs, and ECs from 3 to 4 month-old Lama4+/+ and Lama4−/− mice were analyzed. Data are from 3 to 7 independent experiments. (A) A representative FACS profiles showing gating strategy for sorting the MSCs, MPCs, and ECs. (B) Frequency of MSCs, MPCs, and ECs within total BM MNCs at steady-state. (C) CFU-Fs in BM of Lama4+/+ and Lama4−/− mice during steady-state and postirradiation (IR). (D-E) Q-PCR of HSC niche factors in Lama4+/+ and Lama4−/− BM MSCs, MPCs, and ECs at steady-state (D) and 6 weeks after sublethal irradiation (E). Data are mean ± SD from 3 independent experiments. (F) Volcano plot showing adjusted P value (padj) vs log2fold changes [Log2(FC)] of each gene tested between Lama4−/− and Lama4+/+ BM MPCs from RNA sequencing data. The MPCs were sorted from Lama4+/+ and Lama4−/− mice at 6 weeks post–sublethal irradiation. Genes with padj <0.05 and Log2(FC) >1 are partly highlighted and annotated. (G) GSEA reveals the gene sets enriched in Lama4+/+ and Lama4−/− BM MPCs. False discovery rate (FDR)-q value (adjusted P value) and gene set sizes are indicated by the red color and the size of the circles. NES, Normalized enrichment scores. (H) Relative expression of the genes of ECM molecules and inflammatory cytokines in the Lama4−/− BM MPCs compared with Lama4+/+ MPCs 6 weeks post–sublethal irradiation. The P values in the panels were determined by unpaired 1-tailed or 2-tailed parametric Student t test depending on the data distribution. See also supplemental Figures 7-9.](https://ash.silverchair-cdn.com/ash/content_public/journal/blood/139/20/10.1182_blood.2021011510/3/m_bloodbld2021011510f4a.png?Expires=1765886948&Signature=mTgeTDa9w9GbBxCTmy6nYQeeh0PAjL8laAxUgfPhBOPSazr4jYDiksIMnDjVozf~~spy9rgHGKSZGoKDlswVsioKCFOt7XvDKNItQyJlsoI5vVqo0Ek31YN~zswc2Uu2TNni0jWj9rZRAw1EeRbwSX~onFl6cTnt53SPsJd~LL4HNFOwHazIep-GJfw8tBlsnagbUcTvzCEo6RHI7JVjqRZ6Yp3LGJuVlwz~xznpPYbRCOr2Jkg8nY0gA07wkNgwD5k5rYE03Q0Tm8S3AVkxuRvCktd8lTNmHs1IJYv5egWemeQwuTCzoR4CRyZGeTE1NetP235Hv~oQbM-jLe2HPw__&Key-Pair-Id=APKAIE5G5CRDK6RD3PGA)
![Mesenchymal niche alterations in adult Lama4−/− mouse BM. BM MSCs, MPCs, and ECs from 3 to 4 month-old Lama4+/+ and Lama4−/− mice were analyzed. Data are from 3 to 7 independent experiments. (A) A representative FACS profiles showing gating strategy for sorting the MSCs, MPCs, and ECs. (B) Frequency of MSCs, MPCs, and ECs within total BM MNCs at steady-state. (C) CFU-Fs in BM of Lama4+/+ and Lama4−/− mice during steady-state and postirradiation (IR). (D-E) Q-PCR of HSC niche factors in Lama4+/+ and Lama4−/− BM MSCs, MPCs, and ECs at steady-state (D) and 6 weeks after sublethal irradiation (E). Data are mean ± SD from 3 independent experiments. (F) Volcano plot showing adjusted P value (padj) vs log2fold changes [Log2(FC)] of each gene tested between Lama4−/− and Lama4+/+ BM MPCs from RNA sequencing data. The MPCs were sorted from Lama4+/+ and Lama4−/− mice at 6 weeks post–sublethal irradiation. Genes with padj <0.05 and Log2(FC) >1 are partly highlighted and annotated. (G) GSEA reveals the gene sets enriched in Lama4+/+ and Lama4−/− BM MPCs. False discovery rate (FDR)-q value (adjusted P value) and gene set sizes are indicated by the red color and the size of the circles. NES, Normalized enrichment scores. (H) Relative expression of the genes of ECM molecules and inflammatory cytokines in the Lama4−/− BM MPCs compared with Lama4+/+ MPCs 6 weeks post–sublethal irradiation. The P values in the panels were determined by unpaired 1-tailed or 2-tailed parametric Student t test depending on the data distribution. See also supplemental Figures 7-9.](https://ash.silverchair-cdn.com/ash/content_public/journal/blood/139/20/10.1182_blood.2021011510/3/m_bloodbld2021011510f4b.png?Expires=1765886948&Signature=HShqMP~i1Bql1uQjHGn23AUVluer0Zq9MqIuNTtmSHvpkMZUr3cCrpbP~YUJqa8JOvyF-OZHOM0HYvECs0lZK14yY1UoV2EvFEmK9GdcTfIIR1uCoBmKe~ncEBqt-C~ym-yI1HNFu~Dci5eTk2MNMOIBRlPWNX6MId9glIDIACF8gloT2wvot5-j9hf7cDgr4Ey~YJPlp5TgLVHrTySCHTiDqkpYCyR~mJmp-Wxy3~dBBRlUnCz53j3Zltfr98XX1~10JkUyOBh~G9-Evq9ww8km-x98EhMR5nQ0WZQ~-AywfCeRGcra~zD1rOn0Aprm10fdSl0DM~elayyFSEnzxA__&Key-Pair-Id=APKAIE5G5CRDK6RD3PGA)
![Mesenchymal niche alterations in adult Lama4−/− mouse BM. BM MSCs, MPCs, and ECs from 3 to 4 month-old Lama4+/+ and Lama4−/− mice were analyzed. Data are from 3 to 7 independent experiments. (A) A representative FACS profiles showing gating strategy for sorting the MSCs, MPCs, and ECs. (B) Frequency of MSCs, MPCs, and ECs within total BM MNCs at steady-state. (C) CFU-Fs in BM of Lama4+/+ and Lama4−/− mice during steady-state and postirradiation (IR). (D-E) Q-PCR of HSC niche factors in Lama4+/+ and Lama4−/− BM MSCs, MPCs, and ECs at steady-state (D) and 6 weeks after sublethal irradiation (E). Data are mean ± SD from 3 independent experiments. (F) Volcano plot showing adjusted P value (padj) vs log2fold changes [Log2(FC)] of each gene tested between Lama4−/− and Lama4+/+ BM MPCs from RNA sequencing data. The MPCs were sorted from Lama4+/+ and Lama4−/− mice at 6 weeks post–sublethal irradiation. Genes with padj <0.05 and Log2(FC) >1 are partly highlighted and annotated. (G) GSEA reveals the gene sets enriched in Lama4+/+ and Lama4−/− BM MPCs. False discovery rate (FDR)-q value (adjusted P value) and gene set sizes are indicated by the red color and the size of the circles. NES, Normalized enrichment scores. (H) Relative expression of the genes of ECM molecules and inflammatory cytokines in the Lama4−/− BM MPCs compared with Lama4+/+ MPCs 6 weeks post–sublethal irradiation. The P values in the panels were determined by unpaired 1-tailed or 2-tailed parametric Student t test depending on the data distribution. See also supplemental Figures 7-9.](https://ash.silverchair-cdn.com/ash/content_public/journal/blood/139/20/10.1182_blood.2021011510/3/m_bloodbld2021011510f4c.png?Expires=1765886948&Signature=fO8EWUsuIfk3KiIcrF8SpdaMpdNqO~U5He9LZDgMFrwMtPOlOtxPAFhcXP3MuLRK6qI2KrNg2qSu4PcDsV385YchQCJO4tck6m6x6-aSDw9FFsiG2kBZCQIXq-isk0kSQahhiM81QIc6eKUrUl5ZZynVgwI9POpsO3EtAbW1s-hS4sRJlUa71pw4-7xkWkNWCI5nhRQ6TusgU0~fhfxo3U43O6Pw-kfGH9C1DvRuUpECYQ7v5S~ckspPgi3UQ1uAgjVUuascEY8Rq7fab8KxSBzzf-GHIpxRbMVtbLwX0qSG9r9g~zYdXj5XvXHgQofnQNAnS9UBUVjAUygxyeB5CQ__&Key-Pair-Id=APKAIE5G5CRDK6RD3PGA)
Mesenchymal niche alterations in adult Lama4−/− mouse BM. BM MSCs, MPCs, and ECs from 3 to 4 month-old Lama4+/+ and Lama4−/− mice were analyzed. Data are from 3 to 7 independent experiments. (A) A representative FACS profiles showing gating strategy for sorting the MSCs, MPCs, and ECs. (B) Frequency of MSCs, MPCs, and ECs within total BM MNCs at steady-state. (C) CFU-Fs in BM of Lama4+/+ and Lama4−/− mice during steady-state and postirradiation (IR). (D-E) Q-PCR of HSC niche factors in Lama4+/+ and Lama4−/− BM MSCs, MPCs, and ECs at steady-state (D) and 6 weeks after sublethal irradiation (E). Data are mean ± SD from 3 independent experiments. (F) Volcano plot showing adjusted P value (padj) vs log2fold changes [Log2(FC)] of each gene tested between Lama4−/− and Lama4+/+ BM MPCs from RNA sequencing data. The MPCs were sorted from Lama4+/+ and Lama4−/− mice at 6 weeks post–sublethal irradiation. Genes with padj <0.05 and Log2(FC) >1 are partly highlighted and annotated. (G) GSEA reveals the gene sets enriched in Lama4+/+ and Lama4−/− BM MPCs. False discovery rate (FDR)-q value (adjusted P value) and gene set sizes are indicated by the red color and the size of the circles. NES, Normalized enrichment scores. (H) Relative expression of the genes of ECM molecules and inflammatory cytokines in the Lama4−/− BM MPCs compared with Lama4+/+ MPCs 6 weeks post–sublethal irradiation. The P values in the panels were determined by unpaired 1-tailed or 2-tailed parametric Student t test depending on the data distribution. See also supplemental Figures 7-9.
Mesenchymal niche alterations in adult Lama4−/− mouse BM. BM MSCs, MPCs, and ECs from 3 to 4 month-old Lama4+/+ and Lama4−/− mice were analyzed. Data are from 3 to 7 independent experiments. (A) A representative FACS profiles showing gating strategy for sorting the MSCs, MPCs, and ECs. (B) Frequency of MSCs, MPCs, and ECs within total BM MNCs at steady-state. (C) CFU-Fs in BM of Lama4+/+ and Lama4−/− mice during steady-state and postirradiation (IR). (D-E) Q-PCR of HSC niche factors in Lama4+/+ and Lama4−/− BM MSCs, MPCs, and ECs at steady-state (D) and 6 weeks after sublethal irradiation (E). Data are mean ± SD from 3 independent experiments. (F) Volcano plot showing adjusted P value (padj) vs log2fold changes [Log2(FC)] of each gene tested between Lama4−/− and Lama4+/+ BM MPCs from RNA sequencing data. The MPCs were sorted from Lama4+/+ and Lama4−/− mice at 6 weeks post–sublethal irradiation. Genes with padj <0.05 and Log2(FC) >1 are partly highlighted and annotated. (G) GSEA reveals the gene sets enriched in Lama4+/+ and Lama4−/− BM MPCs. False discovery rate (FDR)-q value (adjusted P value) and gene set sizes are indicated by the red color and the size of the circles. NES, Normalized enrichment scores. (H) Relative expression of the genes of ECM molecules and inflammatory cytokines in the Lama4−/− BM MPCs compared with Lama4+/+ MPCs 6 weeks post–sublethal irradiation. The P values in the panels were determined by unpaired 1-tailed or 2-tailed parametric Student t test depending on the data distribution. See also supplemental Figures 7-9.
RNA sequencing revealed distinct transcriptional profiles of the Lama4+/+ and Lama4−/− MPCs sorted from mice at 6 weeks postsublethal irradiation (supplemental Figure 8A). The Lama4 depletion led to an overall dysregulation of mRNA expression in MPC, with 381 downregulated genes and 59 upregulated genes in Lama4−/− BM MPCs, compared with Lama4+/+ MPCs (Figure 4F). As expected, Lama4 was the most downregulated gene in the Lama4−/− MPCs (Figure 4F). Interestingly, several genes encoding ECM proteins that, together with laminins, are assembled to form the structural matrix network in BM37,38 were downregulated. These include Fn1, Fbn1, Nid1, and thrombospondin-1 (Thbs1) (Figure 4F; supplemental Figure 8B-C). Meanwhile, genes associated with inflammatory response were upregulated in Lama4−/− MPCs (Figure 4F-H; supplemental Figure 8D). Strikingly, while the genes related to oxidative phosphorylation were enriched in the Lama4−/− MPCs, pointing to a possible enhanced ROS production, the genes related to ROS metabolic pathway and antioxidant activity were also upregulated in these cells (Figure 4G; supplemental Figure 8E-F). Furthermore, several proapoptotic genes were significantly upregulated (supplemental Figure 8G), although the functional consequence remained to be tested. In addition, we observed downregulation of CD49f/integrin α6 (Itga6), a main receptor for LAMA4 in Lama4−/− MSCs and MPCs (supplemental Figures 8C and 9; Figure 4F). CD146, a newly identified LAMA4 receptor,13 was also reduced in steady-state Lama4−/− ECs and stressed Lama4−/− MSCs (supplemental Figure 9).
These data suggest that Lama4 deficiency alters BM cellular niche composition and molecular profile, which may result in abnormal niche support for normal hematopoiesis and AML.
Lama4−/− MSCs promote AML proliferation and confer chemoresistance to cytarabine (Ara-C)
To explore the functional contribution of Lama4−/− BM MSCs to AML proliferation and therapy response, we performed cobblestone area-forming cell (CAFC) assay using Lama4−/− and Lama4+/+ BM MSCs in coculture with MLL-AF9 AML cells (Figure 5A). The AML cells were cultured with the MSCs for 2 days prior to adding Ara-C to allow for AML cell adhesion and migration. Following an additional 5 to 7 days, the AML LSCs were assessed functionally by CAFC counts and phenotypically by FACS for the cells expressing KIT or CD36, both of which have been reported to be LSC markers.29,32,39 We observed more CAFCs in the culture with Lama4−/− MSCs than with Lama4+/+ MSCs, although the total numbers of AML cells were comparable (Figure 5B-D), suggesting enhanced support of Lama4−/− MSCs for the growth of AML LSCs. Post-Ara-C treatment, more CAFCs, and KIT+ AML LSCs, but not CD36+ AML cells, were maintained in the culture with Lama4−/− MSC compared with that Lama4+/+ MSCs (Figure 5C-F). ROS level has been shown to be an important factor determining the survival of AML cells after chemotherapy.27,29,40 Therefore, we analyzed ROS levels in the MSCs and AML cells in the coculture and observed lower ROS levels in Lama4−/− MSCs and the AML cells cocultured with them than those in the Lama4+/+ MSC cocultures (Figure 5G). These data suggest that Lama4−/− MSCs could promote AML LSC proliferation and chemoprotection.
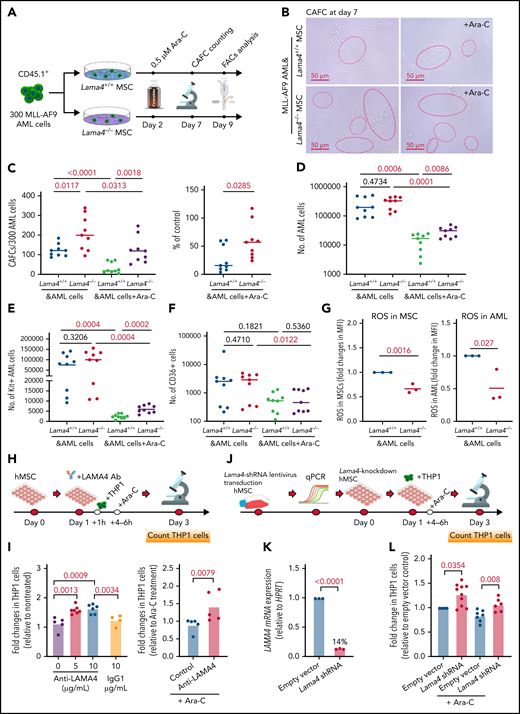
Lama4-deficient MSCs promote AML cell proliferation and chemoresistance in vitro. (A) Experimental layout for assessing AML LSCs by cobblestone area-forming cell (CAFC) assay using Lama4+/+ and Lama4−/− BM MSCs. The expanded BM MSCs were seeded 24 hours before plating 150 to 300 MLL-AF9 AML cells. Cytarabine (Ara-C) was added to reach a final concentration of 0.5 μM 2 days after the initiation of the coculture to allow for maximal cell-cell adhesion and migration. The CAFCs were counted on day 7 and collected on day10 for FACS analysis. (B) Representative image of CAFCs from AML cells after coculture with the MSCs. (C) The number of CAFCs generated from the AML cells after coculture with the MSCs in the presence or absence of Ara-C (left) and the reduction of CAFCs after Ara-C treatment (right). The reduction was shown as a percent of the corresponding control cultures without Ara-C. (D) The total number of AML cells in the cultures with MSCs. (E) The number of AML LSCs (KIT+ cells) in the cocultures. (F) The number of chemoresistant AML LSCs (CD36+) in the cocultures. The data shown are from 3 independent experiments, and horizontal bars show median values. The P values shown in the panels were determined by an unpaired Student t test. (G) ROS levels were detected by FACS in the MSCs (left) and AML cells (right) on days 7 to 10 in the coculture. The data shown are fold changes in ROS MFI relative to that in the control culture with Lama4+/+ MSCs, and from 3 independent experiments. Each dot indicates the average value of triplicate measurement in each experiment. The P values shown in the panels were determined by an unpaired Student t test. (H) Experimental layout for testing the impact of LAMA4 on patient-derived AML cell proliferation and drug response using antibody inhibition. The monoclonal antibody against human LAMA4 was used to neutralize LAMA4 in human BM MSCs in the coculture with human AML cells (THP1). The antibodies were added 1 hour prior to seeding THP1 cells to achieve LAMA4 neutralization in the MSCs. Ara-C was added at 4 to 6 hours postseeding THP1 cells to allow efficient interactions of the cells with the MSCs. (I) Fold changes in THP1 cell counts after anti-LAMA4 antibody treatment (left) and in combination with Ara-C (right). (J) Experimental design for testing the impact of LAMA4 on human AML cell proliferation and drug response using LAMA4 knockdown strategy. LAMA4 knockdown in human MSCs was generated by lentiviral LAMA4 shRNA transduction. The selected LAMA4 knockdown MSCs were then used for coculture with THP1 cells with or without Ara-C. (K) LAMA4 mRNA expression was reduced in the human MSCs by lentiviral shRNA directed against LAMA4. (L) Fold changes in THP1 cell counts in the coculture with LAMA4 knockdown MSCs and the scrambled controls.
Lama4-deficient MSCs promote AML cell proliferation and chemoresistance in vitro. (A) Experimental layout for assessing AML LSCs by cobblestone area-forming cell (CAFC) assay using Lama4+/+ and Lama4−/− BM MSCs. The expanded BM MSCs were seeded 24 hours before plating 150 to 300 MLL-AF9 AML cells. Cytarabine (Ara-C) was added to reach a final concentration of 0.5 μM 2 days after the initiation of the coculture to allow for maximal cell-cell adhesion and migration. The CAFCs were counted on day 7 and collected on day10 for FACS analysis. (B) Representative image of CAFCs from AML cells after coculture with the MSCs. (C) The number of CAFCs generated from the AML cells after coculture with the MSCs in the presence or absence of Ara-C (left) and the reduction of CAFCs after Ara-C treatment (right). The reduction was shown as a percent of the corresponding control cultures without Ara-C. (D) The total number of AML cells in the cultures with MSCs. (E) The number of AML LSCs (KIT+ cells) in the cocultures. (F) The number of chemoresistant AML LSCs (CD36+) in the cocultures. The data shown are from 3 independent experiments, and horizontal bars show median values. The P values shown in the panels were determined by an unpaired Student t test. (G) ROS levels were detected by FACS in the MSCs (left) and AML cells (right) on days 7 to 10 in the coculture. The data shown are fold changes in ROS MFI relative to that in the control culture with Lama4+/+ MSCs, and from 3 independent experiments. Each dot indicates the average value of triplicate measurement in each experiment. The P values shown in the panels were determined by an unpaired Student t test. (H) Experimental layout for testing the impact of LAMA4 on patient-derived AML cell proliferation and drug response using antibody inhibition. The monoclonal antibody against human LAMA4 was used to neutralize LAMA4 in human BM MSCs in the coculture with human AML cells (THP1). The antibodies were added 1 hour prior to seeding THP1 cells to achieve LAMA4 neutralization in the MSCs. Ara-C was added at 4 to 6 hours postseeding THP1 cells to allow efficient interactions of the cells with the MSCs. (I) Fold changes in THP1 cell counts after anti-LAMA4 antibody treatment (left) and in combination with Ara-C (right). (J) Experimental design for testing the impact of LAMA4 on human AML cell proliferation and drug response using LAMA4 knockdown strategy. LAMA4 knockdown in human MSCs was generated by lentiviral LAMA4 shRNA transduction. The selected LAMA4 knockdown MSCs were then used for coculture with THP1 cells with or without Ara-C. (K) LAMA4 mRNA expression was reduced in the human MSCs by lentiviral shRNA directed against LAMA4. (L) Fold changes in THP1 cell counts in the coculture with LAMA4 knockdown MSCs and the scrambled controls.
To explore if stroma-derived LAMA4 had any impact on human AML cell growth and therapy response, we employed function inhibition strategies by using anti-LAMA4 neutralizing antibodies (Figure 5H) or LAMA4 shRNA knocking down (Figure 5J-K). Similar to the finding in the mouse model, LAMA4 neutralization or shRNA knockdown in human BM MSCs increased human AML cell (THP1) proliferation and chemoresistance to Ara-C (Figure 5I,L). These data indicate a suppressive role of LAMA4 in human AML cell proliferation and therapy response.
Differential molecular response of Lama4+/+ and Lama4−/− MSCs to AML cells
It has been shown that niche-remodeling by leukemia may contribute to forming a self-reinforcing niche that promotes leukemia progression but impairs normal hematopoiesis. We hypothesized that Lama4−/− stroma could be more susceptible to the remodeling by AML cells. To test this, we exposed Lama4+/+ and Lama4−/− MSCs to the AML cells in vitro and determined their molecular response by RNA sequencing (Figure 6A). This revealed distinct gene expression profiles of Lama4+/+ and Lama4−/− MSCs before and after AML exposure (Figure 6B) with significantly more genes altered in Lama4−/− MSCs than Lama4+/+ MSCs (826 vs 229) post-AML exposure, indicating increased susceptibility of Lama4−/− MSCs by AML (Figure 6C-D). Many genes, including genes associated with focal adhesion and inflammatory response, were uniquely altered in the Lama4−/− MSCs post-AML exposure (Figure 6D-F). Among those, Lama5, Lama2, Lama1, and their receptors were upregulated in the Lama4−/− MSCs, consistent with previous reports.16,19 However, genes related to cytokine-cytokine receptor interactions were enriched in Lama4−/− MSCs before AML exposure and did not alter further post-AML exposure. Glutathione metabolism plays an important role in preventing cellular damages induced by ROS, the level of which has been shown to be important for the survival of AML cells after chemotherapy.27,29,40 Glutathione metabolism genes were enriched in Lama4−/− MSCs (Figure 6H), which might be associated with the reduced ROS levels in Lama4−/− MSCs (Figure 5G). Notably, some niche factors like Kitl, Il11, Cxcl12, and Spp1, known to be dysregulated in leukemia,7,21,41-43 were more significantly altered in Lama4−/− MSCs post-AML exposure than in Lama4+/+ MSCs (Figure 6I). Among those, Kitl/Scf and Il11 have been shown to promote AML cell proliferation,32 while Angpt1 and Angpt2 were reported to be associated with therapy response and prognosis in leukemia.44-47 In addition, Sipa1 loss in the BM niche could induce hematopoietic cell transformation.9 Lower Sipa1 expression was detected in Lama4−/− MSCs. Along with these molecular alterations in the stroma, RNA sequencing of the AML cells cocultured with Lama4−/− MSCs showed downregulation of cell proliferation inhibitors, including Egr1,48Neo1,49 and arachidonic acid metabolism-associated genes (Figure 6J), which can be activated in response to oxidative stress.50 These changes might have caused the enhanced AML proliferation in the culture with Lama4−/− MSCs. Together, these data provide molecular evidence for the enhanced AML supportive and protective functions of Lama4−/− MSCs.
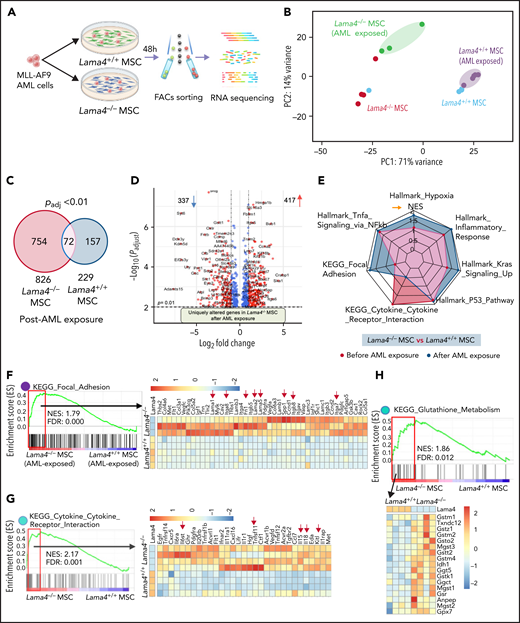

Molecular remodeling of Lama4+/+ and Lama4−/− MSCs post-AML exposure. BM MSCs initially sorted from 3 to 4 month-old Lama4+/+ and Lama4−/− mice were sorted for RNA sequencing 48 hours post coculture with MLL-AF9 AML cells. Data are from 3 independent experiments. (A) Experimental setup. (B) PCA plot of Lama4+/+ and Lama4−/− MSCs with or without being exposed to the AML cells. (C) Venn diagram summarizing differentially expressed genes in Lama4+/+ and Lama4−/− MSCs after being exposed to the AML cells. (D) Volcano plot showing uniquely altered genes in Lama4−/− MSCs after AML exposure. Data shown are padj vs Log2(FC) of each gene tested between Lama4−/− and Lama4+/+ MSCs from RNA sequencing data. (E) Radar plot showing selected gene sets highly enriched in Lama4−/− MSCs in comparison with Lama4+/+ MSCs, before (green) and after (purple) AML exposure. (F-H) GSEA plots showing enrichment of genes related to focal adhesion (F), cytokine-receptor interaction (G), and glutathione metabolism (H) in Lama4−/− MSCs relative to Lama4+/+ MSCs post-AML exposure and the heatmap of genes in the leading edge (red frame). FDR-q value (adjusted P value). NES, normalized enrichment scores. (I) Gene expression of the selected cytokines and growth factors in Lama4−/− MSCs compared with Lama4+/+ MSCs before and after AML exposure. The data are extracted from RNA-sequencing analysis. The P values in the panels were determined by unpaired 1-tailed or 2-tailed parametric Student t test depending on the data distribution. (J) Gene expression in the AML cells cocultured with Lama4+/+ or Lama4−/− MSCs. The data are extracted from RNA-sequencing analysis. The top panels show the expression of cell proliferation-related genes, and the lower panel is the GSEA plot showing the downregulation of genes related to arachidonic acid metabolism. The P values in the panels were determined by unpaired 1-tailed parametric Student t test.
Molecular remodeling of Lama4+/+ and Lama4−/− MSCs post-AML exposure. BM MSCs initially sorted from 3 to 4 month-old Lama4+/+ and Lama4−/− mice were sorted for RNA sequencing 48 hours post coculture with MLL-AF9 AML cells. Data are from 3 independent experiments. (A) Experimental setup. (B) PCA plot of Lama4+/+ and Lama4−/− MSCs with or without being exposed to the AML cells. (C) Venn diagram summarizing differentially expressed genes in Lama4+/+ and Lama4−/− MSCs after being exposed to the AML cells. (D) Volcano plot showing uniquely altered genes in Lama4−/− MSCs after AML exposure. Data shown are padj vs Log2(FC) of each gene tested between Lama4−/− and Lama4+/+ MSCs from RNA sequencing data. (E) Radar plot showing selected gene sets highly enriched in Lama4−/− MSCs in comparison with Lama4+/+ MSCs, before (green) and after (purple) AML exposure. (F-H) GSEA plots showing enrichment of genes related to focal adhesion (F), cytokine-receptor interaction (G), and glutathione metabolism (H) in Lama4−/− MSCs relative to Lama4+/+ MSCs post-AML exposure and the heatmap of genes in the leading edge (red frame). FDR-q value (adjusted P value). NES, normalized enrichment scores. (I) Gene expression of the selected cytokines and growth factors in Lama4−/− MSCs compared with Lama4+/+ MSCs before and after AML exposure. The data are extracted from RNA-sequencing analysis. The P values in the panels were determined by unpaired 1-tailed or 2-tailed parametric Student t test depending on the data distribution. (J) Gene expression in the AML cells cocultured with Lama4+/+ or Lama4−/− MSCs. The data are extracted from RNA-sequencing analysis. The top panels show the expression of cell proliferation-related genes, and the lower panel is the GSEA plot showing the downregulation of genes related to arachidonic acid metabolism. The P values in the panels were determined by unpaired 1-tailed parametric Student t test.
To further determine the chemoprotective role of Lama4−/− niche in vivo and the potential mechanism, we tested the therapy response of AML cells to Ara-C by injecting the MLL-AF9+ AML cells expressing fluorescence protein DsRed into sublethally irradiated Lama4−/− mice. Lama4−/−-recipient mice showed faster AML progression (Figure 7A; supplemental Figure 10). Following a 5-day Ara-C injection, all mice developed leukopenia (supplemental Figure 10B) and ameliorated splenomegaly, showing the efficacy of the treatment. However, the spleens in Lama4−/− mice remained bigger than in Lama4+/+ mice 1 day post-Ara-C treatment (Figure 7B). The residual AML cells and the enrichment of CD36+ cells appeared to be higher in Lama4−/− mouse BM post-Ara-C treatment (Figure 7C). Similar to the findings in vitro, the ROS levels in the AML cells from Lama4−/− recipient PB was reduced compared with that in Lama4+/+ mice during AML development (Figure 7D). In contrast to the dramatic elevation of ROS in the AML cells from Lama4+/+ recipient BM after Ara-C treatment, ROS levels remained unchanged in the AML cells from Lama4−/− recipients (Figure 7E). These data suggest stronger antioxidant activities of Lama4−/− niche for AML cells.


Lama4−/− niche confers AML cell chemoresistance to Ara-C via modulating ROS levels associated with increased mitochondrial transfer from MSCs to AML cells. (A) AML onset and survival of Lama4+/+ and Lama4−/− mice following injection of DsRed-expressing MLL-AF9+ cells. The mice were irradiated with 6 Gy prior to the AML cell injection. The AML engraftment in PB was analyzed by FACS 14 days after AML cell injection. The mice were then injected with normal saline (NS) or Ara-C for 5 days starting at day 15. (B) Spleen size in Lama4+/+ and Lama4−/− mice 1 to 3 days post-Ara-C or NS treatment. (C) The frequency of residual total AML cells (left) and enrichment of chemoresistant CD36+ AML cells (right) in Lama4+/+ and Lama4−/− mouse BM at 1 day after the last injection of Ara-C. The percent of CD36+ cells were presented as fold changes relative to the average percent of the cells in NS-treated mice. (D) ROS levels in the AML cells from Lama4+/+- and Lama4−/−-recipient PB at 14 days post-AML cell injection. The left panel shows MFI of ROS in the AML cells, and the right panel is representative FACS histograms of ROS levels. (E) ROS levels in the AML cells from Lama4+/+- and Lama4−/−-recipient BM at 1-day post-Ara-C treatment. The data shown are the MFIs of ROS (left) and fold changes (right) in ROS levels in the AML cells post-Ara-C treatment relative to the mean values in NS-treated mice in each experiment. (F) Experimental setup for testing mitochondrial transfer from MSCs to AML cells. The MLL-AF9+ AML cells were cocultured with Lama4+/+ and Lama4−/− MSCs prelabeled with MitoTracker green. The MSC-derived mitochondria were analyzed for the MFI of MitoTracker in AML cells at 24 hours postcoculture by FACS and confocal microscopy. (G) Simultaneous detection of ROS, mitochondrial mass (Mitotracker+), and mitochondrial membrane potential (MMP) Tetramethylrhodamine methyl ester perchlorate (TMRM)+ in Lama4+/+ and Lama4−/− MSCs prior to the cocultures. (H) Representative FACS histograms showing MFIs of MitoTracker, TMRM, and ROS in the MSCs prior to the cocultures. (I) Increased mitochondrial mass in Lama4−/− MSCs cocultured with AML cells. Data shown are fold changes in MitoTracker MFI in Lama4−/− MSCs compared with that in Lama4+/+ MSCs. (J) Mitochondrial transfer from BM MSCs to AML cells in the cocultures with and without Ara-C treatment. Data shown are relative MitoTracker MFI in the AML cells cocultured with Lama4−/− MSCs to that with Lama4+/+ MSCs. (K) Representative FACS profiles showing mitoTracker+ AML cells 24 hours postcoculture with Lama4+/+ and Lama4−/− MSCs. (L) Confocal images showing MSC-derived mitochondria (green) in the AML cells at 24 hours postcoculture. The data shown are from 2 to 4 independent experiments, and horizontal bars show median values. The P values shown in the panels were determined by 2-tailed or 1-tailed unpaired Student t test. See also in supplemental Figure 10-11.
Lama4−/− niche confers AML cell chemoresistance to Ara-C via modulating ROS levels associated with increased mitochondrial transfer from MSCs to AML cells. (A) AML onset and survival of Lama4+/+ and Lama4−/− mice following injection of DsRed-expressing MLL-AF9+ cells. The mice were irradiated with 6 Gy prior to the AML cell injection. The AML engraftment in PB was analyzed by FACS 14 days after AML cell injection. The mice were then injected with normal saline (NS) or Ara-C for 5 days starting at day 15. (B) Spleen size in Lama4+/+ and Lama4−/− mice 1 to 3 days post-Ara-C or NS treatment. (C) The frequency of residual total AML cells (left) and enrichment of chemoresistant CD36+ AML cells (right) in Lama4+/+ and Lama4−/− mouse BM at 1 day after the last injection of Ara-C. The percent of CD36+ cells were presented as fold changes relative to the average percent of the cells in NS-treated mice. (D) ROS levels in the AML cells from Lama4+/+- and Lama4−/−-recipient PB at 14 days post-AML cell injection. The left panel shows MFI of ROS in the AML cells, and the right panel is representative FACS histograms of ROS levels. (E) ROS levels in the AML cells from Lama4+/+- and Lama4−/−-recipient BM at 1-day post-Ara-C treatment. The data shown are the MFIs of ROS (left) and fold changes (right) in ROS levels in the AML cells post-Ara-C treatment relative to the mean values in NS-treated mice in each experiment. (F) Experimental setup for testing mitochondrial transfer from MSCs to AML cells. The MLL-AF9+ AML cells were cocultured with Lama4+/+ and Lama4−/− MSCs prelabeled with MitoTracker green. The MSC-derived mitochondria were analyzed for the MFI of MitoTracker in AML cells at 24 hours postcoculture by FACS and confocal microscopy. (G) Simultaneous detection of ROS, mitochondrial mass (Mitotracker+), and mitochondrial membrane potential (MMP) Tetramethylrhodamine methyl ester perchlorate (TMRM)+ in Lama4+/+ and Lama4−/− MSCs prior to the cocultures. (H) Representative FACS histograms showing MFIs of MitoTracker, TMRM, and ROS in the MSCs prior to the cocultures. (I) Increased mitochondrial mass in Lama4−/− MSCs cocultured with AML cells. Data shown are fold changes in MitoTracker MFI in Lama4−/− MSCs compared with that in Lama4+/+ MSCs. (J) Mitochondrial transfer from BM MSCs to AML cells in the cocultures with and without Ara-C treatment. Data shown are relative MitoTracker MFI in the AML cells cocultured with Lama4−/− MSCs to that with Lama4+/+ MSCs. (K) Representative FACS profiles showing mitoTracker+ AML cells 24 hours postcoculture with Lama4+/+ and Lama4−/− MSCs. (L) Confocal images showing MSC-derived mitochondria (green) in the AML cells at 24 hours postcoculture. The data shown are from 2 to 4 independent experiments, and horizontal bars show median values. The P values shown in the panels were determined by 2-tailed or 1-tailed unpaired Student t test. See also in supplemental Figure 10-11.
Enhanced mitochondrial transfer from Lama4−/− MSCs to AML cells during chemotherapy
Mitochondrial transfer from BM MSCs to AML cells has been recognized as a mechanism of niche support of AML cells with antioxidant defense, and this transfer increases upon chemotherapy.23-25,27 To examine whether mitochondrial transfer mediated the antioxidative stress effect of Lama4−/− MSCs on AML cells, we cocultured MLL-AF9 AML cells with MSCs prelabeled with MitoTracker and analyzed MSC-derived mitochondria in AML 24 hours after coculture (Figure 7F). First, the Lama4−/− MSCs prior to the coculture displayed increased mitochondrial mass and MMP, and correspondingly, lower ROS levels (Figure 7G-H). The mitochondrial mass in the Lama4−/− MSCs remained higher after the coculture with AML cells compared with that in the Lama4+/+ MSCs (Figure 7I), suggesting increased ROS-scavenging capacity in Lama4−/− MSCs. Interestingly, mitochondrial transfer from Lama4−/− MSCs to the AML cell was increased compared with that from Lama4+/+ MSCs during Ara-C treatment in the coculture (Figure 7J-K). However, this was not observed in the cultures without Ara-C (Figure 7L). The mitochondrial transfer was mostly mediated by direct cell interactions since it diminished by 90% without cell contact (supplemental Figure 11). These data together indicate that Lama4−/− MSCs provide stronger metabolic support for AML cells by donating more mitochondrial antioxidant tools.
Discussion
Here we have, for the first time, demonstrated that Lama4-deficient environment accelerates AML progression and relapse. In addition, Lama4 deficiency in BM MSCs promotes proliferation and drug resistance of the AML LSCs in vitro. Importantly, the finding holds true also in human AML cells cocultured with human MSCs upon LAMA4 antibody inhibition and knockdown. Mechanistically, the protective role of Lama4−/− niche seems to be associated with enhanced ROS-scavenging activity of Lama4−/− cellular niches and mitochondrial transfer from the MSCs to AML cells, which could contribute by detoxifying chemotherapy-induced ROS overproduction in the AML cells. Our study provides the first evidence for the critical role of Lama4 for hematopoiesis regeneration under stress and AML progression.
Although LAMA4 was shown to be mainly expressed in BM vasculature in mice,16,51,52 its expression in BM mesenchymal cell niches remained unknown. We here describe Lama4 expression in mouse BM MSCs and MPCs, opening a possibility that LAMA4 may mediate crosstalk between mesenchymal cell niches and HSPCs that are known to express LAMA4 receptor integrin α6/CD49F.53,54
The impact of LAMA4 on BM niche maintenance is demonstrated by the phenotypic and molecular alterations in BM ECs and MPCs in Lama4−/− mice. The molecular niche alterations in Lama4−/− mice, particularly the enhanced inflammatory response that is reported to negatively regulate normal hematopoiesis,11,55,56 might result in the impaired hematopoiesis regeneration observed here following irradiation and accelerate AML development. BM sinusoidal ECs provide not only a cellular platform whereby HSPCs migrate and reconstitute but also a conduit for the release of mature hematopoietic cells to the circulation.57-60 The reduced vessel-associated megakaryocytes in Lama4−/− BM after the irradiation could affect Mk transendothelial protrusion and maturation. Our finding that LAMA4 proteins increased Mk maturation in vitro support this notion.
We here, for the first time, demonstrated the critical role of Lama4 in AML progression and drug response. Deletion of Lama4 accelerated AML development and relapse. Importantly, inhibition/knockdown of LAMA4 in human BM MSCs also promoted human AML cell proliferation and chemoprotection, warranting future studies on the potential therapeutic effects of LAMA4 proteins in patient AML cells.
Drug resistance is the main challenge for the successful treatment of AML. Recently, increasing evidence has indicated the contribution of BM stromal cells to chemoresistance of leukemic cells by regulating metabolic activities of the leukemic cells via directly donating mitochondrial transfer to leukemic blasts or indirectly altering the balance between ROS production and detoxification.23,24,28 An important finding in our study is that Lama4−/− MSCs confer AML LSC chemoresistance. Mechanistically, Lama4−/− MSCs displayed enhanced glutathione redox activities and a substantial mitochondrial transfer into the AML cells. This is accompanied by the reduced ROS level in the AML cells from Lama4−/− niche, presenting a possible mechanism that Lama4−/− niches balance ROS levels in AML cells, thereby attenuating the chemotherapeutic effects from Ara-C on the AML cells. This notion is supported by the increased mitochondrial mass and the enriched genes related to ROS-scavenging activity in Lama4−/− MSCs.
In summary, our study presents the first evidence for the impact of Lama4 on hematopoiesis regeneration and AML progression. Lama4−/− mesenchymal niches promote AML progression and increase drug resistance, possibly by providing antioxidant support via increased mitochondrial transfer. Therefore, strategies to reactivate LAMA4 receptor-signaling pathways may be a promising therapeutic approach to suppress AML and sensitize AML LSCs to chemotherapy, thereby improving therapeutic efficacy for AML.
Acknowledgments
This study was supported by the Swedish Research Council (2019-01361), Swedish Childhood Society (PR2015-0142, FoAss13/015, and PR2017/0154, PR2020-0166), Swedish Cancer Society (CAN2017/774, 19 0092 SIA, and 20 1222 PjF), Åke Olsson Foundation, Radiumhemmets Forskningsfonder and Karolinska Institute, Wallenberg Institute for Regenerative Medicine, Karolinska Institute doctoral education (KID) funding (2-1293/2014), Stiftelsen Clas Groschinskys Minnesfond (ref:M16 50) to H.Q. FACS analysis and cell sorting were performed at MedH Flow Cytometry core facility (Karolinska Institute), supported by KI/SLL. The confocal images were obtained at the LCI facility/Nikon Center of Excellence, Karolinska Institutet, supported by grants from the Knut and Alice Wallenberg Foundation, Swedish Research Council, KI infrastructure, Centre for Innovative Medicine, and Jonasson Center at the Royal Institute of Technology. All major computations were performed on resources provided by the Swedish National Infrastructure for Computing (SNIC) through Uppsala Multidisciplinary Center for Advanced Computational Science (UPPMAX) under Project sens2018540. The authors also thank the core facility at NEO, BEA, Bioinformatics, and Expression Analysis, which is supported by the board of research at the Karolinska Institute and the research committee at the Karolinska hospital.
Authorship
Contribution: H.Q., M.K., and H.C. have participated in conception and design, performing experiments, collection and assembly of data, data analysis and interpretation, and manuscript writing; L.S., P.X., and A.-S.J. performed experiments, collected data, and assisted with data analysis; K.T. provided Lama4−/− mice; T.S. provided antibodies against laminin chains; J.Z.-P. assisted shRNA knockdown experiments; J.U. provided human samples and scientific input; M.E. and J.W. provided scientific input/advice and manuscript-reviewing; and all authors have proved the final version of the manuscript.
Conflict-of-interest disclosure: The authors declare no competing financial interests.
The current affiliation for M.K. is Cell Sheet Tissue Engineering Center, Department of Pharmaceutics and Pharmaceutical Chemistry, Health Sciences, University of Utah, Salt Lake City, UT.
Correspondence: Hong Qian, Center for Hematology and Regenerative Medicine, Department of Medicine, Karolinska Institute, Karolinska University Hospital, SE-141 86 Stockholm, Sweden; e-mail: hong.qian@ki.se.
The online version of this article contains a data supplement.
The publication costs of this article were defrayed in part by page charge payment. Therefore, and solely to indicate this fact, this article is hereby marked “advertisement” in accordance with 18 USC section 1734.

This feature is available to Subscribers Only
Sign In or Create an Account Close Modal