

Key Points
Fecal microbial diversity is an independent predictor of CD4 T-cell count 3 months after HCT in recipients of CD34-selected allografts.
Increased fecal relative abundance of Staphylococcus in the early post-HCT period is independently associated with worse CD4 T-cell count.

Abstract
Low intestinal microbial diversity is associated with poor outcomes after allogeneic hematopoietic cell transplantation (HCT). Using 16S rRNA sequencing of 2067 stool samples and flow cytometry data from 2370 peripheral blood samples drawn from 894 patients who underwent allogeneic HCT, we have linked features of the early post-HCT microbiome with subsequent immune cell recovery. We examined lymphocyte recovery and microbiota features in recipients of both unmodified and CD34-selected allografts. We observed that fecal microbial diversity was an independent predictor of CD4 T-cell count 3 months after HCT in recipients of a CD34-selected allograft, who are dependent on de novo lymphopoiesis for their immune recovery. In multivariate models using clinical factors and microbiota features, we consistently observed that increased fecal relative abundance of genus Staphylococcus during the early posttransplant period was associated with worse CD4 T-cell recovery. Our observations suggest that the intestinal bacteria, or the factors they produce, can affect early lymphopoiesis and the homeostasis of allograft-derived T cells after transplantation.
Introduction
Allogeneic hematopoietic cell transplantation (allo-HCT) is a potentially curative therapy for hematological malignancies, immune deficiencies, and marrow failure syndromes.1,2 Allo-HCT involves conditioning with chemotherapy and/or total body irradiation followed by the infusion of a stem-cell–containing allograft. Grafts may be “unmodified” whereby the donor cells infused into the patient have not undergone any postcollection cellular purification, or “modified” such that stem cell or lymphocyte populations are manipulated before infusion (eg, CD34+ stem cell selection).3-7
Immune recovery in the CD34-selected setting relies on lymphopoiesis from stem and progenitor cells, as very few mature lymphocytes are transferred in the graft, whereas recovery in the unmodified setting reflects both stem and progenitor function as well as maintenance (with or without expansion) of infused donor lymphocytes.3-14 Comparing immune reconstitution and microbial features between recipients of different graft types offers a unique opportunity to explore microbe-derived factors that may support posttransplant immune recovery at the level of true marrow-derived lymphopoiesis (in the recipients of CD34-selected grafts) as well as the combination of stem cell–derived populations and peripheral maintenance (in the unmodified graft types).4,11-15 This is important because immune recovery is critical for long-term survival in the allo-HCT group. In pediatric patients, reaching a threshold of 50 CD4+ T cells per microliter by day 100 has been associated with improved overall survival.16-18 In adults, the minimum cell count that predicts improved outcomes is less well defined, but the total lymphocyte count has been associated with better outcomes after transplantation.19-23 In clinical practice, the lymphocyte subsets are routinely measured, and a CD4 count of more than 200 cells per microliter in many centers leads to the cessation of prophylactic antimicrobial therapies.24 Importantly, it is also clear from several studies that patients with poor immune recovery after allo-HCT have higher nonrelapse mortality (NRM), higher risk of chronic graft-versus-host-disease (GVHD), and shorter overall survival.22,25-29
Several preclinical studies have described an influence of the intestinal microbiome on hematopoiesis, most likely via NOD1-dependent signaling of microbe-derived ligands directly to the hematopoietic stem cell.30-38 Germ-free mice have profound defects in mucosal lymphoid tissues in the lamina propria. Furthermore, they have fewer hematopoietic stem cells in bone marrow (BM), lower circulating lymphocyte counts, and impaired T-cell function and are highly susceptible to bacterial, fungal, and viral infections.30-32 Interestingly, the susceptibility of germ-free or antibiotic-treated mice to infections and their decreased immune cell counts can be reversed after restoration of the intestinal microbiome with fecal transplantation.32-34
In the context of post-HCT hematopoiesis, our group’s previous work has demonstrated that the depletion of intestinal microbiota in mice with broad-spectrum antibiotics leads to a decrease in the number of circulating lymphocytes in the early weeks after syngeneic transplant of BM into irradiated recipient mice.39 This phenotype was reversed by administration of sucrose, which suggests that intestinal bacteria’s ability to extract energy from the diet may be essential to supporting optimal lymphopoiesis, especially during the metabolically expensive process of repopulating the hematopoietic system after ablative conditioning.39 In a recent clinical study from our center, Schluter et al40 analyzed daily blood counts, drug exposures, and fecal taxonomic composition in a cohort of 1582 patients.40 Higher fecal relative abundance of the Staphylococcus and Ruminococcus genera was associated with increased lymphocyte counts in the early posttransplant period when daily blood counts are available.40 Taken together, the results of these mouse and human studies highlight that the intestinal microbial community may facilitate optimal immune reconstitution after transplantation. In the present study, we therefore explored the link between the intestinal microbiota and immune recovery using 16S rRNA sequencing of stool samples and clinical flow cytometry data to define lymphocyte subsets.
Methods
Patient selection
Patients who underwent allogeneic HCT at Memorial Sloan Kettering Cancer Center from September 2009 through November 2019 were screened for inclusion. Initial inclusion criteria were broad: at least 1 stool sample available for analysis between day −30 and day +730 relative to transplant and the availability of flow cytometry measurements of lymphocyte subsets. The flow cytometry assays had been conducted during routine clinical care. We included patients with any hematologic malignancy or nonmalignant hematologic condition and any conditioning regimen type and/or degree of donor-recipient match. Furthermore, we specifically sought to compare 3 allograft sources: unmodified BM, peripheral blood stem cell (PBSC) grafts, and ex vivo CD34-selected grafts. To avoid bias, we excluded patients who were undergoing a second or third allogeneic HCT (although those with prior autologous HCT were included), patients with primary engraftment failure, a small number of patients who had received BM CD34-selected grafts, and patients who died within 100 days after allo-HCT, as this was the time of our primary end point for CD4 recovery. The flow diagram describing patient selection is shown in supplemental Figure 1 (available on the Blood Web site), patient characteristics in Table 1, and exposure to different drugs in supplemental Tables 1, 2, and 3. The association of GVHD prophylaxis with CD4 counts is shown in supplemental Figure 2. Patients provided written consent to an institutional review board–approved biospecimen-collection protocol.
Clinical characteristics
| All patients(n = 894) | |
|---|---|
| Sex, n (%) | |
| Male | 546 (61.1) |
| Female | 348 (38.9) |
| Age, mean (SD) | 54.93 (12.62) |
| Disease, n (%) | |
| Leukemia | 420 (47.0) |
| Lymphoma | 166 (18.6) |
| MDS/MPN | 199 (22.3) |
| Multiple myeloma | 93 (10.4) |
| Nonmalignant | 16 (1.8) |
| Intensity, n (%) | |
| Ablative | 589 (65.9) |
| Reduced intensity | 191 (21.4) |
| Nonablative | 114 (12.8) |
| Total body irradiation, n (%) | 273 (30.5) |
| Donor match, n (%) | |
| Related haploidentical | 44 (4.9) |
| Related identical | 288 (32.2) |
| Related nonidentical | 4 (0.4) |
| Unrelated identical | 447 (50.0) |
| Unrelated nonidentical | 111 (12.4) |
| Grafts, n (%) | |
| BM | 86 (9.6) |
| PBSCs, | 361 (40.4) |
| PBSCs, CD34+ | 447 (49.9) |
| GVHD (first 100 d), n (%) | 346 (39.8) |
| Grade 0-1 | 628 (70.2) |
| Grade 2-4 | 266 (29.8) |
| Lower gut GVHD | 84 (9.4) |
| Grade 0-1 | 855 (95.6) |
| Grade 2-4 | 39 (4.4) |
MDS, myelodysplastic syndrome; MPN, myeloproliferative neoplasm; SD, standard deviation.
Stool samples and sequencing
Stool samples were processed by disruption of bacterial cell walls with silica bead-beating, isolation of nucleic acids and amplifying and sequencing the 16S ribosomal-RNA gene V4-V5 variable region on the Illumina MiSeq platform, as previously described.41 Amplicon sequence variants were called using the DADA2 pipeline42 and mapped in the National Center for Biotechnology Information’s 16S rRNA sequence database using BLAST.43 α-Diversity was calculated using the Simpson reciprocal index.
Flow cytometry
Lymphocyte cell subsets were evaluated by flow cytometry of fresh peripheral blood samples between posttransplant days 21 and 730. To calculate the lymphocyte counts, we used routine clinical hematology parameters (measured via the Sysmex XN hematology analyzer) to first calculate the total white blood cell count and then the lymphocyte subsets by using hierarchical clustering. The subsets are reported as a percentage of the lymphocytes. The surface markers used to identify each lymphocyte population were CD3, CD4, CD8, CD16, CD19, CD56, and CD45 for the lymphocyte subsets (CD4, CD8, CD19, and NK cells) and were performed according to Clinical Laboratory Improvement Amendments (CLIA) standards.22 Supplemental Table 4 includes the median lymphocyte counts per subset and graft type at day 100.
Statistical analysis
Patients were divided into high and low periengraftment α-diversity groups, using the global median, during the peri–neutrophil-engraftment period (post-HCT day 7-21). Overall survival (OS) and NRM were estimated by the Kaplan-Meier method. Comparisons across groups stratified by allograft type (unmodified BM or PBSCs or CD34-selected PBSCs). A generalized estimating equation (GEE) was used to evaluate the association between periengraftment α-diversity and lymphocyte recovery. Periengraftment α-diversity and lymphocyte recovery were used as continuous variables for the GEE analysis, which included counts for the first 200 days after HCT. At the landmark of day 100, OS and NRM were evaluated for patients with above- and below-median CD4 recovery. Correlation of CD4 and CD8 counts was assessed using the Pearson correlation coefficient.
Comparison of microbial composition
We explored the microbiome composition of periengraftment samples by using t-distributed stochastic neighbor embedding (tSNE), a method that reduces multidimensional data for visualiation.44 The fecal microbiome composition of the patients was assessed by linear discriminant analysis of effect size (LEfSe), a computational algorithm that combines tests for statistical significance and biological relevance to identify the microbiome features most likely to explain differences between 2 groups.45 The observed differences from LEfSe analysis were validated with Wilcoxon rank-sum univariate testing, by comparing the abundance of these taxa in patients with above- and below-median CD4 recovery. Permutational multivariate analysis of variance (PERMANOVA) testing, a multivariate nonparametric statistical test, was used to compare patients who had high vs low lymphocyte recovery per graft type, using the dispersion of the patients’ microbiome composition at the genus level and each group’s centroids.46 Taxa (at the genus level) present at a median relative abundance of 2 × 10⁻³ and present in at least 5% of the samples were included for assessment for LEfSe, tSNE, and PERMANOVA.
Modeling taxonomic abundance with multivariate models
To separate the association of microbial community composition with CD4 recovery from the influence of the various patient variables, the data were modeled using Microbiome Multivariable Association with Linear Models (MaAsLin2).47 In short, the taxonomic composition was assessed using each patient’s unique identifier as a random effect and the following fixed effects: per-graft-type ranked CD4 counts, age, disease, conditioning intensity, exposure to high doses of steroids, total body irradiation, anti-thymocyte globulin (ATG) exposure, and cytomegalovirus reactivation. In addition, it was observed that most of the patients exhibited monodominated stool communities. Additional models were run that included a sample’s Simpson reciprocal index as a fixed effect to account for monodomination, to address the possibility that when diversity is not included, the model risks attributing CD4 recovery to the differential presence or absence of specific taxa or pathways when it could be better explained by the gain or loss of sample complexity. The base linear model was used on the log-scaled abundances. Hits were considered significant if they had a Benjamini-Hochberg–corrected P < .05.
Results
Higher periengraftment α-diversity is associated with increased OS and decreased NRM after allo-HCT
We first examined the dynamics of microbial α-diversity in stool samples from all patients in the cohort (n = 5930), separated by graft type: unmodified BM (n = 86 patients), unmodified PBSCs (n = 361 patients), and CD34-selected PBSC (PBSC CD34+; n = 447 patients) grafts. α-Diversity is a summary measure that combines the number of unique bacteria present and their relative frequencies, measured in this study using Simpson’s reciprocal index.41 The overall pattern of change in α-diversity, with a decline during the early days after HCT, followed by slow improvement, was seen in all 3 graft sources and is similar to previous observations of our group and others (Figure 1A; supplemental Figure 3A-B; supplemental Table 5).41,54-56 Consistent with our previous studies,41 in this cohort of 667 patients, above-median periengraftment α-diversity was associated with increased OS and decreased NRM (P = .005 and P = .02, respectively, and when stratified by graft type: P = .008 and P = .047, respectively; Figure 1B-C: evaluation of OS and NRM in separate graft sources in patients with high, moderate, and low CD4 recovery is shown in supplemental Figure 4). OS and NRM in patients with high and low periengraftment α-diversity are shown in supplemental Figure 5. Although periengraftment α-diversity did not show association with OS in a CD34-selected setting in previous studies, when we included a larger number of patients with longer follow-up, there was a trend toward better overall survival in patients with higher than median α-diversity (hazard ratio, 0.74; 95% confidence interval, 0.51-1.06; P = .096; supplemental Figure 5C).
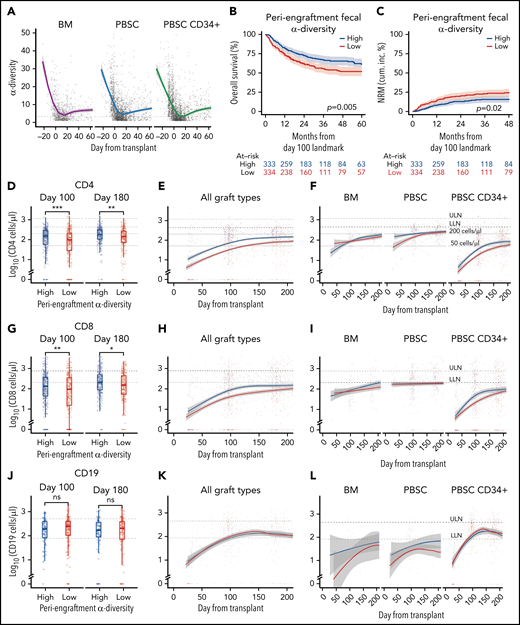

Intestinal microbial α-diversity is associated with immune reconstitution patterns after allo-HCT. (A) Stool α-diversity over time (n = 868; BM, 85; PBSCs, 347; CD34+ PBSCs, 436). The median periengraftment (days 7-21 after HCT) α-diversity is shown with the dotted horizontal line at 3.28. OS (B) and NRM (C) cumulative incidence in patients with high and low periengraftment α-diversity. (D) CD4 counts at days 100 and 180 post-HCT in patients with above- and below-median periengraftment α-diversity (n = 633 patients; BM, 71; PBSCs, 245; CD34+ PBSCs, 317). CD4 counts over time in all graft recipients (E) and separated by graft type (F) (n = 645 patients; BM, 73; PBSCs, 250; CD34+ PBSCs, 322). (G-I) CD8 T-cell counts. (D-F) The lower limit of normal (LLN) = 429 cells per microliter, and the upper limit of normal (ULN) = 1331 cells per microliter. (G) CD8 T-cell counts at days 100 and 180 post-HCT in patients with low and high periengraftment α-diversity (n = 633 patients; BM, 71; PBSCs, 245; CD34+ PBSCs, 317). CD8 counts over time in all graft recipients (H) and separated by graft type (I) (n = 645 patients; BM, 73; PBSCs, 250; CD34+ PBSCs, 322). (G-I) LLN = 209 cells per microliter and ULN = 768 cells per microliter. (J) CD19 counts at days 100 and 180 post-HCT in patients with low and high periengraftment α-diversity (n = 272; BM, 19; PBSCs, 67; CD34+ PBSCs, 186). CD19 counts over time in all graft recipients (H) and separated by graft type (I) (n = 314 patients; BM, 23; PBSCs, 85; CD34+ PBSCs, 206). (J-L) LLN = 78 cells per microliter and ULN = 510 cells per microliter. (M) NK counts at days 100 and 180 post-HCT in patients with low and high periengraftment α-diversity (n = 479; BM, 43; PBSCs, 165; CD34+ PBSCs,: 271). NK counts over time in all graft recipients (N) and separated by graft type (O) (n = 492; BM, 45; PBSCs, 171; CD34+ PBSCs, 276). (M-O) LLN = 78 and ULN = 510 cells per microliter. (P-R) Correlations of CD4 count with CD8 T-cell count (P), CD19+ B-cell count (Q), and NK-cell count (R). R represents the Pearson correlation coefficient. Statistical comparison for (D,G,J,M) was performed with the Wilcoxon rank-sum test.
Intestinal microbial α-diversity is associated with immune reconstitution patterns after allo-HCT. (A) Stool α-diversity over time (n = 868; BM, 85; PBSCs, 347; CD34+ PBSCs, 436). The median periengraftment (days 7-21 after HCT) α-diversity is shown with the dotted horizontal line at 3.28. OS (B) and NRM (C) cumulative incidence in patients with high and low periengraftment α-diversity. (D) CD4 counts at days 100 and 180 post-HCT in patients with above- and below-median periengraftment α-diversity (n = 633 patients; BM, 71; PBSCs, 245; CD34+ PBSCs, 317). CD4 counts over time in all graft recipients (E) and separated by graft type (F) (n = 645 patients; BM, 73; PBSCs, 250; CD34+ PBSCs, 322). (G-I) CD8 T-cell counts. (D-F) The lower limit of normal (LLN) = 429 cells per microliter, and the upper limit of normal (ULN) = 1331 cells per microliter. (G) CD8 T-cell counts at days 100 and 180 post-HCT in patients with low and high periengraftment α-diversity (n = 633 patients; BM, 71; PBSCs, 245; CD34+ PBSCs, 317). CD8 counts over time in all graft recipients (H) and separated by graft type (I) (n = 645 patients; BM, 73; PBSCs, 250; CD34+ PBSCs, 322). (G-I) LLN = 209 cells per microliter and ULN = 768 cells per microliter. (J) CD19 counts at days 100 and 180 post-HCT in patients with low and high periengraftment α-diversity (n = 272; BM, 19; PBSCs, 67; CD34+ PBSCs, 186). CD19 counts over time in all graft recipients (H) and separated by graft type (I) (n = 314 patients; BM, 23; PBSCs, 85; CD34+ PBSCs, 206). (J-L) LLN = 78 cells per microliter and ULN = 510 cells per microliter. (M) NK counts at days 100 and 180 post-HCT in patients with low and high periengraftment α-diversity (n = 479; BM, 43; PBSCs, 165; CD34+ PBSCs,: 271). NK counts over time in all graft recipients (N) and separated by graft type (O) (n = 492; BM, 45; PBSCs, 171; CD34+ PBSCs, 276). (M-O) LLN = 78 and ULN = 510 cells per microliter. (P-R) Correlations of CD4 count with CD8 T-cell count (P), CD19+ B-cell count (Q), and NK-cell count (R). R represents the Pearson correlation coefficient. Statistical comparison for (D,G,J,M) was performed with the Wilcoxon rank-sum test.
Periengraftment α-diversity is associated with CD4 and CD8 T-cell recovery after HCT
We hypothesized that a diverse microbiome during the early post-HCT period supports the expansion and maintenance of lymphoid cells within the graft, or lymphoid progenitor cell function, thus influencing the number of circulating lymphocytes at later time points. We first sought to associate early stool diversity with lymphocyte count within the first 200 days after HCT. We compared the recovery of CD4 and CD8 T cells, B cells, and NK cells in patients with above- and below-median α-diversity during the periengraftment period by using flow cytometry data from 4998 peripheral blood samples (Figure 1D-O). We observed that high periengraftment α-diversity was associated with higher CD4 and CD8 counts when recipients of all graft types were considered, at days 100 and 180 (Figure 1D; P < .001 and P = .005 respectively for CD4 counts; Figure 1G; P = .01 and P = .01. respectively, for CD8 counts, by Wilcoxon rank-sum test).
For the evaluation of B-cell recovery, we excluded patients who were treated with anti-CD20 agents for 12 months before and up to 100 days after transplant, because of the known influence of these agents on B-cell recovery.57 No association was found between B-cell recovery and periengraftment α-diversity (Figure 1J-L). Consistent with prior reports that NK cells recover quickly,58 we observed near-normal NK counts in even the earliest available samples, but we did not observe any relationship between NK counts and periengraftment α-diversity (Figure 1M-O). We further performed multivariate analyses considering clinical parameters known to correlate with immune reconstitution: age, graft source, ATG exposure, HD steroids or anti-CD20 exposure, GVHD prophylaxis regimen, total body irradiation, cytomegalovirus risk, and incidence of GVHD. Using a GEE model that accounted for these variables, for repeated samples per patient, and for time relative to HCT, we still observed that periengraftment stool α-diversity (early post-HCT) was independently associated with CD4 T-cell count recovery in recipients of CD34-selected PBSC grafts (Table 2). These data support the hypothesis that one of the mechanisms by which early post-HCT microbial diversity could contribute to improved OS may be through effects on immune reconstitution.
Multivariate analysis
| Estimate (95% CI) | P | |
|---|---|---|
| CD34-selected | ||
| CD4 | 0.079 (0.016 to 0.143) | .015 |
| CD8 | 0.104 (0.049 to 0.159) | <.001 |
| BM and PBSC | ||
| CD4 | 0.016 (−0.004 to 0.036) | .111 |
| CD8 | 0.005 (−0.031 to 0.041) | .781 |
| Estimate (95% CI) | P | |
|---|---|---|
| CD34-selected | ||
| CD4 | 0.079 (0.016 to 0.143) | .015 |
| CD8 | 0.104 (0.049 to 0.159) | <.001 |
| BM and PBSC | ||
| CD4 | 0.016 (−0.004 to 0.036) | .111 |
| CD8 | 0.005 (−0.031 to 0.041) | .781 |
GEE analysis of the association of periengraftment α-diversity with the separate outcomes of CD4 and CD8 counts over the first 200 days after allo-HCT. The multivariate model was adjusted for age, total body irradiation, graft (for the unmodified grafts), ATG exposure (posttransplant), exposure to high-dose steroids, anti-CD20 antibodies, GVHD prophylaxis (calcineurin inhibitor and mycophenolate mofetil, calcineurin inhibitor, methotrexate, post-HCT cyclophosphamide–based, others, or none), cytomegalovirus risk, and incidence of GVHD. Time was included in each model as a polynomial spline.
We observed a significant correlation between CD4 and CD8 T-cell recovery (P < .001; R = 0.74; Figure 1P), but only a weak negative association between CD4 T cells and B cells, and no relationship between CD4 T-cell recovery and NK-cell recovery (Figure 1Q-R). Given the degree of correlation between CD4 and CD8 number, CD4 recovery is a reasonable surrogate for overall conventional T-cell recovery. With regard to CD4 recovery and outcome, our findings in this cohort are consistent with previously published data.22 In a landmark analysis evaluating the relationship between CD4 count at day 100 and transplant outcomes, recipients of PBSC or CD34-selected grafts with CD4 recovery in the lowest quartile at day 100 had markedly worse outcomes (P < .001 for OS and NRM for PBSC CD34+ recipients; P = .03 for OS and P = .002 for NRM for PBSC recipients supplemental Figure 4). In the BM graft recipients, no statistically significant difference was observed in patients with high, moderate, or low CD4 counts, as separated by the 25th and 75th percentiles (P = .4 and P = .3 for OS and NRM).
Neither the summary measure β-diversity nor the presence of monodomination is associated with CD4 recovery
We next examined whether bacterial composition was associated with lymphocyte recovery (Figure 2A-C). We compared the periengraftment stool composition in the patients with above-median and below-median day-100 CD4 count (1 sample per patient; if multiple samples were available, the one closest to the day of neutrophil engraftment was selected), in recipients of each graft type. In both patient groups, there were several highly diverse samples (n = 131 of 288, 45% of patients with below-median CD4 recovery, and n = 155 of 292, 53% in the above-median CD4 recovery group had high periengraftment α-diversity) in addition to samples dominated by taxa such as Enterococcus (shown in green in Figure 2A), consistent with our previous reports.41,59 The proportion of monodominated samples (defined as a ≥30% relative abundance of a specific genus)54 did not differ significantly between those with above- and below-median CD4 recovery (P = .97 for BM, P = 1.00 for PBSCs, and P = .48 for CD34+ PBSCs). Furthermore, the patients who could not be included in this analysis for lack of flow cytometry data at day 100 had microbial community composition similar to that of those who were included and were reflective of the whole cohort (no flow available; PERMANOVA testing; P = .95). We used tSNE, a visualization method for decreasing the dimensionality of high-dimensional data, to visually inspect for any clustering of samples. Consistent with our previous work,41 we found that samples with lower diversity clustered together and were distinct from samples with higher diversity (Figure 2D). However, no clustering was observed in the evaluation of graft-type and above- or below-median CD4 recovery (Figure 2E-F). We further performed β-diversity assessment using PERMANOVA testing and found that there was no statistical difference in community composition between patients with above and below-median CD4 recovery (P = .95; P = .057; and P = .91; for recipients of BM, unmodified PBSCs, and CD34+ PBSCs, respectively). Taken together, these summary measures did not identify broad differences in global composition of the intestinal flora between the patients in our cohort who did and did not reach median CD4 recovery at day 100.
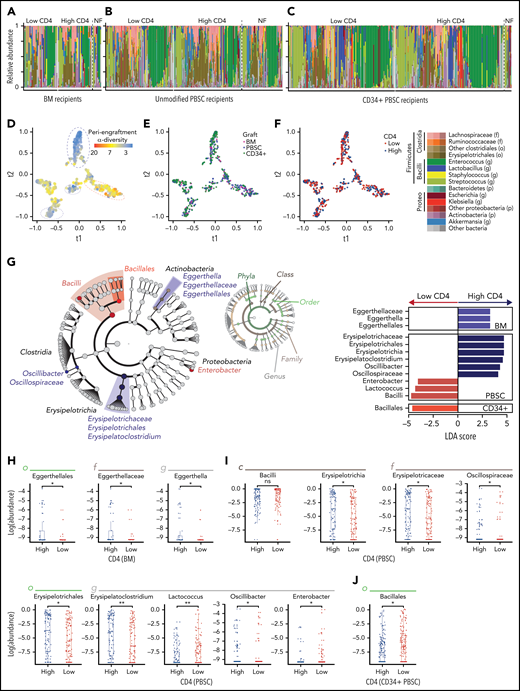
Several microbial taxa are associated with immune reconstitution after allo-HCT in a univariate analysis. (A-C) Composition plots of recipients of BM (A), unmodified PBSC (B), and CD34+ PBSC (C), grafts (a single sample is included per patient). (D-F) tSNE visualization of periengraftment sample color coded by α-diversity of the sample color coded by graft type (E), and color coded by day 100 CD4 count above- or below-median (F). Median per graft type: 115 cells per microliter for BM (33 patients with high and 33 with low CD4 recovery), 220 cells per microliter for PBSCs (102 patients with high and 102 with low CD4 recovery), and 60 cells per microliter for CD34+ PBSCs (157 patients with high and 153 with low CD4 recovery). (G) LEfSe analysis of compositional differences in patients receiving each graft type. CD4 recovery is defined as in panel F. (H-J) Relative abundance of taxa identified by using LEfSe analysis as seen in panel G. NF, no flow data available; LDA, linear discriminant analysis.
Several microbial taxa are associated with immune reconstitution after allo-HCT in a univariate analysis. (A-C) Composition plots of recipients of BM (A), unmodified PBSC (B), and CD34+ PBSC (C), grafts (a single sample is included per patient). (D-F) tSNE visualization of periengraftment sample color coded by α-diversity of the sample color coded by graft type (E), and color coded by day 100 CD4 count above- or below-median (F). Median per graft type: 115 cells per microliter for BM (33 patients with high and 33 with low CD4 recovery), 220 cells per microliter for PBSCs (102 patients with high and 102 with low CD4 recovery), and 60 cells per microliter for CD34+ PBSCs (157 patients with high and 153 with low CD4 recovery). (G) LEfSe analysis of compositional differences in patients receiving each graft type. CD4 recovery is defined as in panel F. (H-J) Relative abundance of taxa identified by using LEfSe analysis as seen in panel G. NF, no flow data available; LDA, linear discriminant analysis.
Erysipelotrichaceae are associated with above-median CD4 recovery; Bacilli and Proteobacteria are associated with below-median CD4 recovery
To understand potential taxonomic differences that may be present between patients and CD4 recovery, we next performed an unbiased analysis of specific microbial taxa using LEfSe. Once again, we compared patients with above- and below-median CD4 recovery at day 100 in 3 groups (recipients of unmodified BM, unmodified PBSC, and CD34-selected grafts), and the significance of comparisons for the taxa identified by LEfSe was assessed with a Wilcoxon rank-sum univariate test. The abundance of members of the class Bacilli was associated with below-median CD4 recovery in both PBSC and CD34-selected graft types, and the Enterobacter genus (from the Enterobacteriaceae family) was associated with below median CD4 recovery in PBSC recipients (Figure 2G-J). The Bacilli class and Enterobacteriaceae family contain many clinically relevant pathogens: the gram-positive Enterococcus and Staphylococcus (class Bacilli) and gram-negative Escherichia, Klebsiella, and Salmonella (family Enterobacteriaceae). Enterobacteriaceae and Bacilli have been observed in high frequency in post-HCT stool samples and are associated with an increased risk of infections and higher mortality.54,60-62 Bacteria in the Erysipelotrichaceae class were associated with above-median CD4 cell recovery in patients receiving PBSC grafts. Erysipelotrichaceae are butyrate producers in the Firmicutes phylum that convert primary to secondary bile acids.63,64 Butyrate and secondary bile acids are microbe-derived molecules that interact and regulate CD4 T cells and have been specifically shown to induce FoxP3+ expression.65-68 Lastly, Erysipelotrichaceae in a clinical allo-HCT study have been correlated with a decrease in the incidence of GVHD after HCT.69
Staphylococcus is associated with poor CD4 recovery in several different multivariate models
Having identified several taxa associated with CD4 recovery according to the LEfSe analysis, the taxonomic profiles and clinical metadata incorporated in the previously described GEE model were explored using MaAsLin2. This tool differs from LEfSe in that it was designed for multivariate analyses to incorporate repeated measures, clinical covariates, and the microbiota sequencing data to identify differentially abundant taxa. MaAsLin2 demonstrated that Staphylococcus is associated with lower CD4 recovery (false-discovery rate = 0.02). Given the high-dimensional nature of this data set and the limitations of the multivariate analysis,48 we used several other tools to validate the results of the MaAsLin2: specifically, Corncob,49 Ancom2,50 and metagenomeSeq51-53 (Bioconductor package).53 Interestingly Corncob and metagenomeSeq also demonstrated that Staphylococcus is associated with poor CD4 recovery 3 months after allo-HCT (Figure 3). To further confirm our findings, we examined different thresholds for minimum relative abundance and depth threshold for sample inclusion and found that Staphylococcus is consistently associated with CD4 recovery (supplemental Figure 6A). Supplemental Figure 6C shows the CD4 counts at day 100 in patients with high or low Staphylococcus abundance (using the 75th percentile) in a univariate analysis, and supplemental Table 6 demonstrates the differences in patient characteristics between those with high and low Staphylococcus abundance.
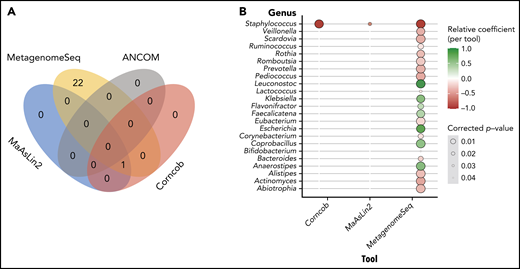
Multivariate analysis reveals that high staphylococcal relative abundance is associated with low CD4 counts at day 100. (A) Venn diagram demonstrating the overlap in results of the tools tested: MaAslin2, Corncob, metagenomeSeq, and ANCOM2. (B) Genera that were shown to be significantly associated with CD4 recovery according to analysis method.
Multivariate analysis reveals that high staphylococcal relative abundance is associated with low CD4 counts at day 100. (A) Venn diagram demonstrating the overlap in results of the tools tested: MaAslin2, Corncob, metagenomeSeq, and ANCOM2. (B) Genera that were shown to be significantly associated with CD4 recovery according to analysis method.
Discussion
Many bacteria and microbiota-derived molecules have been linked to immune function in clinical studies.65-68,70,71 Through analysis of a large number of recipients of allo-HCT, we have identified early microbiome features that correlate significantly with CD4 recovery. In recipients of CD34-selected PBSC allografts, high periengraftment α-diversity was independently associated with improved CD4 lymphocyte recovery. Low gut microbial α-diversity is associated with higher mortality in the HCT setting and has been reported in several other disease states.41,62,72,73 The finding that periengraftment α-diversity is associated with day 100 CD4 T cells in patients receiving a CD34-selected graft was interesting, since we previously demonstrated an association between periengraftment α-diversity and outcomes in recipients of an unmodified graft but not in recipients of a CD34-selected graft.41
While the underlying mechanism by which low diversity is associated with poor outcome requires further exploration, there are several lines of evidence suggesting that the loss of protective immunomodulatory metabolites may be an important factor. In a recent study of 399 healthy volunteers, Wilmanski et al reported a plasma metabolomic signature that correlates with microbial α-diversity.74 This signature consists of 11 plasma metabolites, some of microbial origin, such as the secondary bile acids glycocholate sulfate and iso-ursodeoxycholate. This finding is particularly interesting, because microbe-dependent secondary bile acids have now been demonstrated to modulate host immune function, which supports a hypothesis that low microbial diversity depletes the host of metabolites that support optimal immune function.65-68,74,75 Mouse studies have now demonstrated that secondary bile acids and short-chain fatty acids (eg, butyrate) can induce differentiation of T-regulatory cells,65-68,74 polyamines are required for the maturation of gut lamina propria CD4 and CD8 T cells, and AhR ligands provided by the microbiome are necessary for the postnatal development of intestinal lymphoid follicles and innate lymphoid cells.75-77
Beyond the CD34-selected setting where we are predominantly studying the association between the microbiome and lymphoid progenitor potential, LEfSe analysis in PBSC recipients, demonstrated that Erysipelotrichaceae were associated with higher day 100 CD4 counts. This class of bacteria in the phylum Firmicutes contains many taxa capable of butyrate production and conversion of primary to secondary bile acids.63,64 We therefore speculate that there is a role for microbe-derived molecules in both de novo lymphocyte production and the maintenance of graft-derived populations.
Bacilli (class) and Bacillales (order) were associated with worse CD4 recovery in both unmodified PBSC and CD34+-selected PBSC grafts from LEfSe analyses, which are inherently univariate. When modeling the taxonomic profiles in all patients and all graft types with MaAsLin2, a multivariate approach, we found that the abundance of Staphylococcus (within the Bacilli class and Bacillales order) was significantly associated with a lower number of CD4 T cells at day 100. To ensure that this result was robust, we used several additional tools to validate the results of the MaAsLin2, specifically, Corncob,49 Ancom2,50 and metagenomeSeq51-53 (Bioconductor package).53 Three of these methods (MaAsLin2, Corncob, and metagenomeSeq) consistently revealed a relationship between high Staphylococcus abundance and poor CD4 recovery after allo-HCT. Notably, Staphylococcus species have been demonstrated to interact with T cells via several mechanisms.78-80 A recent study from our center reported an association between Staphylococcus abundance and higher lymphocyte counts (total NK, T, and B cells) in the early weeks after HCT.40 These conclusions were reached from frequently collected stool samples and daily lymphocyte counts reported as part of the complete blood count data. In contrast, in this study we have sought to define features of early posttransplant microbial communities that are linked with day-100 recovery of specific lymphocyte subpopulations, particularly peripheral T cells, as quantified by flow cytometry.
A limitation of this study is the heterogeneity of the GVHD prophylaxis regimens, particularly in the BM group (supplemental Table 1). This limitation is particularly important because exposure to several GVHD prophylaxis regimens has been implicated in immune recovery after allo-HCT.25,81-83 Posttransplant cyclophosphamide (PT-Cy)–based regimens are of particular interest, because several groups have now reported an association between PT-Cy and slower immune reconstitution.25,81 However, there were too few patients in this study to explore the relationship of the microbiome with CD4 T-cell recovery in recipients of PT-Cy GVHD prophylaxis. Lastly, variables including graft type, conditioning intensity, and GVHD prophylaxis regimen, are not independent, and for this reason, we used a multivariate model to assess these complex relationships.
Our work demonstrates the potential interaction between the periengraftment microbiome and subsequent T-cell recovery. Mechanistic studies are needed to define the relationship between microbiota communities and CD4 recovery. However, these data highlight that strategies to prevent microbial diversity loss and pathogenic domination in the early posttransplant period should be explored and may improve morbidity and mortality after allo-HCT by improving immune reconstitution.84
Acknowledgments
The authors thank the members of the clinical flow cytometry laboratory, as well as the countless support staff involved in the long-term biobanking effort at MSKCC, without whom, these analyses would not have been possible. M.-A.P. thanks Theodore and Laura Hromadka for their support.
This work was supported in part by the National Institutes of Health (NIH), National Cancer Institute (NCI) Cancer Center Support Grant P30-CA008748 and NIH, NCI grant P01-CA023766; by an American Society of Clinical Oncology (ASCO) young investigator award, a Hyundai Hope on Wheels young investigator award, a Cycle for Survival Equinox Innovation award, and a Collaborative Pediatric Cancer Research Program Award (O.M.); the Deutsche Forschungsgemeinschaft (DFG) and American Society for Transplantation and Cellular Therapy (ASTCT) (H.A.), funding from NIH, National Heart, Lung, and Blood Institute (NHLBI) grant K08HL143189 and the Parker Institute for Cancer Immunotherapy at Memorial Sloan Kettering Cancer Center (J.U.P.); NCI awards, R01-CA228358 and R01- CA228308, NHLBI award R01-HL125571, R01-HL123340, National Institute of Aging (NIA) award Project 2 P01-AG052359, National institute of Allergy and Infectious Diseases (NIAID) award U01 AI124275, Tri-Institutional Stem Cell Initiative award 2016-013, The Lymphoma Foundation, The Susan and Peter Solomon Divisional Genomics Program, and the Parker Institute for Cancer Immunotherapy at Memorial Sloan Kettering Cancer Center (M.R.M.v.d.B.); and the DKMS (Deutsche KnochenMarkSpenderdatei or German Bone Marrow Donor File) and the Parker Institute for Cancer Immunotherapy (K.A.M.).
Authorship
Contribution: O.M. contributed to the study design, analyzed the data, and wrote the paper; H.A. contributed to the study design and the manuscript; N.R.W., A.D., C.L.N., and M.B.d.S. contributed to the concept and data analysis; J.S., P.G., A.C., and G.K.A. contributed to the collection of clinical data, sample organization, and sample processing; A.L.C.G. contributed to data analysis; S.L., M.L., P.M., M.S., R.O., Y.T., A.S., R.S., S.P., J.J.B., S.G., and M.-A.P., contributed to analysis strategies; S.M.D. performed all the survival and longitudinal analyses; J.U.P. contributed to study design, data analysis, and wrote the manuscript; M.R.M.v.d.B. contributed to study design and the manuscript; and K.A.M. conceived of the study, contributed to data analysis, and wrote the manuscript.
Conflict-of-interest disclosure: P.M. receives research funding from BD Biosciences. R.S. is a consultant for Medexus and MyBiotics. S.P. receives support for the conduct of clinical trials from Atara Biotherapeutics, Jasper Therapeutics, and AlloVir; serves on advisory boards for Neovii and ADMA, and is an inventor on intellectual property licensed to Atara by MSKCC, with all rights assigned to MSKCC. J.J.B. is a consultant for Race Oncology, Avrobio, Advanced Clinical, and Omeros. M.-A.P. reports honoraria from AbbVie, Astellas, Bristol-Myers Squibb, Celgene, Equilium, Incyte, Karyopharm, Kite/Gilead, Merck, Miltenyi Biotec, MorphoSys, Novartis, Nektar Therapeutics, Omeros, Takeda, VectivBio AG, and Vor Biopharma and serves on data safety management boards for Cidara Therapeutics, Medigene, Sellas Life Sciences, and Servier, and the scientific advisory board of NexImmune; has ownership interests in NexImmune and Omeros; has received research support for clinical trials from Incyte, Kite/Gilead, Miltenyi Biotec, and Novartis; serves in a volunteer capacity as a member of the Board of Directors of the American Society for Transplantation and Cellular Therapy (ASTCT) and Be The Match (National Marrow Donor Program, NMDP), and on the Center for International Blood and Marrow Transplant Research (CIBMTR) Cellular Immunotherapy Data Resource (CIDR) Executive Committee. M.S. served as a paid consultant for McKinsey and Company, Angiocrine Bioscience, Inc, and Omeros Corporation; received research funding from Angiocrine Bioscience, Inc and Omeros Corporation; served on ad hoc advisory boards for Kite/Gilead; and received a 1-time speaker’s fee from i3Health for a continuing medical education speaking engagement. J.U.P. reports research funding, intellectual property fees, and travel reimbursement from Seres Therapeutics and consulting fees from Da Volterra, CSL Behring, and MaaT Pharma; serving on an advisory board of and holding equity in Postbiotics Plus Research; and filing intellectual property applications related to the microbiome (reference numbers 62/843 849, 62/977 908, and 15/756 845). M.R.M.v.d.B. has received research support and stock options from Seres Therapeutics and stock options from Notch Therapeutics and Pluto Therapeutics and royalties from Wolters Kluwer; has consulted, received honoraria from, or participated on advisory boards for Seres Therapeutics, WindMIL Therapeutics, Rheos Medicines, Merck and Co, Inc, Magenta Therapeutics, Frazier Healthcare Partners, Nektar Therapeutics, Notch Therapeutics, Forty Seven Inc, Ceramedix, Lygenesis, Pluto Therapeutics, GlaskoSmithKline, Da Volterra, Vor Biopharma, Novartis (spouse), Synthekine (spouse), and Beigene (spouse); has intellectual property licensing with Seres Therapeutics and Juno Therapeutics; and holds a fiduciary role on the Foundation Board of DKMS (a nonprofit organization). K.A.M. serves on the advisory board of and holds equity in Postbiotics Plus Research. Memorial Sloan Kettering Cancer Center (MSKCC) has financial interests relative to SeresTherapeutics. The remaining authors declare no competing financial interests.
Correspondence: Kate A. Markey, Fred Hutchinson Cancer Research Center, Seattle, WA 98109; e-mail: kmarkey@fredhutch.org.
Sequencing data are deposited in the Sequence Read Archive (Bioproject number PRJNA792881).
Requests for data sharing may be submitted to Kate A. Markey (kmarkey@fredhutch.org).
The online version of this article contains a data supplement.
There is a Blood Commentary on this article in this issue.
The publication costs of this article were defrayed in part by page charge payment. Therefore, and solely to indicate this fact, this article is hereby marked “advertisement” in accordance with 18 USC section 1734.

This feature is available to Subscribers Only
Sign In or Create an Account Close Modal