

Key Points
ZFP91 is a bona fide transcription factor that coregulates cell survival with IKZF1 in IMiD-resistant TCLs.
CC-92480, by targeting IKZF1 and ZFP91, overcomes IMiD-resistance in TCLs and shows a good therapeutic window for clinical use.

Abstract
Immunomodulatory (IMiD) agents like lenalidomide and pomalidomide induce the recruitment of IKZF1 and other targets to the CRL4CRBN E3 ubiquitin ligase, resulting in their ubiquitination and degradation. These agents are highly active in B-cell lymphomas and a subset of myeloid diseases but have compromised effects in T-cell lymphomas (TCLs). Here, we show that 2 factors determine resistance to IMiDs among TCLs. First, limited CRBN expression reduces IMiD activity in TCLs but can be overcome by newer-generation degrader CC-92480. Using mass spectrometry, we show that CC-92480 selectively degrades IKZF1 and ZFP91 in TCL cells with greater potency than pomalidomide. As a result, CC-92480 is highly active against multiple TCL subtypes and showed greater efficacy than pomalidomide across 4 in vivo TCL models. Second, we demonstrate that ZFP91 functions as a bona fide transcription factor that coregulates cell survival with IKZF1 in IMiD-resistant TCLs. By activating keynote genes from WNT, NF-kB, and MAP kinase signaling, ZFP91 directly promotes resistance to IKZF1 loss. Moreover, lenalidomide-sensitive TCLs can acquire stable resistance via ZFP91 rewiring, which involves casein kinase 2–mediated c-Jun inactivation. Overall, these findings identify a critical transcription factor network within TCLs and provide clinical proof of concept for the novel therapy using next-generation degraders.
Introduction
T-cell lymphomas (TCLs) comprise ∼10% of all non-Hodgkin lymphomas (NHLs) in Western countries.1 The World Health Organization currently divides TCLs into 29 different subtypes based on histologic and immunophenotypic features that include both peripheral (PTCL) and cutaneous (CTCL) entities.2 Essentially, every T-cell subset (eg, follicular helper T, regulatory T [Treg], TH1, TH2) has a malignant counterpart with overlapping transcriptional and immunophenotypic features.
Treatment of TCLs to date has been largely derivative or empiric. Cyclophosphamide, doxorubicin, vincristine, and prednisolone–based regimens remain the standard for first-line therapy in most patients.3 Except for anaplastic large cell lymphomas (ALCL), which benefit from the addition of brentuximab vedotin,4 over 75% of PTCLs fail to respond or relapse after first-line therapy. PTCL not otherwise specified, angioimmunoblastic T-cell lymphoma (AITL), ALCL that lack ALK rearrangements (ALK− ALCL), and natural killer/TCL, the most common subtypes of PTCL, as well as late-stage CTCL are each associated with <30% 5-year overall survival.5 Long-term survivors of rare subtypes of TCL like hepatosplenic TCL and monomorphic epitheliotropic intestinal TCL are extremely uncommon. Currently, available second line agents like histone deacetylase inhibitors and pralatrexate induce responses in <30% of patients and have progression-free survival <4 months.6 The imperative is clearly to define new and important vulnerabilities that can be targeted in subsets of TCL.
The immunomodulatory agents (IMiD) thalidomide, lenalidomide, and pomalidomide were the first drugs found to promote the ubiquitination and degradation of specific substrates by an E3 ubiquitin ligase complex.7,8 These compounds function by increasing the affinity of the CRL4CRBN E3 ubiquitin ligase for a small set of protein substrates. In myelodysplastic syndrome with loss of chromosome 5q, the critical target for lenalidomide activity is casein kinase 1α (CK1α).9,10 In multiple myeloma and B-cell lymphomas, the key drug targets are the master lymphocyte transcription factors IKZF1 (Ikaros) and IKZF3 (Aiolos).7,8,11
Through both cell-intrinsic programs and feed-forward cytokine loops, the IKZF family transcription factors play important roles in the differentiation and function of many T-cell subsets, including TH1, TH2, TH17, follicular helper T, and Treg cells.12 Yet, IMiDs have very limited activity in TCL. In a trial of single-agent lenalidomide in 54 patients with relapsed or refractory PTCL, the overall response rate was 22% and median progression-free survival was only 2.5 months.13 Lenalidomide also failed to improve efficacy when added to cyclophosphamide, doxorubicin, vincristine, and prednisolone chemotherapy in the first line.14 Using a genome-wide clustered regularly interspaced short palindromic repeats (CRISPR) screen, we previously showed that IKZF1 is a vulnerability within a subset of TCL cell lines that are resistant to IMiDs.15 That resistance could result from inadequate degradation of IKZF1 by available IMiDs (ie, pharmacologic failure). However, TCLs are typically resistant to both lenalidomide and pomalidomide at doses >30 µM, suggesting a fundamental difference in the role of IKZF1 and potentially other known substrates within malignant TCL cells.
Among the other known substrates of lenalidomide and pomalidomide is zinc finger protein 91 (ZFP91), which is targeted for degradation through its 4th C2H2 zinc finger (ZnF4) domain.16 ZFP91 is broadly expressed across tissues, with highest expression in lymph nodes and testis.17 ZFP91 shows structural characteristics highly suggestive of transcription factor (TF) activity: 5 zinc-finger domains, a leucine zipper, and several nuclear localization signals.18 Multiple studies have demonstrated that ZFP91 is dispensable for survival in myeloid and B-cell malignancies.19,20 Similarly, our previous CRISPR screen failed to identify ZFP91 as a selective vulnerability in TCL lines. Here, we further explore the roles of IKZF1 and ZFP91 in TCL survival, proliferation, and resistance to IMiDs.
Methods
Further details are available in supplemental Methods.
Cell lines
Cell lines were cultured in RPMI-1640 media supplemented with 10% to 20% fetal bovine serum and 1% penicillin/streptomycin. Cell lines were routinely tested for mycoplasma (ATCC Universal Mycoplasma Detection Kit), and authenticity was validated by short tandem repeat profiling.
Proliferation assay
Proliferation assays were performed twice in triplicate. Cells were seeded at 1:5 ratio, and tissue culture medium containing drugs or dimethyl sulfoxide (DMSO) were replaced every 48 hours. Cells were stained with 1 µg/mL propidium iodide (PI) solution (Sigma-Aldrich # P4864). Cell numbers and PI+ population were detected by flow cytometry every 48 hours.
Mouse experiments
Animal work was performed in NOD.Cg-PrkdcscidIl2rgtm1Wjl/SzJ mice (JAX; stock #005557) with approval of the Dana-Farber Cancer Institute Institutional Animal Care and Use Committee.
Statistical analyses
Data are presented as mean plus or minus standard deviation (SD) unless otherwise indicated in the figure legends. Data were tested using a 2-tailed Student t test (when comparing 2 groups) or 2-way analysis of variance (ANOVA) followed by Bonferroni’s post hoc comparison (to test multiple groups), as indicated in the figure legends. Kaplan-Meier survival curves were analyzed using a log-rank test. Overall survival for patient-derived xenograft (PDX) experiments was calculated from the time of treatment initiation to the time of death and compared using a log-rank test. Violin plots show full range of data points with thick line at median and thin lines at 25th and 75th percentiles. Unless indicated otherwise, P values were derived from paired, 2-tailed Student t tests. For all tests, significance was determined with a 95% confidence interval (*P < .05; **P < .01; ***P < .001) on GraphPad Prism, version 8.
Results
IKZF1 as a key substrate in lenalidomide-sensitive TCLs
First, we tested the activity of IMiDs across 20 available TCL cell lines.15 Consistent with the low response rate in patients with TCL,13,21 lenalidomide was active in only the ALK-rearranged (ALK+) ALCL cell lines SU-DHL-1 and KI-JK. The more potent agent pomalidomide was active only in SU-DHL-1, KI-JK, and the ALK− ALCL cell line DL40 (Figure 1A; supplemental Figure 1A).
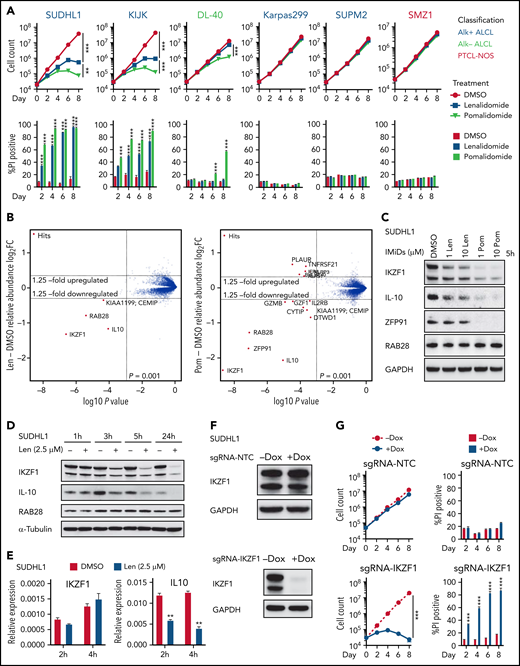
IKZF1 drives the activity of lenalidomide in sensitive TCL cells. (A) Cell count and percent PI+ in TCL lines treated with 1 μM lenalidomide (len), pomalidomide (pom), or DMSO. The experiment was performed in triplicate and replicated twice. Data are presented as mean plus or minus SD. Comparisons are by 2-way ANOVA and Bonferroni correction for multiple comparisons. (B) SU-DHL-1 cells were treated with 2.5 μM len (left), 1 μM pom (right), or DMSO for 5 hours, and protein abundance was quantified using TMT mass spectrometry–based proteomics. Significant changes were assessed by a moderated t test as implemented in the limma package, with the log2 fold change (log2FC) shown on the y-axis, and −log10(P values) on the x-axis (3 independent biological replicates for each IMiD drug and DMSO control). (C) Western blot analysis for IKZF1, IL-10, and ZFP91 proteins in SU-DHL-1 cells treated with IMiDs for 5 hours. (D) Western blot analysis in SU-DHL-1 cells treated with 2.5 μM len for indicated durations. (E) qPCR analysis in SU-DHL-1 cells treated with 2.5 μM len for indicated durations. Gene expression is normalized to RPS18. Data are presented as mean of 3 replicates plus or minus SEM. (F) Western blot analysis of doxycycline (dox)-induced sgRNA23 targeting IKZF1 or nontargeting control (NTC). (G) Cell count and percent PI+ in SU-DHL-1 cells with dox-induced expression of sgRNA targeting IKZF1 or NTC. The experiment was performed in triplicate and replicated twice. Data are presented as mean plus or minus SD. Comparisons are by 2-way ANOVA and Bonferroni correction for multiple comparisons. **P < .01; ***P < .001. IB, immunoblot; qPCR, quantitative polymerase chain reaction; SEM, standard error of the mean; sgRNA, single-guide RNA; TMT, tandem mass tag.
IKZF1 drives the activity of lenalidomide in sensitive TCL cells. (A) Cell count and percent PI+ in TCL lines treated with 1 μM lenalidomide (len), pomalidomide (pom), or DMSO. The experiment was performed in triplicate and replicated twice. Data are presented as mean plus or minus SD. Comparisons are by 2-way ANOVA and Bonferroni correction for multiple comparisons. (B) SU-DHL-1 cells were treated with 2.5 μM len (left), 1 μM pom (right), or DMSO for 5 hours, and protein abundance was quantified using TMT mass spectrometry–based proteomics. Significant changes were assessed by a moderated t test as implemented in the limma package, with the log2 fold change (log2FC) shown on the y-axis, and −log10(P values) on the x-axis (3 independent biological replicates for each IMiD drug and DMSO control). (C) Western blot analysis for IKZF1, IL-10, and ZFP91 proteins in SU-DHL-1 cells treated with IMiDs for 5 hours. (D) Western blot analysis in SU-DHL-1 cells treated with 2.5 μM len for indicated durations. (E) qPCR analysis in SU-DHL-1 cells treated with 2.5 μM len for indicated durations. Gene expression is normalized to RPS18. Data are presented as mean of 3 replicates plus or minus SEM. (F) Western blot analysis of doxycycline (dox)-induced sgRNA23 targeting IKZF1 or nontargeting control (NTC). (G) Cell count and percent PI+ in SU-DHL-1 cells with dox-induced expression of sgRNA targeting IKZF1 or NTC. The experiment was performed in triplicate and replicated twice. Data are presented as mean plus or minus SD. Comparisons are by 2-way ANOVA and Bonferroni correction for multiple comparisons. **P < .01; ***P < .001. IB, immunoblot; qPCR, quantitative polymerase chain reaction; SEM, standard error of the mean; sgRNA, single-guide RNA; TMT, tandem mass tag.
To identify the substrates of IMiDs in TCL cells, we treated SU-DHL-1 cells with 2.5 μM lenalidomide, 1 μM pomalidomide, or DMSO control for 5 hours, then assessed protein abundance by quantitative mass spectrometry (MS)-based proteomics. Lenalidomide induced twofold downregulation of only IKZF1, RAB28, and IL10. Pomalidomide-treated cells had greater than twofold reductions in these proteins as well as ZFP91 (Figure 1B). Degradation of IKZF1 and ZFP91 but not RAB28 was confirmed by immunoblotting (Figure 1C-D; supplemental Figure 1B). Even 10 μM lenalidomide only partially degraded IKZF1 and had limited effect on ZFP91. Lenalidomide decreased IKZF1 protein levels without altering IKZF1 messenger RNA expression (Figure 1E), consistent with a posttranslational mechanism of regulation. However, lenalidomide induced a decrease in IL10 transcript within 2 hours (Figure 1E), consistent with previous reports that IKZF1 directly regulates IL10 expression.22 Knockout of CRBN reversed IMiD-mediated toxicity, confirming CRBN dependence of IMiDs in TCL cells (supplemental Figure 1C-D).
To evaluate whether decreased IKZF1 expression drives the sensitivity of SU-DHL-1 and KI-JK cells to lenalidomide, we transduced with lentiviral vectors expressing CRISPR-associated protein 9 and a doxycycline-inducible sgRNA23 cassette. Doxycycline treatment resulted in near complete loss of IKZF1 protein and phenocopied the effects of IMiDs on survival in both lines (Figure 1F-G; supplemental Figure 1E-F).
Codependence of IKZF1 and ZFP91 in acquired lenalidomide-resistant TCLs
To better understand how TCL cells acquire resistance to IMiDs, we generated lenalidomide-resistant TCL cells by long-term culture with increasing concentrations of lenalidomide. These cells maintained stable resistance (len-regrown cells) after lenalidomide withdrawal for >2 months (Figure 2A-B; supplemental Figure 2A; supplemental Table 1). Exome sequencing demonstrated no mutations or copy number alterations in CRBN or additional factors previously described to modulate CRL4CRBN E3 ubiquitin ligase activity24,25 (supplemental Figure 2B; supplemental Table 1). Lenalidomide treatment decreased IKZF1 protein levels to a similar extent in len-regrown and parental cells (Figure 2C; supplemental Figure 2C). However, knockout of IKZF1 had markedly reduced effects on proliferation and survival in len-regrown cells compared with parental cells (Figure 2D-E), indicating that len-regrown cells are tolerant to IKZF1 loss.
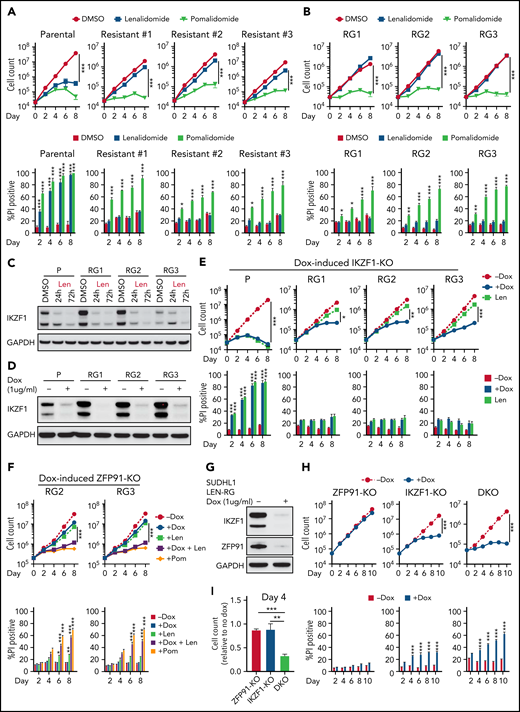
Acquired lenalidomide-resistant TCLs are tolerant to IKZF1 loss but remain sensitive to pomalidomide-induced inactivation of both IKZF1 and ZFP91. (A-B) Cell count and percent PI+ in SU-DHL-1 parental, len-resistant (A), and len-regrown (RG) cells (B) treated with 1 μM IMiDs or DMSO. The experiment was performed in triplicate and replicated twice. Data are presented as mean plus or minus SD. Comparisons are by 2-way ANOVA and Bonferroni correction for multiple comparisons. (C) Western blot for IKZF1 in SU-DHL-1 parental and len-regrown cells upon exposure to 1 μM len for 24 or 72 hours. (D) Western blot for IKZF1 in SU-DHL-1 parental and len-regrown cells with dox-induced IKZF1 knockout. (E) Cell count and percent PI+ in SU-DHL-1 parental and len-regrown cells with dox-induced IKZF1 knockout. The experiment was performed in triplicate and replicated twice. Data are presented as mean plus or minus SD. Comparisons are by 2-way ANOVA and Bonferroni correction for multiple comparisons. (F) Cell count and percent PI+ in SU-DHL-1 len-regrown cells with dox-induced ZFP91 inactivation in combination with 1 μM lenalidomide treatment and compared with 1 μM pomalidomide treatment. The experiment was performed in triplicate and replicated twice. Data are presented as mean plus or minus SD. Comparisons are by 2-way ANOVA and Bonferroni correction for multiple comparisons. (G) Western blot for IKZF1 and ZFP91 in SU-DHL-1 len-regrown cells with dox-induced knockout of both IKZF1 and ZFP91. (H-I) Cell count and percent PI+ in SU-DHL-1 len-regrown cells with dox-induced IKZF1 and ZFP91 single or double knockout (DKO). Shown in (I) is relative cell count at day 4 compared with no dox. The experiment was performed in triplicate and replicated twice. Data are presented as mean plus or minus SD. Comparisons are by 2-tailed Student t test. *P < .05; **P < .01; ***P < .001. Dox, doxycycline.
Acquired lenalidomide-resistant TCLs are tolerant to IKZF1 loss but remain sensitive to pomalidomide-induced inactivation of both IKZF1 and ZFP91. (A-B) Cell count and percent PI+ in SU-DHL-1 parental, len-resistant (A), and len-regrown (RG) cells (B) treated with 1 μM IMiDs or DMSO. The experiment was performed in triplicate and replicated twice. Data are presented as mean plus or minus SD. Comparisons are by 2-way ANOVA and Bonferroni correction for multiple comparisons. (C) Western blot for IKZF1 in SU-DHL-1 parental and len-regrown cells upon exposure to 1 μM len for 24 or 72 hours. (D) Western blot for IKZF1 in SU-DHL-1 parental and len-regrown cells with dox-induced IKZF1 knockout. (E) Cell count and percent PI+ in SU-DHL-1 parental and len-regrown cells with dox-induced IKZF1 knockout. The experiment was performed in triplicate and replicated twice. Data are presented as mean plus or minus SD. Comparisons are by 2-way ANOVA and Bonferroni correction for multiple comparisons. (F) Cell count and percent PI+ in SU-DHL-1 len-regrown cells with dox-induced ZFP91 inactivation in combination with 1 μM lenalidomide treatment and compared with 1 μM pomalidomide treatment. The experiment was performed in triplicate and replicated twice. Data are presented as mean plus or minus SD. Comparisons are by 2-way ANOVA and Bonferroni correction for multiple comparisons. (G) Western blot for IKZF1 and ZFP91 in SU-DHL-1 len-regrown cells with dox-induced knockout of both IKZF1 and ZFP91. (H-I) Cell count and percent PI+ in SU-DHL-1 len-regrown cells with dox-induced IKZF1 and ZFP91 single or double knockout (DKO). Shown in (I) is relative cell count at day 4 compared with no dox. The experiment was performed in triplicate and replicated twice. Data are presented as mean plus or minus SD. Comparisons are by 2-tailed Student t test. *P < .05; **P < .01; ***P < .001. Dox, doxycycline.
Interestingly, the len-regrown cells remained sensitive to pomalidomide treatment (Figure 2A-B; supplemental Figure 2A). Based on the MS data (Figure 1B), we hypothesized that ZFP91 degradation contributes to pomalidomide sensitivity. Similar to parental cells, pomalidomide but not lenalidomide induced ZFP91 loss in len-regrown cells (supplemental Figure 2C). ZFP91 knockout did not affect the growth or survival of len-regrown cells (supplemental Figure 2D-E) but significantly increased the effects of both lenalidomide and IKZF1 knockout in len-regrown cells (Figure 2F-I).
To directly address the role of ZFP91 in resistance, we mutated glycine 406 to alanine (G406A), which disrupts the pomalidomide-mediated interaction of the ZFP91-ZnF4 domain with CRBN.16 As expected, ZFP91 G406A was not degraded by pomalidomide (supplemental Figure 2F). Expression of ZFP91 G406A reduced the effect of pomalidomide in lenalidomide-resistant TCLs (supplemental Figure 2G-I). These results demonstrate that selective resistance to lenalidomide can involve codependence on IKZF1 and ZFP91.
Potent degradation of both IKZF1 and ZFP91 overcomes pomalidomide resistance across multiple TCL subtypes
As noted above, pomalidomide induces near complete degradation of target proteins in both sensitive and acquired len-resistant TCLs, which is associated with cell killing. However, pomalidomide led to significantly less degradation of the same targets in multiple pomalidomide-resistant TCLs (Figure 3A). Importantly, double knockout of IKZF1 and ZFP91 markedly reduced cell growth and survival in these pomalidomide-resistant TCLs compared with knockout of either target alone (Figure 3B-D; supplemental Figure 3A-C). This suggests that the failure of pomalidomide within these lymphomas may be pharmacologic rather than due to a lack of dependence on IKZF1 and ZFP91.
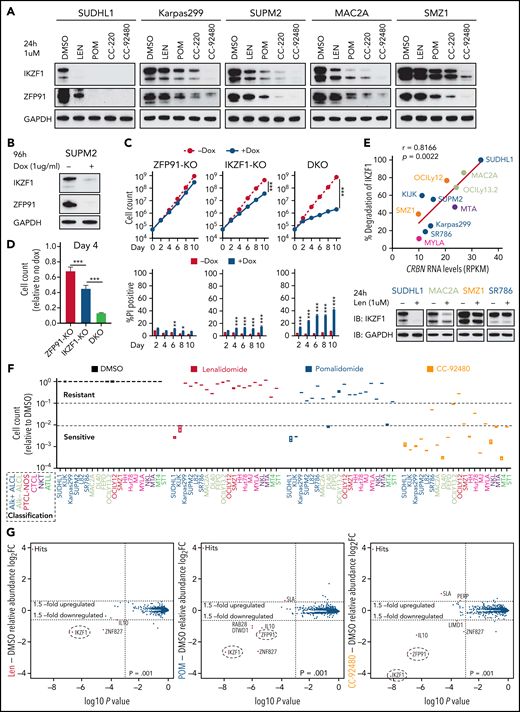
The novel CELMoD CC-92480 has potent and broad activity against TCLs associated with selective degradation of IKZF1 and ZFP91. (A) Western blot in TCL lines upon exposure to 1 μM len, pomalidomide (pom), CC-220, or CC-92480 for 24 hours. (B) Western blot in SUP-M2 cells with dox-induced knockout of IKZF1 and ZFP91. (C-D) Cell count and percent PI+ in SUP-M2 cells with dox-induced knockout of IKZF1, ZFP91, or double knockout (DKO). Shown in (D) is cell number at day 4 relative to no dox. The experiment was performed in triplicate and replicated twice. Data are presented as mean plus or minus SD. Comparisons are by 2-tailed Student t test. (E) Correlation analysis of CRBN transcript expression levels with the extent of IKZF1 degradation by treatment of lenalidomide for 24 hours in TCL lines. Bottom, representative immunoblots show IKZF1 degradation in TCL lines treated with lenalidomide for 24 hours. (F) Relative fold changes in cell count across 20 TCL cell lines treated with indicated agents (1 μM) for 12 days compared to DMSO controls. (G) SUP-M2 cells were treated with 1 μM lenalidomide (left), pom (middle), CC-92480 (right), or DMSO for 5 hours, and protein abundance was quantified using TMT mass spectrometry–based proteomics. Significant changes were assessed by a moderated t test as implemented in the limma package, with the log2 fold change (log2FC) shown on the y-axis and −log10(P values) on the x-axis. *P < .05; **P < .01; ***P < .001. TMT, tandem mass tag.
The novel CELMoD CC-92480 has potent and broad activity against TCLs associated with selective degradation of IKZF1 and ZFP91. (A) Western blot in TCL lines upon exposure to 1 μM len, pomalidomide (pom), CC-220, or CC-92480 for 24 hours. (B) Western blot in SUP-M2 cells with dox-induced knockout of IKZF1 and ZFP91. (C-D) Cell count and percent PI+ in SUP-M2 cells with dox-induced knockout of IKZF1, ZFP91, or double knockout (DKO). Shown in (D) is cell number at day 4 relative to no dox. The experiment was performed in triplicate and replicated twice. Data are presented as mean plus or minus SD. Comparisons are by 2-tailed Student t test. (E) Correlation analysis of CRBN transcript expression levels with the extent of IKZF1 degradation by treatment of lenalidomide for 24 hours in TCL lines. Bottom, representative immunoblots show IKZF1 degradation in TCL lines treated with lenalidomide for 24 hours. (F) Relative fold changes in cell count across 20 TCL cell lines treated with indicated agents (1 μM) for 12 days compared to DMSO controls. (G) SUP-M2 cells were treated with 1 μM lenalidomide (left), pom (middle), CC-92480 (right), or DMSO for 5 hours, and protein abundance was quantified using TMT mass spectrometry–based proteomics. Significant changes were assessed by a moderated t test as implemented in the limma package, with the log2 fold change (log2FC) shown on the y-axis and −log10(P values) on the x-axis. *P < .05; **P < .01; ***P < .001. TMT, tandem mass tag.
To address possible causes of pharmacologic failure, we compared gene expression of 33 known regulators of IMiD activity24 with the extent of lenalidomide-induced IKZF1 degradation across TCL lines (supplemental Figure 3D). Strikingly, expression of CRBN was the most correlated with IKZF1 degradation (r = 0.8166; Figure 3E). To test the direct contribution of CRBN levels to IMiD sensitivity, we transduced pomalidomide-resistant cells with a viral vector overexpressing CRBN, which led to a greater than fivefold increase in CRBN protein levels. CRBN overexpression increased the degree of degradation for both IKZF1 and ZFP91, causing a markedly greater sensitivity to pomalidomide in TCLs with primary resistance (supplemental Figure 3E-J). We therefore hypothesized that a more potent degrader of IKZF1 and ZFP91 could overcome pomalidomide resistance resulting from low CRBN expression.
CC-92480, a novel CEreblon E3 Ligase MoDulator (CELMoD) agent,26 shares the same glutarimide ring with IMiDs but contains an additional arylpiperazine moiety. We found that CC-92480 (1 μM) treatment led to almost complete degradation of IKZF1 and ZFP91 across pomalidomide-resistant TCL lines (Figure 3A). The newer-generation agent CC-220/iberdomide27 had intermediate activity (Figure 3A). Strikingly, the improved degradation by CC-92480 was associated with induction of apoptosis and reduced cell proliferation across all 20 TCL cell lines, even at a dose of 0.1 μM (Figure 3F; supplemental Figure 4A-B).
To directly compare substrate selectivity in TCL cells, we treated SUP-M2 cells with 1 μM CC-92480 or IMiDs for 5 hours, then assessed protein abundance by quantitative MS. CC-92480 induced 18.3-fold and 6.7-fold downregulation of IKZF1 and ZFP91, respectively (Figure 3G). Pomalidomide had similar selectivity but less effect (6.1-fold of IKZF1, 2.6-fold of ZFP91). Lenalidomide only induced 2.6-fold reduction of IKZF1, with no effect on ZFP91 (Figure 3G). As expected, both CC-92480 and IMiDs decreased their target protein levels without altering messenger RNA expression, whereas IL10 downregulation was a secondary effect induced by IKZF1 degradation (supplemental Figure 4C).
To define mechanisms of killing by IMiDs and CC-92480, we performed RNA sequencing (RNA-seq) and gene set variation analysis in pomalidomide-resistant TCLs treated with vehicle, lenalidomide, pomalidomide, or CC-92480. Across 3 lines, CC-92480 treatment resulted in an enrichment of signatures for interferon response, p53 pathway, TNFα signaling, and apoptosis with impaired cell cycle compared with DMSO or the other 2 agents (supplemental Figure 4D-E). Together, these data suggest that more potent degradation of both IKZF1 and ZFP91 can overcome pomalidomide resistance in TCL cells through upregulation of pathways previously implicated for IMiDs in B- and myeloid diseases.23,28,29
The novel CELMoD CC-92480 is highly active against multiple TCL models in vivo
To assess the in vivo efficacy of CC-92480, we first used an ALK+ ALCL subcutaneous model with SUP-M2 cells, which are resistant to pomalidomide in vitro (Figure 3F). After engraftment, mice were randomized to receive pomalidomide (3 mg/kg), CC-92480 (1 mg/kg), or vehicle by mouth. All the mice were euthanized when any tumor reached 2 cm in the longest dimension (Figure 4A). Treatment with CC-92480 markedly reduced tumor growth compared with either vehicle- or pomalidomide-treated mice (Figure 4B).
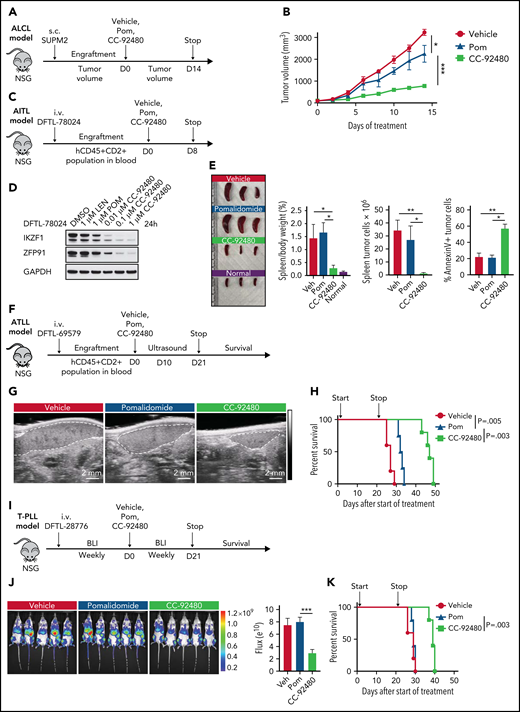
CC-92480 induces tumor regression and extends survival in TCL models in vivo. (A) Workflow of ALCL SUP-M2 in vivo model. (B) Tumor volume of mice treated with vehicle, 3 mg/kg pomalidomide (pom), or 1 mg/kg CC-92480 by mouth daily (n = 3 per arm). (C) Workflow of AITL model using DFTL-78024 PDX cells. (D) Western blot analysis of IKZF1 and ZFP91 expression in DFTL-78024 PDX cells upon exposure to lenalidomide (len), pom, or CC-92480 at indicated doses for 24 hours. (E) Spleens were harvested from mice treated with vehicle (n = 3), pom (3 mg/kg, n = 4), CC-92480 (1 mg/kg, n = 4), as well as from unengrafted NSG mice (normal, n = 3). Spleen/body weight, spleen tumor burden (the number of Annexin V-PI- tumor cells), and the percent of Annexin V+ tumor cells are shown on the right. Data are presented as mean plus or minus SEM. (F) Workflow of ATLL model using DFTL-69579 PDX cells. (G) Representative ultrasounds showing reduced spleen size (dotted border) after 10-day treatment with CC-92480. (H) Kaplan-Meier survival analyses by log-rank test after 21-day treatment with vehicle (n = 5), pom (3 mg/kg, n = 4), or CC-92480 (1 mg/kg, n = 5). (I) Workflow of T-cell prolymphocytic leukemia model using DFTL-28776 PDX cells that express a luciferase reporter. (J) Bioluminescence imaging of mice exposed to vehicle (n = 5), pomalidomide (3 mg/kg, n = 5), or CC-92480 (1 mg/kg, n = 5) for 21 days. (K) Kaplan-Meier survival analyses by log-rank test. Arrows indicate start (day 0) and stop (day 21) of treatment. *P < .05; **P < .01; ***P < .001. NSG, NOD scid gamma; SEM, standard error of the mean.
CC-92480 induces tumor regression and extends survival in TCL models in vivo. (A) Workflow of ALCL SUP-M2 in vivo model. (B) Tumor volume of mice treated with vehicle, 3 mg/kg pomalidomide (pom), or 1 mg/kg CC-92480 by mouth daily (n = 3 per arm). (C) Workflow of AITL model using DFTL-78024 PDX cells. (D) Western blot analysis of IKZF1 and ZFP91 expression in DFTL-78024 PDX cells upon exposure to lenalidomide (len), pom, or CC-92480 at indicated doses for 24 hours. (E) Spleens were harvested from mice treated with vehicle (n = 3), pom (3 mg/kg, n = 4), CC-92480 (1 mg/kg, n = 4), as well as from unengrafted NSG mice (normal, n = 3). Spleen/body weight, spleen tumor burden (the number of Annexin V-PI- tumor cells), and the percent of Annexin V+ tumor cells are shown on the right. Data are presented as mean plus or minus SEM. (F) Workflow of ATLL model using DFTL-69579 PDX cells. (G) Representative ultrasounds showing reduced spleen size (dotted border) after 10-day treatment with CC-92480. (H) Kaplan-Meier survival analyses by log-rank test after 21-day treatment with vehicle (n = 5), pom (3 mg/kg, n = 4), or CC-92480 (1 mg/kg, n = 5). (I) Workflow of T-cell prolymphocytic leukemia model using DFTL-28776 PDX cells that express a luciferase reporter. (J) Bioluminescence imaging of mice exposed to vehicle (n = 5), pomalidomide (3 mg/kg, n = 5), or CC-92480 (1 mg/kg, n = 5) for 21 days. (K) Kaplan-Meier survival analyses by log-rank test. Arrows indicate start (day 0) and stop (day 21) of treatment. *P < .05; **P < .01; ***P < .001. NSG, NOD scid gamma; SEM, standard error of the mean.
Next, we engrafted mice with a systemic AITL (DFTL-78024) PDX that primarily involves the spleen and treated for 8 days with vehicle, pomalidomide, or CC-92480 (Figure 4C). CC-92480 potently induced degradation of both IKZF1 and ZFP91 in the PDX cells in vitro (Figure 4D). Splenic AITL involvement was reduced >95% in CC-92480–treated mice after only 8 days of treatment, and ∼60% of the residual AITL cells were apoptotic (Figure 4E). In contrast, pomalidomide had very limited effects (Figure 4D-E).
To test the effects of these agents on survival, we engrafted ATLL (DFTL-69579) or T-cell prolymphocytic leukemia (DFTL-28776) PDXs and treated with pomalidomide, CC-92480, or vehicle (Figure 4F-K). Spleen size and lymphoma involvement were markedly reduced in CC-92480–treated mice in both models based on splenic ultrasound or luciferase imaging (Figure 4G,J). In contrast, pomalidomide had very limited effects (Figure 4G,J). Treatment with CC-92480 for 21 days significantly improved survival in both models compared with pomalidomide treatment or vehicle (Figure 4H,K). Both pomalidomide and CC-92480 treatment were very well tolerated (supplemental Figure 4F). Together, these results demonstrate that CC-92480 is highly active against a range of TCL subtypes and has superior activity compared with pomalidomide both in vitro and in vivo.
ZFP91 acts as a bona fide transcription factor
Next, we took advantage of the paired parental and len-regrown SU-DHL1 cells to examine the role of ZFP91 in TCL cells. Upregulated genes in len-regrown compared with parental cells were enriched in pathways for chromatin modifications, hormone signaling, cell-cell interactions, and Wnt signaling (supplemental Figure 5A-B; P < .01). Consistent with these upregulated pathways, len-regrown cells but not parental cells had constitutive phosphorylation of extracellular signal-regulated kinase (ERK) and could form single-cell colonies (Figure 5A-B). Strikingly, ZFP91 knockout had minimal effects in parental cells (n = 38 genes with fold change >1.5 and adjusted P < .05) but markedly affected transcription in len-regrown cells (n = 1139 genes) (Figure 5C; supplemental Table 2). The same enriched, upregulated pathways in len-regrown cells were downregulated upon ZFP91 knockout (supplemental Figure 5C-D), indicating that loss of ZFP91 reverses the transcriptional differences between len-regrown and parental cells.
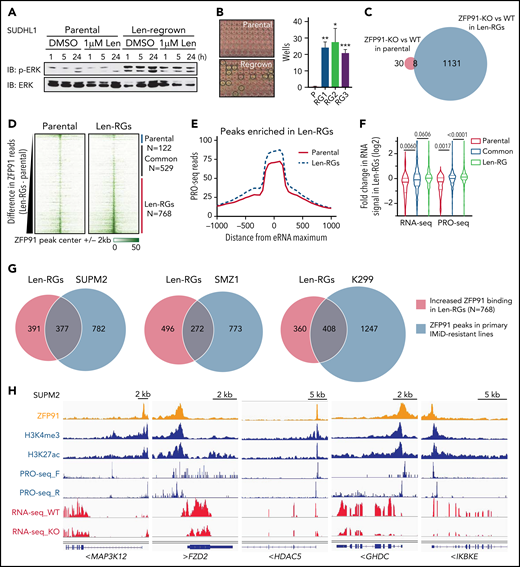
ZFP91 functions as a transcription factor in TCLs and targets keynote genes from histone modification, WNT, NF-kB, and MAP kinase signaling. (A) Western blot of phosphorylated (p-ERK) and total ERK in SU-DHL-1 parental and len-regrown cells treated with 1 μM len for indicated timepoints compared with DMSO. (B) SU-DHL-1 parental and len-regrown cells were single-cell sorted and plated. Wells with proliferating cells were counted 3 weeks after plating. Data are from 3 independent experiments and assessed by 2-tailed Student t test (means plus or minus SD). (C) Venn diagram shows the numbers of genes with significantly altered expression upon ZFP91 knockout (KO) in SU-DHL-1 parental and len-regrown (RG) cells compared with their wild-type counterparts. (D) Heatmaps of ZFP91 ChIP-seq signals centered on ZFP91 peaks in SU-DHL-1 parental and len-regrown cells (N = 1419). Peaks were defined as common (n = 529), enriched in parental (n = 122), or enriched in len-RG (n = 768) cells as indicated at right. (E) Analysis of PRO-seq signal near distal ZFP91 peaks enriched in len-regrown cells. To focus on sites of enhancer RNA (eRNA) synthesis within ZFP91-bound enhancers, metagene plots were centers at sites of maximum PRO-seq signal within 2kb of ZFP91 peaks. Graphed are PRO-seq reads in 25nt bins, smoothed over 3 neighbors. (F) Violin plots show the fold change in RNA-seq or PRO-seq signal in len-regrown vs parental cells within genes nearest to distal ZFP91 peaks. Genes were divided based on whether the ZFP91 peak was common or enriched in parental or len-RG cells. P values are from Kruskal Wallis tests. (G) Analysis of the overlapping of ZFP91 ChIP-seq peaks from SU-DHL-1 len-regrown cells and 3 primary IMiD-resistant TCL lines by Bedtools. (H) IGV tracks show ZFP91 binding at MAP3K12, FZD2, HDAC5, GHDC, and IKBKE with H3K4me3, H3K27ac, PRO-seq, and RNA-seq signals in SUP-M2 cells. IGV, Integrative Genomics Viewer.
ZFP91 functions as a transcription factor in TCLs and targets keynote genes from histone modification, WNT, NF-kB, and MAP kinase signaling. (A) Western blot of phosphorylated (p-ERK) and total ERK in SU-DHL-1 parental and len-regrown cells treated with 1 μM len for indicated timepoints compared with DMSO. (B) SU-DHL-1 parental and len-regrown cells were single-cell sorted and plated. Wells with proliferating cells were counted 3 weeks after plating. Data are from 3 independent experiments and assessed by 2-tailed Student t test (means plus or minus SD). (C) Venn diagram shows the numbers of genes with significantly altered expression upon ZFP91 knockout (KO) in SU-DHL-1 parental and len-regrown (RG) cells compared with their wild-type counterparts. (D) Heatmaps of ZFP91 ChIP-seq signals centered on ZFP91 peaks in SU-DHL-1 parental and len-regrown cells (N = 1419). Peaks were defined as common (n = 529), enriched in parental (n = 122), or enriched in len-RG (n = 768) cells as indicated at right. (E) Analysis of PRO-seq signal near distal ZFP91 peaks enriched in len-regrown cells. To focus on sites of enhancer RNA (eRNA) synthesis within ZFP91-bound enhancers, metagene plots were centers at sites of maximum PRO-seq signal within 2kb of ZFP91 peaks. Graphed are PRO-seq reads in 25nt bins, smoothed over 3 neighbors. (F) Violin plots show the fold change in RNA-seq or PRO-seq signal in len-regrown vs parental cells within genes nearest to distal ZFP91 peaks. Genes were divided based on whether the ZFP91 peak was common or enriched in parental or len-RG cells. P values are from Kruskal Wallis tests. (G) Analysis of the overlapping of ZFP91 ChIP-seq peaks from SU-DHL-1 len-regrown cells and 3 primary IMiD-resistant TCL lines by Bedtools. (H) IGV tracks show ZFP91 binding at MAP3K12, FZD2, HDAC5, GHDC, and IKBKE with H3K4me3, H3K27ac, PRO-seq, and RNA-seq signals in SUP-M2 cells. IGV, Integrative Genomics Viewer.
To gain further insight into ZFP91 function, we mapped ZFP91 binding genome-wide using chromatin immunoprecipitation sequencing (ChIP-seq) (supplemental Table 3). Analysis of ZFP91 ChIP-seq signal (n = 1419) demonstrated broadly increased binding of ZFP91 on chromatin in len-regrown cells compared with parental cells (Figure 5D). We observed peaks of active histone marks H3K27ac and H3K4me3 at these loci (supplemental Figure 6A-B). Notably, the levels of these active marks increased significantly in len-regrown cells at sites of elevated ZFP91 binding (supplemental Figure 6C).
To precisely map the effects of ZFP91 at both enhancers and promoters, we directly quantified nascent RNA synthesis using precision nuclear run-on sequencing (PRO-seq). This assay revealed that the increased ZFP91 binding at distal peaks corresponded to increased transcription of eRNAs near bound sites (Figures 5E; supplemental Figure 6C). Moreover, higher-level binding of ZFP91 in len-regrown cells was associated with increased transcription of the closest genes as evidenced by both RNA-seq and PRO-seq signals (Figure 5F). To directly confirm the activity of ZFP91 as a transcription factor, we cloned its predicted binding sequence into a luciferase reporter. Both pomalidomide treatment and ZFP91 knockout reduced luciferase activity (supplemental Figure 6D-E), demonstrating that ZFP91 can function as a transcriptional activator in lenalidomide-resistant TCL cells.
Notably, ZFP91 binding sites by ChIP-seq were highly overlapping (35.4% ∼ 53.1%) between acquired len-regrown SU-DHL1 cells and TCLs with primary resistance to lenalidomide (Figure 5G). Kyoto Encyclopedia of Genes and Genomes and gene ontology analysis revealed that the potential target genes of ZFP91 were mainly enriched in pathways for MAPK, NF-κB, Wnt signaling, and histone modification (supplemental Figure 7A-B). We then focused on target genes directly activated by ZFP91 in TCL cells. We analyzed high-confidence target genes, in which ZFP91 binds within or surrounding (<10 kb) the gene locus, and the expression was significantly downregulated by ZFP91 knockout (fold change <0.67 and adjusted P < .05). Among these genes were MAP3K12 (MAPK pathway), FZD2 (Wnt signaling pathway), HDAC5 (histone modification), GHDC, and IKBKE (NF-κB pathway) (Figure 5H). A very similar set of targets from the same pathways were identified in len-regrown cells (supplemental Figure 7C). We confirmed ZFP91 binding at multiple loci by ChIP–quantitative polymerase chain reaction across multiple TCL lines (supplemental Figure 7D-E). PRO-seq analysis demonstrated transcription of eRNAs near peaks of ZFP91 and active histone modifications at these loci (Figure 5H). Thus, ZFP91 functions as a transcriptional activator that drives a program in multiple TCLs associated with activation of MAPK, NF-κB, and WNT signaling.
The AP-1 transcription factor c-Jun negatively regulates ZFP91 rewiring in TCLs
Finally, we addressed how acquired len-resistant TCLs become dependent on the combination of ZFP91 and IKZF1. Motif analysis at sites of ZFP91 binding demonstrated a joint ZFP91/IKZF1 motif in both len-regrown cells and in multiple primary resistant TCL lines (Figure 6A). Unlike in resistant cells, a joint ZFP91/AP-1 motif was identified in lenalidomide-sensitive cells (Figure 6A). In line with this motif change, JUN (encoding the AP-1 transcription factor c-Jun) was one of the top downregulated genes in len-regrown cells compared with parental cells (supplemental Figure 8A; supplemental Table 4). c-Jun protein was also decreased in len-regrown cells. The residual c-Jun had increased phosphorylation at serine 249 (Figure 6B-C), which is known to reduce DNA binding and leads to autodownregulation of JUN transcription.30 To test whether the redistribution of ZFP91 binding is regulated by c-Jun, we generated JUN-knockout cells. Compared with parental (wild-type) cells, JUN-knockout recapitulated the profile of ZFP91 rewiring observed in len-regrown cells by significantly increasing ZFP91 binding (P < .0001, Figure 6D-E), particularly at the target genes identified in len-regrown cells (Figure 6F; supplemental Figure 8B).
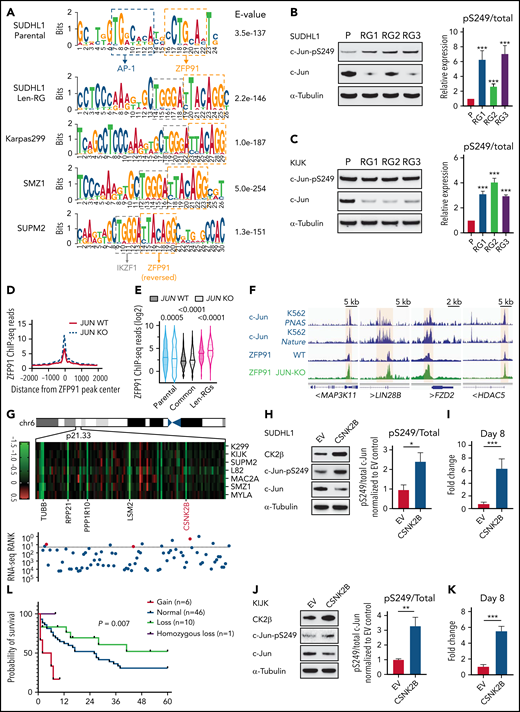
Inactivation of the AP-1 transcription factor c-Jun contributes to ZFP91 rewiring. (A) DNA sequence motifs at ZFP91 ChIP-seq peaks in SU-DHL-1 parental, len-regrown cells, and 3 primary IMiD-resistant TCL lines. Motif analysis was performed using MEME-ChIP. (B) Representative western blot (left) and quantitative analysis (right) of phospho-Ser249 (pS249) and total c-Jun in SU-DHL-1 parental and len-regrown cells. (C) Representative western blot (left) and quantitative analysis (right) of phospho-Ser249 (pS249) and total c-Jun expression in KI-JK parental and len-regrown cells. (D) Metagene plot shows the distribution of ZFP91 ChIP-seq signals around ZFP91 peaks (plus or minus 2 kb) that were enriched in len-RGs (peaks indicated in Figure 5D). Data are from SU-DHL-1 cells with dox-induced JUN-knockout (KO) vs wild-type (WT) control. (E) Violin plots show ChIP-seq reads of ZFP91 signals enriched in the 3 groups of peaks defined in Figure 5D. Data are from SU-DHL-1 cells with dox-induced, JUN-KO vs WT control. (F) IGV tracks showing ZFP91 binding at the MAP3K11, LIN28B, FZD2, and HDAC5 gene loci in SU-DHL-1 JUN-KO cells (green) compared with WT control (blue). c-Jun ChIP-seq data were downloaded from ENCODE.40,41 (G) Heatmap showing CERES depletion scores for genes within the 6p21.33 amplicon based on our previous CRISPR screen across 7 TCL lines (upper) and rank for those genes among all genes upregulated in len-regrown vs parental cells (bottom). The dashed line indicates the top 20 genes upregulated by RNA-seq in len-regrown cells. (H) Representative western blot (left) and quantitative analysis (right) of pS249 and total c-Jun expression in SU-DHL-1 cells with CSNK2B overexpression compared with empty vector control. (I) Cell count in SU-DHL-1 cells with CSNK2B overexpression treated with 1 μM len or DMSO. Shown in right, comparison of the fold change of cell numbers relative to empty vector (EV) control at day 8. (J) Representative Western blot (left) and quantitative analysis (right) of pS249 and total c-Jun expression in KI-JK cells with CSNK2B overexpression compared to empty vector control. (K) Cell count in KI-JK cells with CSNK2B overexpression treated with 1 μM lenalidomide (Len) or DMSO. Results are reported as fold change of cell numbers relative to empty vector (EV) control at day 8. The experiment was performed in triplicate and replicated twice. Data are presented as mean plus or minus SD. Comparisons are by 2-tailed Student t test. (L) Kaplan-Meier survival curve of PTCL patients.32,33 Patients were divided into 4 groups according to copy number of 6p21.33. Cumulative OS time were calculated using the Kaplan-Meier method and analyzed by the log-rank test. **P < .01; ***P < .001. Dox, doxycycline; OS, overall survival.
Inactivation of the AP-1 transcription factor c-Jun contributes to ZFP91 rewiring. (A) DNA sequence motifs at ZFP91 ChIP-seq peaks in SU-DHL-1 parental, len-regrown cells, and 3 primary IMiD-resistant TCL lines. Motif analysis was performed using MEME-ChIP. (B) Representative western blot (left) and quantitative analysis (right) of phospho-Ser249 (pS249) and total c-Jun in SU-DHL-1 parental and len-regrown cells. (C) Representative western blot (left) and quantitative analysis (right) of phospho-Ser249 (pS249) and total c-Jun expression in KI-JK parental and len-regrown cells. (D) Metagene plot shows the distribution of ZFP91 ChIP-seq signals around ZFP91 peaks (plus or minus 2 kb) that were enriched in len-RGs (peaks indicated in Figure 5D). Data are from SU-DHL-1 cells with dox-induced JUN-knockout (KO) vs wild-type (WT) control. (E) Violin plots show ChIP-seq reads of ZFP91 signals enriched in the 3 groups of peaks defined in Figure 5D. Data are from SU-DHL-1 cells with dox-induced, JUN-KO vs WT control. (F) IGV tracks showing ZFP91 binding at the MAP3K11, LIN28B, FZD2, and HDAC5 gene loci in SU-DHL-1 JUN-KO cells (green) compared with WT control (blue). c-Jun ChIP-seq data were downloaded from ENCODE.40,41 (G) Heatmap showing CERES depletion scores for genes within the 6p21.33 amplicon based on our previous CRISPR screen across 7 TCL lines (upper) and rank for those genes among all genes upregulated in len-regrown vs parental cells (bottom). The dashed line indicates the top 20 genes upregulated by RNA-seq in len-regrown cells. (H) Representative western blot (left) and quantitative analysis (right) of pS249 and total c-Jun expression in SU-DHL-1 cells with CSNK2B overexpression compared with empty vector control. (I) Cell count in SU-DHL-1 cells with CSNK2B overexpression treated with 1 μM len or DMSO. Shown in right, comparison of the fold change of cell numbers relative to empty vector (EV) control at day 8. (J) Representative Western blot (left) and quantitative analysis (right) of pS249 and total c-Jun expression in KI-JK cells with CSNK2B overexpression compared to empty vector control. (K) Cell count in KI-JK cells with CSNK2B overexpression treated with 1 μM lenalidomide (Len) or DMSO. Results are reported as fold change of cell numbers relative to empty vector (EV) control at day 8. The experiment was performed in triplicate and replicated twice. Data are presented as mean plus or minus SD. Comparisons are by 2-tailed Student t test. (L) Kaplan-Meier survival curve of PTCL patients.32,33 Patients were divided into 4 groups according to copy number of 6p21.33. Cumulative OS time were calculated using the Kaplan-Meier method and analyzed by the log-rank test. **P < .01; ***P < .001. Dox, doxycycline; OS, overall survival.
To address the mechanism of c-Jun downregulation in len-regrown cells, we analyzed exome sequencing data and found an increased copy number for a region of chromosome 6p21.33 compared with parental cells (Figure 6G). In fact, 11 of the top 20 upregulated genes from RNA-seq of len-regrown cells were within this region (Figure 6G; supplemental Table 5). We confirmed 6p21.33 amplification by fluorescence in situ hybridization (supplemental Figure 8C; supplemental Table 6).
CSNK2B, which encodes the casein kinase 2 (CK2) regulatory subunit CK2b, was one of the genes included within the 6p21.33 amplicon (Figure 6G). CSNK2B was a vulnerability in our previous CRISPR screen of TCL cell lines (Figure 6G) and is highly expressed in patient samples and PDXs across multiple PTCL entities (supplemental Figure 8D-E). Previous studies have established that CK2 phosphorylates c-Jun at serine 249,31 so we hypothesized that overexpression of CSNK2B would promote c-Jun S249 phosphorylation. We overexpressed CSNK2B in lenalidomide-sensitive cells at levels comparable to the increased expression in len-regrown cells (supplemental Figure 8F-G). CSNK2B overexpression increased c-Jun phosphorylation at serine 249, decreased c-Jun protein levels, and significantly reduced lenalidomide sensitivity (Figure 6H-K). The opposite effects were observed with CSNK2B knockout in len-regrown cells (supplemental Figure 8H-J). At the same time, CSNK2B knockout in TCL cells with primary resistance to IMiDs decreased c-Jun S249 phosphorylation and increased its total protein levels (supplemental Figure 8K-L), suggesting that CK2 also regulates c-Jun in these cells.
Discussion
Despite the role of IKZF1 in T-cell differentiation and cytokine signaling, currently available IMiDs have disappointing activity.13,14 It has remained an open question whether the “primary resistance” to lenalidomide and pomalidomide represents a lack of dependence on target proteins or is simply a pharmacologic failure. We found a close correlation between levels of CRBN expression and the extent of IKZF1 degradation induced by lenalidomide (supplemental Figure 3E). More definitively, overexpression of CRBN in IMiD-resistant TCLs markedly extended the degree of target protein degradation and resensitized cells to pomalidomide (supplemental Figure 3E-J), suggesting that a more potent degrader could overcome IMiD-resistance in TCLs.
CC-92480, a novel CELMoD agent, shares the same glutarimide rings with IMiDs for binding to cereblon and substrates. However, CC-92480 contains additional arylpiperazine moiety and thus creates a hotspot on the surface of CRBN for direct ligase-target protein interactions.26 Consistent with its subtle structure, we found that CC-92480 exhibited a unique profile in IMiD-resistant TCLs: (1) enhanced efficacy to drive the degradation of target proteins, which requires only ∼100-fold lower concentrations and shorter times, and (2) resulted in much higher levels of immune response, apoptosis, and cell cycle arrest. This improved potency may explain the superior cell autonomous activity of CC-92480 and its ability to function in primary IMiD-resistant backgrounds. In fact, CC-92480 was broadly effective against multiple TCL subtypes, and this was solely through degradation of IKZF1 and ZFP91 (Figure 3E-F).
Currently, CC-92480 are in clinical development for evaluating the safety and efficacy in newly diagnosed multiple myeloma and relapsed or refractory multiple myeloma. In the present study, we tested CC-92480 in our preclinical PDX models that recapitulate features of human TCL. We noted that CC-92480 given daily (1 mg/kg) was well tolerated by xenografted mice and was able to maintain lower levers of IKZF1 and ZFP91 expression in vivo compared with either vehicle or pomalidomide regimen. In systemic PDX models, only 8 to 10 days treatment with CC-92480 could decrease the spleen size to near normal range. CC-92480 as a single-agent delayed tumor progression and significantly prolong survival in PDX models, strongly suggesting that novel CELMoD agents, like CC-92480, could be an attractive therapeutic strategy for the treatment of TCL patients.
Previous findings that lenalidomide lead to degradation of IKZF1 and CK1α were important steps in exploiting the central role of IKZF1 and CK1α and hence provided a mechanistic basis for the therapeutic window of lenalidomide in B-cell malignance and myelodysplastic syndrome.9 Previous CRISPR screen revealed IKZF1 as one of the key vulnerability in TCLs.15 A subset of TCL lines, including SU-DHL-1 and KI-JK, are dependent on IKZF1 alone. It is also worth noting that IKZF1 is dispensable for the other half of the lines from the same screen. Moreover, in our present study, codependence on IKZF1 and ZFP91 was found to be existed in both acquired and primary IMiD-resistant scenarios. This finding highlighted that a greater and broader toxicity could be achieved by cotargeting IKZF1 and ZFP91 in TCLs. Consistently, double knockout of IKZF1 and ZFP91 fully recapitulated the effect of CC-92480, suggesting that both IKZF1 and ZFP91 play critical roles and contribute to IMiD-resistance in TCL cells.
Using a combination of ChIP-seq, PRO-seq, and RNA-seq, we showed that ZFP91 binds at promoters and enhancers and promotes transcription of both genes and enhancer RNAs. Based on its structure, ZFP91 was initially thought to act as a TF.34 Supporting this, ZFP91 acted as a cofactor with NF-κB/p65 to drive transcriptional activation of HIF135 and as an insulin-responsive TF in hepatocytes that required an intact Pck1p insulin-response sequence for binding at target genes.36 These studies suggest that ZFP91 promotes transcription as a coactivator with another TF. In that regard, we noted that ZFP91 binding frequently occurred in sequences with motifs for either AP-1 (in IMiD-sensitive cells) or IKZF1 (in IMiD-resistant cells). Loss of c-Jun resulted in redistribution of ZFP91, suggesting that ZFP91 is not a pioneer factor but instead modulates transcription in concert with other TFs.
Of interest, multiple studies have reported that ZFP91 has E3 ubiquitin ligase activity. Jin et al reported that ZFP91 promoted K63-linked ubiquitination of NF-κB-inducing kinase in HEK293 cells.37 In Treg cells, ZFP91 loss did not affect K63-linked ubiquitination of NF-κB-inducing kinase.38 Instead, ZFP91 rapidly translocated from the nucleus to the cytoplasm in response to T-cell receptor stimulation and then mediated K63-linked ubiquitination of BECN1 and formation of the autophagosome initiation complex.38 Mice with Treg-specific deletion of ZFP91 developed severe autoimmunity affecting multiple tissues as well as inflammation-induced colon carcinogenesis. In effector T cells, deletion of ZFP91 increased mTORC1-driven cell glycolysis and boosted antitumor T-cell responses,39 suggesting that targeting ZFP91 may also improve the efficacy of cancer immunotherapy. In fact, the effects on nonmalignant T cells from concurrent loss of IKZF1 and ZFP91, whether genetic or through potent small molecule degraders, remains an important and unaddressed area for investigation. It also remains unclear whether ZFP91 could promote the ubiquitination of TFs or other factors bound to chromatin and thereby modulate transcription of target genes. Overall, we discovered a critical role of ZFP91 as a transcription factor that coregulates cell survival of IMiD-resistant TCLs with IKZF1. Newer-generation degrader, by potently targeting IKZF1 and ZFP91, could be an attractive therapeutic strategy for the treatment of TCL patients.
Acknowledgments
The authors thank Katia Georgopoulos, Cedric Menard, and members of the Weinstock laboratory for thoughtful comments. They thank Wenjing Wu for help with preparation of graphics. They thank the Nascent Transcriptomics Core at Harvard Medical School, Boston, MA for assistance with PRO-seq library construction and data analysis. They thank the Flow Cytometry Core facility at Dana-Farber Cancer Institute for assistance with cell sorting and flow cytometry analysis.
This work was supported in part by the National Cancer Institute (NCI), National Institutes of Health R35 CA231958 and P01 CA248384 (both to D.M.W.), R01 CA214608 (to E.S.F.), and the Ludwig Center at Harvard (to K.A.).
Authorship
Contribution: W.W., E.S.F., K.A., and D.M.W. were responsible for conception and design of the study; W.W., R.K., K.A.D., R.P.N., T.B.H.-F., H.L., J.D., M.K.J., L.Y., S.A., N.L.D., and F.P. were responsible for acquisition of data; W.W., G.M.N., K.A.D., K.E.S., T.B.H.-F., M.K.J., A.J.N., S.Y.N., G.W., S.J., R.X., P.R.H., L.d.L., P.G., J.I., A.T., E.S.F., K.A., and D.M.W. interpreted and analyzed data; and W.W and D.M.W. wrote the manuscript. All authors critically revised the article and approved the final version.
Conflict-of-interest disclosure: E.S.F. is a founder, scientific advisory board (SAB), and equity holder in Civetta Therapeutics, Jengu Therapeutics (board member), and Neomorph, Inc. E.S.F. is an equity holder in C4 Therapeutics and reports personal fees from Novartis, Sanofi, EcoR1 capital, Deerfield and Astellas during the conduct of the study and outside the submitted work. The Fischer lab receives or has received research funding from Novartis, Ajax and Astellas. K.A. is a consultant for Syros Pharmaceuticals, is on the SAB of CAMP4 Therapeutics, and receives research funding from Novartis not related to this work. S.J. is supported by the National Cancer Institute K08 Career Development Award (K08CA230498). K.A.D. is a consultant to Kronos Bio and Neomorph Inc. G.W. is a Fellow of The Leukemia & Lymphoma Society. D.M.W. is a founder and SAB member for Ajax Pharmaceuticals and a consultant or Scientific Advisory Board member for Bantam Pharmaceuticals, Secura Biopharma, Daiichi Sankyo, Travera, Trillium, ASELL and Astra Zeneca. The Weinstock lab receives research funding from Daiichi Sankyo, Verastem and Abcuro. No other disclosures were reported. The remaining authors declare no competing financial interests.
Correspondence: David M. Weinstock, Dana-Farber Cancer Institute, 450 Brookline Avenue, Dana 510B, Boston, MA 02215; e-mail: davidm_weinstock@dfci.harvard.edu
Our data are available at the Gene Expression Omnibus under accession number GSE172505.
The online version of this article contains a data supplement.
There is a Blood Commentary on this article in this issue.
The publication costs of this article were defrayed in part by page charge payment. Therefore, and solely to indicate this fact, this article is hereby marked “advertisement” in accordance with 18 USC section 1734.

This feature is available to Subscribers Only
Sign In or Create an Account Close Modal