

Key Points
Induced pluripotent stem cell model of SF3B1-mutant MDS develops RS.
Coordinated mis-splicing of TMEM14C and ABCB7 causes RS formation.

Abstract
SF3B1 splicing factor mutations are near-universally found in myelodysplastic syndromes (MDS) with ring sideroblasts (RS), a clonal hematopoietic disorder characterized by abnormal erythroid cells with iron-loaded mitochondria. Despite this remarkably strong genotype-to-phenotype correlation, the mechanism by which mutant SF3B1 dysregulates iron metabolism to cause RS remains unclear due to an absence of physiological models of RS formation. Here, we report an induced pluripotent stem cell model of SF3B1-mutant MDS that for the first time recapitulates robust RS formation during in vitro erythroid differentiation. Mutant SF3B1 induces missplicing of ∼100 genes throughout erythroid differentiation, including proposed RS driver genes TMEM14C, PPOX, and ABCB7. All 3 missplicing events reduce protein expression, notably occurring via 5′ UTR alteration, and reduced translation efficiency for TMEM14C. Functional rescue of TMEM14C and ABCB7, but not the non–rate-limiting enzyme PPOX, markedly decreased RS, and their combined rescue nearly abolished RS formation. Our study demonstrates that coordinated missplicing of mitochondrial transporters TMEM14C and ABCB7 by mutant SF3B1 sequesters iron in mitochondria, causing RS formation.
Introduction
Sideroblastic anemias comprise a heterogeneous group of inherited and acquired disorders characterized by ring sideroblasts (RS), erythroid precursors harboring perinuclear iron-laden mitochondria.1 The presence of RS in the marrow is a common pathological finding in myelodysplastic syndromes (MDS). Papaemmanuil et al first identified a strong association with somatic mutations in the core spliceosome factor SF3B1 in MDS with ring sideroblasts (MDS-RS).2 SF3B1 is part of the U2 small nuclear ribonucleoproteins complex, which mediates 3′ splice site selection by binding to intronic branchpoint sequences. SF3B1 change-of-function mutations in MDS and other cancers promote usage of alternative 3′ splice sites (a3′ss), generating a repertoire of aberrant transcripts.3,4SF3B1-mutant MDS has been proposed to be a distinct nosologic entity marked by ineffective erythropoiesis and RS formation, lower incidence of multilineage dysplasia and leukemic progression, and higher overall survival.5,6 Despite this remarkably strong association, the molecular basis of ring sideroblast formation in SF3B1-mutated MDS remains incompletely understood.
Inherited sideroblastic anemias (ISAs) are often characterized by defects in mitochondrial iron and heme metabolism.7 Mutations in ALAS2, a rate-limiting step of heme synthesis, are the most common cause of ISAs.8 Mutations in ABCB7, the only known mitochondrial iron-sulfur cluster (Fe-S) exporter, cause X-linked sideroblastic anemia (XLSA) with ataxia.4,9 A compelling hypothesis is that SF3B1 mutations in MDS mimic ISAs by altering splicing of iron-related genes,10 inducing iron accumulation in mitochondria in the form of mitochondrial ferritin.11 Consistent with this hypothesis, molecular studies of SF3B1-mutated MDS bone marrow cells have identified pervasive missplicing of ABCB7, as well as TMEM14C and PPOX, which mediate sequential reactions in heme biosynthesis.12,13 Overexpression of ABCB7 in MDS-RS patient cells rescues erythroid differentiation defects,14,15 suggesting that loss of ABCB7 is a major driver in MDS-RS. To directly test the role of aberrant gene transcripts in RS formation requires cell models of SF3B1-mutated MDS. SF3B1K700E conditional knock-in mice develop ineffective erythropoiesis and anemia but not RS.16,17 MDS-RS patient cells give rise to RS, but only after transplantation into immunodeficient mice or on 3D scaffolds.18–20 Although an induced pluripotent stem cell (iPSC)-derived model of XLSA has been developed, to date, there is no in vitro model of MDS-RS.21,22 Because current mouse and human cell models with SF3B1 mutations do not give rise to RS in vitro, the role of missplicing of heme and iron metabolism genes in RS formation in MDS remains unresolved.
Here, we describe a patient-derived iPSC model of SF3B1-mutant MDS, which recapitulates missplicing patterns in MDS-RS patients and, for the first time, robust RS formation during in vitro erythroid differentiation. Using this model, we demonstrate that missplicing of TMEM14C and ABCB7 causes RS formation in SF3B1-mutant MDS.
Methods
iPSC reprogramming
Bone marrow mononuclear cells were obtained from an MDS-RS patient according to the institutional guidelines approved by the University of Washington and Fred Hutchinson Cancer Research Center Institutional Review Board. Written informed consent was received per the Declaration of Helsinki. Clinical sequencing was performed using a TruSeq Custom Amplicon panel, clinically validated for detection of mutations in genes commonly mutated in myeloid neoplasms. iPSC reprogramming, hematopoietic differentiation, and 5F-HPC generation was performed as previously described.23 iPSC colonies were genotyped for patient mutations by polymerase chain reaction (PCR) and Sanger sequencing.
5F-HPC culture
5F-HPCs cells were cultured in StemSpan Serum-Free Expansion Medium (StemCell Technologies) with 50 ng/mL stem cell factor (SCF), 50 ng/mL FLT3, 50 ng/mL TPO, 50 ng/mL IL-6, 10 ng/mL IL-3 (all Peprotech) and penicillin/streptomycin. Doxycycline was added at 2 μg/mL (Sigma). Cultures were maintained at < 1.5 × 10⁶ cells/mL, and media was exchanged every 3 to 4 days. 5F-HPC lines were maintained in culture between 60 to 100 days prior to induction of erythroid differentiation.
Erythroid differentiation
Differentiation protocol was adapted based on Lee et al.24 5F-HPC cells expanded in progenitor media with doxycycline were placed directly into erythroid stage 1 media without doxycycline or exogenous iron. Stage 1 (6 days): Iscove modified Dulbecco medium + 1% bovine serum albumin (Gibco), 20% fetal bovine serum (FBS) (Sigma), 1 mM l-glutamine, penicillin/streptomycin, 500 μg/mL holo-transferrin (Sigma), 10 μg/mL human insulin (CellSciences), 6U Epo (Procrit), 100 ng/mL SCF, and 5 ng/mL IL-3. Cells were seeded at a density of 2 to 3 × 10⁵ cells/mL in 24-well plates. Stage 2 (up to 12 days): Media were changed to Iscove modified Dulbecco medium + 1% bovine serum albumin, 20% FBS, 1 mM l-glutamine, penicillin/streptomycin, 500 μg/mL holo-transferrin, 10 μg/mL human insulin, 6U Epo, and 50 ng/mL SCF. Cells were seeded at a density of 3 × 10⁵ cells/mL in 24-well plates as cell number permitted. During stage 2, cells were maintained at a density of <2 × 10⁶/mL in a maximum volume of 2.5 mL of media in a 24-well plate. For larger numbers of cells, plates and dish sizes were scaled up accordingly to maintain the 3 × 10⁵ cells/mL density. Erythroid differentiation was carried out until day 18 (6 days stage 1 + 12 days stage 2), and differentiation efficiency evaluated by flow cytometry and cell morphology as described below prior to proceeding with RS staining.
Flow cytometry
Erythroid differentiation was analyzed at the end of stage 1 or during stage 2 using antibodies CD71 APC-H7 or APC (M-A712; BD) and CD235a/Glycophorin A PE-Cy7 (11E4B-7-6; Coulter). Stain was performed with < 1 × 10⁵ cells per 50 μl staining buffer (phosphate-buffered saline + 2% FBS) with 1:100 dilution of each antibody for 30 minutes at 37°C in the dark. Acquisition was performed on BD LSRII flow cytometer with the optical configuration installed here: (http://www.pathology.washington.edu/research/flow/images/LSR%20Detector%20Array.pdf).
May-Grunwald Giemsa staining
5 × 10⁴ to 1 × 10⁵ were collected onto microscope slides with a cytocentrifuge (Shandon/Thermo Scientific) and air dried. Slides were stained in May-Grunwald solution (Sigma) and then stained in 1:33 dilution of Giemsa solution (Sigma) for 12 minutes. Slides were washed twice in water and air dried prior to Vectamount (Vector Laboratories) and coverslip. Erythroid morphology was quantified as basophilic, polychromatic, orthochromatic erythroblasts, or reticulocytes.
RS iron staining
RS staining was performed starting on day 14, with the highest efficiency of RS formation observed on days 17 and 18 of erythroid culture. For RS staining, 5 × 10⁴ to 1 × 10⁵ cells were collected onto microscope slides with a cytocentrifuge (Thermo Scientific) and air dried. Cells were fixed in −20°C methanol for 12 minutes and air dried prior to iron staining. Slides were stained with Prussian Blue kit (Abcam, ab150674). Solutions were prepared according to the manufacturer’s protocol. Slides were incubated in water for 30 seconds prior to a 12-minute incubation in iron stain followed by a 30-second water wash. Cells were counter-stained in nuclear fast red for 5 minutes and rinsed for 4 × 30-second washes in water. Slides were preserved with Vectamount (Vector laboratories) and coverslipped prior to image acquisition.
Microscopy analysis
All images were collected with an EVOS M5000 microscope (ThermoFisher Scientific). Cells were imaged at x60 objective with a brightfield phase ring with red, green, and blue combined excitation. Brightness, saturation, and contrast were adjusted to ensure iron staining was visible for RS analysis. Images were collected by tiling across slides, and RS were manually counted. A RS was defined as an erythroid cell with iron-laden mitochondria covering greater than one-third of the nuclear perimeter. Greater than 300 cells were counted for RS analysis.
RNA-sequencing
CD34+ progenitors were isolated from 5F-HPCs using the CD34 enrichment kit (Miltenyi). CD34−CD71+GlyA− proerythroblasts were isolated by flow sorting on day 4 after doxycycline removal. CD71+GlyA+ erythroblasts were isolated by flow sorting on day 9 after doxycycline removal. RNA was extracted from 3 × 10⁵ to 5 × 10⁵ cells of each population using the TRIzol reagent. Five hundred nanograms of total RNA was used as input to make poly(A)-selected RNA-sequencing (RNA-seq) libraries with the TruSeq RNA library prep kit v2 (Illumina). Libraries with DNA fragments of ∼300 bp were selected using AMPure XP bead purification. Purified libraries were sequenced on an Illumina Hi-Seq 2000 using paired-end, 50 bp reads. RNA-seq splicing analysis methods can be found in the supplement.
Lentiviral vectors
Open reading frames (ORFs) for TMEM14C, PPOX, ABCB7, and MAP3K7 were purchased from the Mission TRC3 Human LentiORF Collection and subcloned into the pSMAL overexpression vector (Addgene, Plasmid #161785). A luciferase (LUC) ORF was synthesized and subcloned into pSMAL as a control. The TRC cloning vector pLKO.1 was used to generate the ABCG2 short hairpin RNA (shRNA) vectors. Additional cloning and vector details can be found in supplemental Methods.
Quantitative reverse transcription PCR
RNA was extracted from 100 000 to 300 000 cells using TRIzol (ThermoFisher) and resuspended in water for cDNA synthesis using iScript cDNA synthesis kit (BioRad) according to manufacturer instructions. Primer details can be found in supplemental Methods.
Statistical analysis
Statistical analysis was performed with GraphPad Prism software. Data are shown as the mean with standard deviation unless noted. For all analyses, P < .05 was considered statistically significant. Investigators were not blinded to the different groups.
Additional methods in online supplement
Additional methods for RNA-seq splicing analysis, LUC assays, western blotting, proteomics, lentivirus preparation, and quantitative PCR primers can be found in supplemental Methods.
Results
iPSC model of SF3B1-mutant MDS with RS
To model MDS-RS, we derived iPSCs from CD34+ hematopoietic stem and progenitor cells from an MDS-RS patient with pathogenic SF3B1G742D/+ and EZH2R685H/+ mutations and a high percentage of RS (40% to 50% of marrow erythroblasts). Although comparatively rare in MDS-RS relative to the most common SF3B1K700E/+ mutation, the SF3B1G742D/+ mutation has been previously observed in MDS-RS patients.25,26 Following reprogramming, which can capture normal cells and clonal intermediates from individual patients, ensuring identical genetic background,23 we isolated isogenic wild-type (WT), SF3B1-mutant only, and SF3B1;EZH2-mutant iPSC lines. iPSCs were differentiated into CD34+ hematopoietic progenitor cells (HPCs) and conditionally immortalized by lentiviral delivery of 5 transcription factors (herein 5F-HPCs).27 5F-HPCs were maintained as undifferentiated CD34+ cells and induced to undergo erythroid differentiation by doxycycline removal (Figure 1A). We differentiated isogenic WT, SF3B1-mutant, and SF3B1;EZH2 5F-HPCs into erythroid cells using a 2-stage protocol that includes transferrin-bound but not exogenous iron and tracked differentiation using CD71 and CD235a/Glycophorin A (GlyA), as well as cell morphology by May-Grunwald Giemsa staining. SF3B1-mutant and WT 5F-HPCs followed similar kinetics of erythroid differentiation, with SF3B1-only cells showing slightly accelerated differentiation (supplemental Figure 1A) consistent with previous reports.28 All HPCs efficiently differentiated into late-stage CD71loGlyA+ (Figure 1B,D) polychromatic and orthochromatic erythroblasts (Figure 1C,E). At the end of differentiation, SF3B1-only cells showed a slightly increased proportion of morphologically mature orthochromatic erythroblasts (59.7%) compared with WT (36.8%) and SF3B1;EZH2 lines (38.8%) (Figure 1E). WT and SF3B1-only HPCs had comparable total erythroid cell output, whereas the output of SF3B1;EZH2 HPCs was reduced by approximately twofold (supplemental Figure 1B). To determine if iPSC-derived erythroid cells form RS, we stained cells from day 14 to 18 of culture with the Prussian Blue iron stain and evaluated RS following the clinical criteria of iron-stained mitochondria encircling greater than one-third of the nuclear perimeter. Strikingly, SF3B1-mutant but not isogenic WT erythroid cells formed high numbers of RS during terminal differentiation that were morphologically identical to primary patient RS (Figure 1F). Total RS count increased starting at day 15, coinciding with basophilic to polychromatic transition, and peaked at ∼35% on the final day, day 18, of erythroid culture (Figure 1G) when orthochromatic erythroblasts become dominant (Figure 1E). Consistent with this, morphological evaluation of iron-stained cells showed both poly- and ortho-chromatic RS, with the highest frequency at the orthochromatic stage (supplemental Figure 1C-D). These data show that iPSC-derived MDS-RS progenitors efficiently form RS in late-stage erythroblasts, the first demonstration of this phenomenon in vitro for an SF3B1-mutant cell line.
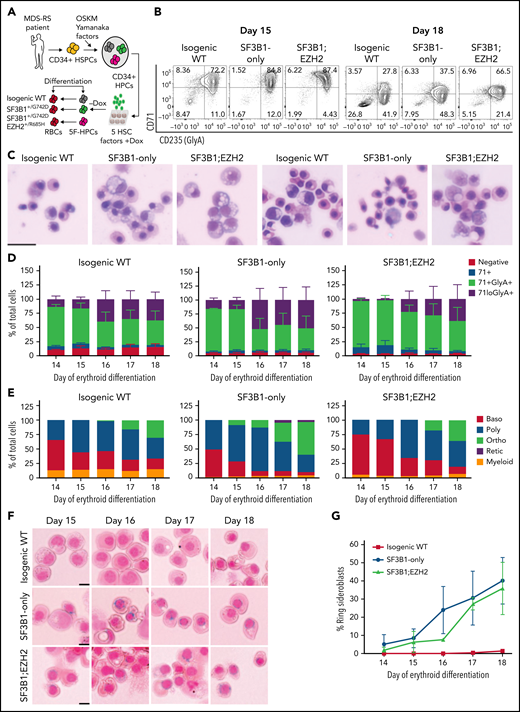
iPSC model of SF3B1-mutant MDS with RS. (A) Schematic of iPSC reprogramming to generate an SF3B1-mutant MDS-RS model. MDS-RS patient CD34+ cells were reprogrammed with episomal factors and 3 iPSC lines were selected: normal isogenic WT, SF3B1G742D/+, and SF3B1G742D/+;EZH2/R685H/+. iPSCs were differentiated into CD34+ HPCs and transduced with 5 transcription factors (ERG, HOXA9, RORA, SOX4, MYB) to establish doxycycline-expandable 5F-HPCs, which serve as progenitor lines for erythroid differentiation studies. (B) Representative flow plots of CD71 and CD235 (Glycophorin A) expression in isogenic WT, SF3B1G742D/+, and SF3B1G742D/+;EZH2R685H/+ cells on days 15 and 18 of erythroid differentiation. (C) Representative May-Grunwald Giemsa staining of erythroid cell morphology on days 15 (left 3 images) and 18 (right 3 images) of differentiation. Scale bar, 25 μm. (D) Erythroid differentiation staging using CD71 and GlyA levels measured by flow cytometry using the gating strategy shown in 1B from days 14 to 18 of erythroid differentiation; mean ± standard error of the mean of n = 3. (E) Quantification of erythroid cell morphology using May-Grunwald Giemsa staining from days 14 to 18. A representative experiment was counted; >30 cells counted for each day of differentiation. (F) Representative images of RS iron staining in SF3B1-WT and SF3B1-mutant cells. Erythroid cells were collected on days 15 through 18 of erythroid differentiation and stained with Perls Prussian blue. Scale bar, 10 μm. (G) Quantification of RS counts in the isogenic WT and SF3B1G742D/+ erythroid cells; >200 cells counted; mean ± standard deviation (SD) of n = 3 independent experiments and SF3B1G742D/+;EZH2/R685H/+ cells; mean ± SD of n = 2; >150 cells counted. Baso, basophilic erythroblast; poly, polychromatic erythroblast; ortho, orthochromatic erythroblast; retic, reticulocyte.
iPSC model of SF3B1-mutant MDS with RS. (A) Schematic of iPSC reprogramming to generate an SF3B1-mutant MDS-RS model. MDS-RS patient CD34+ cells were reprogrammed with episomal factors and 3 iPSC lines were selected: normal isogenic WT, SF3B1G742D/+, and SF3B1G742D/+;EZH2/R685H/+. iPSCs were differentiated into CD34+ HPCs and transduced with 5 transcription factors (ERG, HOXA9, RORA, SOX4, MYB) to establish doxycycline-expandable 5F-HPCs, which serve as progenitor lines for erythroid differentiation studies. (B) Representative flow plots of CD71 and CD235 (Glycophorin A) expression in isogenic WT, SF3B1G742D/+, and SF3B1G742D/+;EZH2R685H/+ cells on days 15 and 18 of erythroid differentiation. (C) Representative May-Grunwald Giemsa staining of erythroid cell morphology on days 15 (left 3 images) and 18 (right 3 images) of differentiation. Scale bar, 25 μm. (D) Erythroid differentiation staging using CD71 and GlyA levels measured by flow cytometry using the gating strategy shown in 1B from days 14 to 18 of erythroid differentiation; mean ± standard error of the mean of n = 3. (E) Quantification of erythroid cell morphology using May-Grunwald Giemsa staining from days 14 to 18. A representative experiment was counted; >30 cells counted for each day of differentiation. (F) Representative images of RS iron staining in SF3B1-WT and SF3B1-mutant cells. Erythroid cells were collected on days 15 through 18 of erythroid differentiation and stained with Perls Prussian blue. Scale bar, 10 μm. (G) Quantification of RS counts in the isogenic WT and SF3B1G742D/+ erythroid cells; >200 cells counted; mean ± standard deviation (SD) of n = 3 independent experiments and SF3B1G742D/+;EZH2/R685H/+ cells; mean ± SD of n = 2; >150 cells counted. Baso, basophilic erythroblast; poly, polychromatic erythroblast; ortho, orthochromatic erythroblast; retic, reticulocyte.
Mutant SF3B1 missplicing during iPSC erythroid differentiation
Patient bone marrow cells with SF3B1 mutations show a highly recurrent pattern of aberrant splicing marked by noncanonical usage of cryptic 3′ splice sites.3,4,13,29,30 To determine if mis-splicing in the iPSC model was concordant with splicing changes found in patient cells, we profiled global splicing patterns with deep RNA-seq on isogenic WT, SF3B1-mutant, and CD34+ 5F-HPC progenitor cells and compared with CD34+ HPCs from MDS patients with or without a SF3B1K700E/+ mutation,4,25 as well as K562 cells with or without a knock-in SF3B1K700E/+ mutation. This analysis identified thousands of misspliced transcripts in 5F-HPCs (supplemental Figure 2A-B; supplemental Table 1). Global patterns of missplicing were largely concordant between our iPSC-based models and patient CD34+ HPCs, as well as between cells with SF3B1K700E/+ and SF3B1G742D/+ mutations, suggesting that SF3B1-mutant 5F-HPCs recapitulate missplicing observed in primary MDS-RS (Figure 2A). The quantitative extent of missplicing was also modestly (r = 0.45) but significantly (P < .0001) correlated between 5F erythroblasts and K562 cells (supplemental Figure 2C). These data demonstrate the stereotyped nature of SF3B1 mutation-induced missplicing and validate iPSC-derived progenitors as a model of mutant SF3B1 biology.
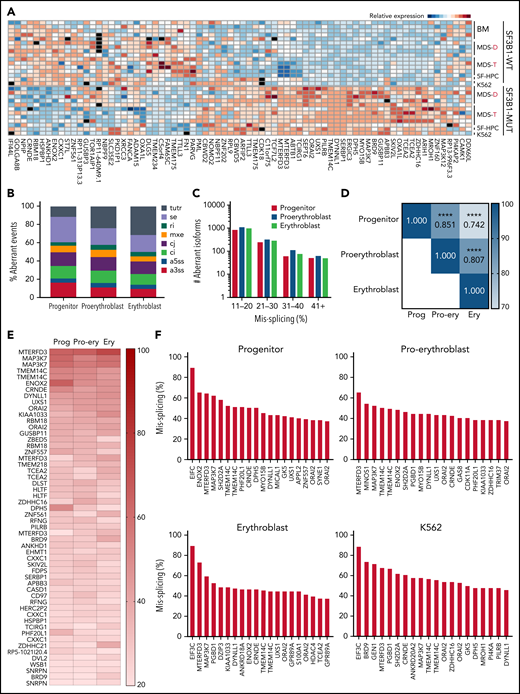
Mutant SF3B1 missplicing during iPSC erythroid differentiation. (A) Relative expression of the indicated differentially spliced isoforms in SF3B1-WT and SF3B1-mutant cells. Plot restricted to competing 3′ splice sites, cassette exons, and retained introns. Normal samples include: bone marrow HPCs (BM), MDS without SF3B1 mutations (WT), K562 cells, and normal isogenic iPSC-derived 5F-HPCs. SF3B1-mutant samples include: SF3B1-mutant MDS, K562 SF3B1K700E/+ cells, and SF3B1G742D/+ iPSC-derived 5F-HPCs. Events were restricted to ≥20% missplicing, Bayes factor ≥5, and a minimum counts cutoff ≥20. MDS-D refers to SF3B1K700E/+ patient data from Dolatshad et al4 and MDS-T refers to SF3B1K700E/+ patient data from Taylor et al.25 (B) The proportion of misspliced isoforms in 5F-HPCs: progenitor CD34+, proerythroblast CD71+GlyA−, and erythroblast CD71+GlyA+. Splicing events classified as arising from tandem 3′ UTRs (tutr), cassette or skipped exons (se), retained introns (ri), mutually exclusive exons (mxe), alternative usage of normally constitutively spliced junctions (cj), alternative retention of normally constitutively spliced introns (ci), alternative 5′ss (a5ss), and alternative 3′ss (a3ss). (C) The number of misspliced isoforms grouped by absolute value of missplicing at the 3 stages of erythroid differentiation of 5F-HPCs: progenitor CD34+, proerythroblast CD71+GlyA−, and erythroblast CD71+GlyA+. (D) Pearson correlation matrix of the level of missplicing between the 3 stages of erythroid differentiation of SF3B1G742D/+ 5F-HPCs. ****P < .0001. (E) The level of missplicing of individual gene isoforms during erythroid differentiation of SF3B1G742D/+ 5F-HPCs; included isoforms were detected at all the stages of differentiation. (F) Top 20 misspliced a3ss isoforms in SF3B1-mutant 5F-HPCs and 3 stages of erythroid cells: CD71+ proerythroblasts, CD71+GlyA+ erythroblasts, and K562s. Unless otherwise stated, for all panels, differential missplicing between SF3B1-mutant and WT cells is defined based on the absolute value of missplicing ≥20%, Bayes factor >5, and supported by >5 transcript counts. Prog, progenitor; Pro-ery, proerythroblast; Ery, erythroblast.
Mutant SF3B1 missplicing during iPSC erythroid differentiation. (A) Relative expression of the indicated differentially spliced isoforms in SF3B1-WT and SF3B1-mutant cells. Plot restricted to competing 3′ splice sites, cassette exons, and retained introns. Normal samples include: bone marrow HPCs (BM), MDS without SF3B1 mutations (WT), K562 cells, and normal isogenic iPSC-derived 5F-HPCs. SF3B1-mutant samples include: SF3B1-mutant MDS, K562 SF3B1K700E/+ cells, and SF3B1G742D/+ iPSC-derived 5F-HPCs. Events were restricted to ≥20% missplicing, Bayes factor ≥5, and a minimum counts cutoff ≥20. MDS-D refers to SF3B1K700E/+ patient data from Dolatshad et al4 and MDS-T refers to SF3B1K700E/+ patient data from Taylor et al.25 (B) The proportion of misspliced isoforms in 5F-HPCs: progenitor CD34+, proerythroblast CD71+GlyA−, and erythroblast CD71+GlyA+. Splicing events classified as arising from tandem 3′ UTRs (tutr), cassette or skipped exons (se), retained introns (ri), mutually exclusive exons (mxe), alternative usage of normally constitutively spliced junctions (cj), alternative retention of normally constitutively spliced introns (ci), alternative 5′ss (a5ss), and alternative 3′ss (a3ss). (C) The number of misspliced isoforms grouped by absolute value of missplicing at the 3 stages of erythroid differentiation of 5F-HPCs: progenitor CD34+, proerythroblast CD71+GlyA−, and erythroblast CD71+GlyA+. (D) Pearson correlation matrix of the level of missplicing between the 3 stages of erythroid differentiation of SF3B1G742D/+ 5F-HPCs. ****P < .0001. (E) The level of missplicing of individual gene isoforms during erythroid differentiation of SF3B1G742D/+ 5F-HPCs; included isoforms were detected at all the stages of differentiation. (F) Top 20 misspliced a3ss isoforms in SF3B1-mutant 5F-HPCs and 3 stages of erythroid cells: CD71+ proerythroblasts, CD71+GlyA+ erythroblasts, and K562s. Unless otherwise stated, for all panels, differential missplicing between SF3B1-mutant and WT cells is defined based on the absolute value of missplicing ≥20%, Bayes factor >5, and supported by >5 transcript counts. Prog, progenitor; Pro-ery, proerythroblast; Ery, erythroblast.
To assess missplicing changes during erythropoiesis, we profiled the transcriptomes of isogenic WT and SF3B1-mutant CD34+ progenitors, CD71+GlyA- proerythroblasts, and CD71+GlyA+ erythroblasts (Figure 2B). Although approximately 1000 transcripts were significantly misspliced at each stage of erythroid differentiation, only a small subset (<100) of genes exhibited very strong missplicing (change in isoform ratio >40%; Figure 2C). Mutant SF3B1-dependent missplicing was significantly correlated across all 3 stages of differentiation (Figure 2D-E), although some transcripts exhibited strong stage-specific differences (supplemental Figure 2D). Further restricting to a3ss isoforms, the canonical consequence of SF3B1 mutations,3 similarly showed high concordance between top misspliced genes and erythroid stages and cell types, suggesting missplicing is conserved during erythroid differentiation (Figure 2F).
Missplicing downregulates expression of SF3B1 target genes
SF3B1-mutated MDS bone marrow cells display pervasive mis-splicing of TMEM14C, PPOX, ABCB7, and MAP3K7,3,4,13,31,32 key mediators of iron and heme metabolism and SF3B1-driven pathogenesis. TMEM14C and PPOX, encoding proteins that mediate sequential steps in heme biosynthesis, were both highly misspliced in SF3B1-mutant cells and upregulated during normal erythroid differentiation (Figure 3A). Cryptic 3′ splice site usage in TMEM14C and PPOX was strongly and significantly associated with mutant SF3B1 in each system, with the added complexity of additional PPOX intron retention independent of genotype in primary MDS and K562 samples (Figure 3B; supplemental Figure 3A). ABCB7 has been proposed as a driver of RS formation in MDS.4,14,33ABCB7 was modestly misspliced in our analysis (Figure 3A), likely due to efficient degradation of the misspliced messenger RNA (mRNA) by nonsense-mediated mRNA decay.13MAP3K7 is implicated in SF3B1-mutant MDS pathogenesis32 and was highly misspliced our model. Missplicing of each of these 4 candidate genes was significantly associated with SF3B1 mutations in each model system, including 2 distinct cohorts of primary MDS samples4,25 (Figure 3B). Based on this analysis, we selected TMEM14C, PPOX, MAP3K7, and ABCB7 for functional studies of their potential roles in RS formation.
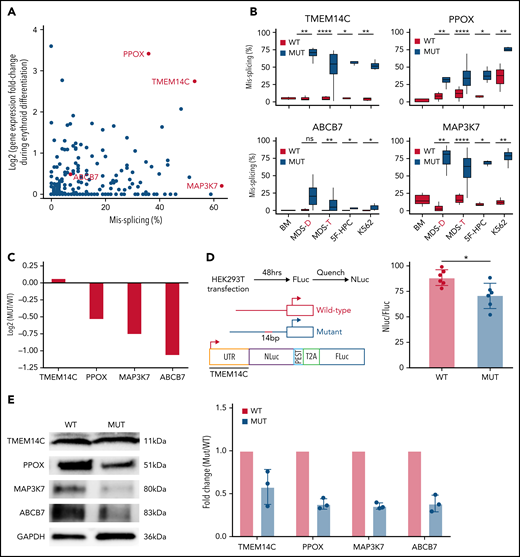
Missplicing downregulates expression of SF3B1 target genes. (A) Identification of erythroid-specific mutant SF3B1 targets based on the level of missplicing vs fold change of transcript expression during normal erythroid differentiation. Selected genes were misspliced in both SF3B1-mutant MDS patient cells and iPSC 5F-HPC derived erythroid cells. (B) Total level of missplicing of TMEM14C, PPOX, ABCB7, and MAP3K7 in normal bone marrow (BM), SF3B1-WT and mutant MDS patients, 5F-HPCs, and K562s. *P < .5, **P < .01, ***P < .001, ****P < .0001, 1-sided Mann-Whitney U test. MDS-D refers to SF3B1K700E/+ patient data from Dolatshad et al4 and MDS-T refers to SF3B1K700E/+ patient data from Taylor et al.25 (C) The change in RNA expression (log fold) by RNA-seq in SF3B1-mutant compared with isogenic WT 5F-HPC-derived erythroid cells. (D) The efficiency of LUC translation in reporter assay with WT or mutant TMEM14C 5′UTR. Left: The schematic of WT and mutant TMEM14C 5′UTR and dual LUC 5′UTR reporter design. Right: The ratio of nano-LUC to firefly LUC fluorescence with WT or mutant TMEM14C 5′UTR. N = 6 independent experiments, *P = .015, Student t test. (E) Western blot analysis of TMEM14C, PPOX, MAP3K7, and ABCB7 protein levels at day 14 of erythroid differentiation of SF3B1-mutant and isogenic WT 5F-HPC derived erythroid cells. The expression was normalized to glyceraldehyde-3-phosphate dehydrogenase and shown as fold-change of SF3B1-mutant vs WT; 3 independent experiments, mean ± SD.
Missplicing downregulates expression of SF3B1 target genes. (A) Identification of erythroid-specific mutant SF3B1 targets based on the level of missplicing vs fold change of transcript expression during normal erythroid differentiation. Selected genes were misspliced in both SF3B1-mutant MDS patient cells and iPSC 5F-HPC derived erythroid cells. (B) Total level of missplicing of TMEM14C, PPOX, ABCB7, and MAP3K7 in normal bone marrow (BM), SF3B1-WT and mutant MDS patients, 5F-HPCs, and K562s. *P < .5, **P < .01, ***P < .001, ****P < .0001, 1-sided Mann-Whitney U test. MDS-D refers to SF3B1K700E/+ patient data from Dolatshad et al4 and MDS-T refers to SF3B1K700E/+ patient data from Taylor et al.25 (C) The change in RNA expression (log fold) by RNA-seq in SF3B1-mutant compared with isogenic WT 5F-HPC-derived erythroid cells. (D) The efficiency of LUC translation in reporter assay with WT or mutant TMEM14C 5′UTR. Left: The schematic of WT and mutant TMEM14C 5′UTR and dual LUC 5′UTR reporter design. Right: The ratio of nano-LUC to firefly LUC fluorescence with WT or mutant TMEM14C 5′UTR. N = 6 independent experiments, *P = .015, Student t test. (E) Western blot analysis of TMEM14C, PPOX, MAP3K7, and ABCB7 protein levels at day 14 of erythroid differentiation of SF3B1-mutant and isogenic WT 5F-HPC derived erythroid cells. The expression was normalized to glyceraldehyde-3-phosphate dehydrogenase and shown as fold-change of SF3B1-mutant vs WT; 3 independent experiments, mean ± SD.
We next assessed the molecular consequence of each mis-splicing event. For PPOX, ABCB7, and MAP3K7, SF3B1 mutations cause cryptic 3′ splice site usage that disrupts the open reading frame; in contrast, cryptic 3′ splice site usage in TMEM14C adds 14 nucleotides to the 5′UTR without altering the protein-coding sequence (supplemental Figure 3A). Consistent with this, total RNA levels of PPOX, ABCB7, and MAP3K7 were decreased in SF3B1-mutant 5F-HPCs, whereas RNA levels of TMEM14C were unchanged (Figure 3C). As 5′UTR sequence influences translation efficiency,34 we next determined how TMEM14C 5′UTR missplicing altered protein output. We cloned the WT or mutant SF3B1–promoted (+14nt) 5′UTR into a tandem luciferase construct, which allows for accurate measurement of relative translational efficiency. The +14nt TMEM14C 5′UTR drove a moderate (20%), but highly significant (P = .015), reduction in LUC translational efficiency (Figure 3D). We therefore measured how altered TMEM14C 5′UTR usage influenced endogenous TMEM14C protein levels. We performed unbiased shotgun proteomics, which revealed decreased levels of TMEM14C, PPOX, MAP3K7, and ABCB7 proteins in 5F-HPCs (supplemental Figure 3B; supplemental Table 2). We then validated these results by probing individual proteins. Because expression of loading controls can change during differentiation, we measured protein levels in staged day-14 erythroid precursors. We raised an antibody to an N-terminal epitope of TMEM14C and found that TMEM14C protein levels were consistently reduced by an average of 40% in SF3B1-mutant cells (Figure 3E). We similarly confirmed reduced PPOX, MAP3K7, and ABCB7 protein levels in SF3B1-mutant erythroid cells (Figure 3E). Taken together, these data demonstrate that mutant SF3B1-dependent missplicing decreases expression of TMEM14C, PPOX, MAP3K7, and ABCB7 by reducing transcript stability or translation efficiency.
Rescue of TMEM14C and ABCB7 reduces RS formation
We next tested the hypothesis that missplicing of mitochondrial iron genes causes RS formation in SF3B1-mutated MDS with functional rescue experiments. SF3B1-mutant 5F-HPCs were transduced (at 60% to 90% efficiency) with individual lentiviral vectors encoding WT ORFs for TMEM14C, PPOX, ABCB7, MAP3K7, or LUC control (Figure 4A). Transduced SF3B1-mutant 5F-HPCs were differentiated for 18 days into erythroid cells. Overexpression level of each ORF was approximately twofold (Figure 4B). Overexpression of any of the ORFs did not impact the kinetics of erythroid differentiation assessed by flow cytometry and cell morphology as all conditions had ∼25% CD71loGlyA+ cells and ∼50% morphologically mature orthochromatic erythroblasts by day 18 of culture (Figure 4C-F). Cytospins were collected daily starting on day 15, when RS were first observed in untransduced cells, until day 18 (Figure 1G), and RS were quantified by staining with Perl’s Prussian blue (Figure 4G). As expected, the proportion of RS in all ORF conditions increased between days 15 and 18 (Figure 4H), with most RS observed in orthochromatic erythroblasts (supplemental Figure 4A-B). Erythroid cells transduced with control LUC ORF reached 37.3 ± 10.4% of RS (Figure 4I), similar to untransduced cells (Figure 1G). Overexpression of MAP3K7, a canonical mutant SF3B1 target with no known roles in iron metabolism, did not alter the frequency of RS (38.2 ± 9.7%) (Figure 4I). Overexpression of PPOX, not a rate limiting enzymatic step in heme synthesis, led to a modest decrease in RS formation (31.5 ± 6.9%) (Figure 4I). Strikingly, SF3B1-mutant erythroid cells overexpressing TMEM14C or ABCB7 displayed consistently lower RS formation throughout late-stage differentiation (23.84 ± 7.1% and 16.9 ± 9.8%, respectively) (Figure 4G,I). Because TMEM14C and PPOX are sequential components in heme synthesis and may display epistatic effects, we also analyzed RS in SF3B1-mutant cells transduced with a combination of TMEM14C and PPOX lentiviruses. Combined overexpression of TMEM14C and PPOX had similar RS counts compared with TMEM14C alone, suggesting that missplicing of TMEM14C but not PPOX drives RS formation (Figure 4J).
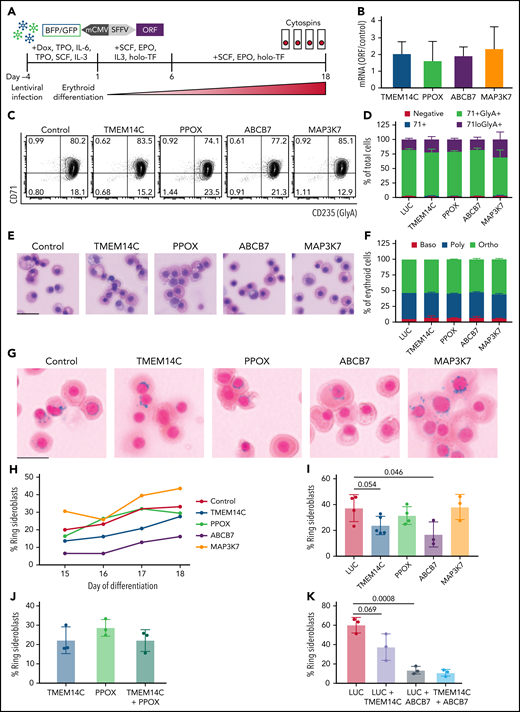
Rescue of TMEM14C and ABCB7 reduces RS formation. (A) Schematic of the functional RS rescue experiments. SF3B1-mutant 5F-HPCs were transduced with lentiviruses overexpressing individual ORFs or LUC control to 50-70% transduction efficiency. To induce differentiation, doxycycline was removed and cells were moved into erythroid differentiation media containing SCF, EPO, IL-3, and holo-TF (without exogenous iron) for 6 days prior to the removal of IL-3 from culture. Cytospins were collected between days 15 and 18 as indicated and stained for RS with Prussian blue. (B) ORF mRNA overexpression level measured by quantitative PCR and normalized to LUC control at day 15 of erythroid differentiation; mean ± SD of n = 3 independent experiments. (C) Representative CD71 and GlyA flow plots of SF3B1-mutant cells expressing each ORF or LUC control on day 18 of erythroid differentiation. CD71 and GlyA staining is indicative of the stage of erythroid differentiation. (D) Erythroid differentiation staging using CD71 and GlyA levels as measured by flow cytometry using gating strategy shown in 4C at day 18 of erythroid differentiation; mean ± SEM of n = 3. (E) Representative May-Grunwald Giemsa staining of erythroid cell morphology on day 18 of erythroid differentiation. Scale bar = 25 mm. (F) Quantification of erythroid cell morphology using May-Grunwald Giemsa staining from day 18 of erythroid differentiation; 2 independent experiments. (G) Representative cytospin images of erythroid cells expressing each ORF or LUC control stained with Prussian blue iron staining for RS quantification. Scale bar = 25 mm. (H) Quantification of RS counts in SF3B1-mutant cells expressing each ORF or LUC control over the course of days 15-18 of erythroid differentiation. Mean values are shown for each day, TMEM14C, ABCB7, LUC control n = 3 independent experiments; PPOX and MAP3K7 n = 2 independent experiments. (I) Maximum RS counts between days 15-18 of differentiation for each ORF or LUC control. Each point represents an independent experiment (n = 3 - 5 independent experiments), >500 erythroid cells counted per experiment; mean± SD. P values calculated using a t test. (J) RS counts on day 18 of erythroid differentiation for the combination of TMEM14C and PPOX, compared with TMEM14C or PPOX alone. Each point represents an independent experiment, >500 erythroid cells counted per experiment; mean± SD. (K) RS counts on day 18 of erythroid differentiation for TMEM14C and ABCB7 combination compared to LUC combinations or LUC alone in SF3B1-mutant erythroid cells. Each point represents an independent experiment (n = 3), >500 erythroid cells counted per experiment; mean ± SD. P values calculated using a t test.
Rescue of TMEM14C and ABCB7 reduces RS formation. (A) Schematic of the functional RS rescue experiments. SF3B1-mutant 5F-HPCs were transduced with lentiviruses overexpressing individual ORFs or LUC control to 50-70% transduction efficiency. To induce differentiation, doxycycline was removed and cells were moved into erythroid differentiation media containing SCF, EPO, IL-3, and holo-TF (without exogenous iron) for 6 days prior to the removal of IL-3 from culture. Cytospins were collected between days 15 and 18 as indicated and stained for RS with Prussian blue. (B) ORF mRNA overexpression level measured by quantitative PCR and normalized to LUC control at day 15 of erythroid differentiation; mean ± SD of n = 3 independent experiments. (C) Representative CD71 and GlyA flow plots of SF3B1-mutant cells expressing each ORF or LUC control on day 18 of erythroid differentiation. CD71 and GlyA staining is indicative of the stage of erythroid differentiation. (D) Erythroid differentiation staging using CD71 and GlyA levels as measured by flow cytometry using gating strategy shown in 4C at day 18 of erythroid differentiation; mean ± SEM of n = 3. (E) Representative May-Grunwald Giemsa staining of erythroid cell morphology on day 18 of erythroid differentiation. Scale bar = 25 mm. (F) Quantification of erythroid cell morphology using May-Grunwald Giemsa staining from day 18 of erythroid differentiation; 2 independent experiments. (G) Representative cytospin images of erythroid cells expressing each ORF or LUC control stained with Prussian blue iron staining for RS quantification. Scale bar = 25 mm. (H) Quantification of RS counts in SF3B1-mutant cells expressing each ORF or LUC control over the course of days 15-18 of erythroid differentiation. Mean values are shown for each day, TMEM14C, ABCB7, LUC control n = 3 independent experiments; PPOX and MAP3K7 n = 2 independent experiments. (I) Maximum RS counts between days 15-18 of differentiation for each ORF or LUC control. Each point represents an independent experiment (n = 3 - 5 independent experiments), >500 erythroid cells counted per experiment; mean± SD. P values calculated using a t test. (J) RS counts on day 18 of erythroid differentiation for the combination of TMEM14C and PPOX, compared with TMEM14C or PPOX alone. Each point represents an independent experiment, >500 erythroid cells counted per experiment; mean± SD. (K) RS counts on day 18 of erythroid differentiation for TMEM14C and ABCB7 combination compared to LUC combinations or LUC alone in SF3B1-mutant erythroid cells. Each point represents an independent experiment (n = 3), >500 erythroid cells counted per experiment; mean ± SD. P values calculated using a t test.
TMEM14C is an inner mitochondrial protein that transports protoporphyrinogen IX into the mitochondrial matrix, where PPOX converts it to protoporphyrin IX (PPIX) for heme synthesis.35 Consistently, SF3B1-mutant erythroid cells transduced with TMEM14C or PPOX exhibited a small increase in PPIX fluorescence (supplemental Figure 4C-D). We tested if increasing PPIX availability by blocking the nonspecific efflux pump ABCG2,36 not predicted to be misspliced by SF3B1, could rescue RS formation. Cells transduced with an shRNA targeting ABCG2 with ∼65% knockdown showed a small increase in PPIX fluorescence and ∼60% reduction in RS counts compared with an shRNA control, with no change in erythroid differentiation (supplemental Figure 4E-I). These data suggest that overexpression of TMEM14C may partially rescue RS formation by increasing the porphyrin pool available for heme synthesis.
Because rescue of TMEM14C and ABCB7 each partially rescued RS formation, we next assessed whether combinatorial rescue would further reduce RS. To test this, we cotransduced 5F-HPCs with dual fluorescent ORF lentiviruses and purified double-transduced GlyA+ erythroid precursors by flow sorting on day 10 of erythroid differentiation. Control double-transduced sorted erythroid cells had higher baseline RS formation (60.1 ± 4.6%) compared with unsorted cells (37.3 ± 10.4%) (Figure 4I,K). Overexpression of TMEM14C or ABCB7 alone reduced percent RS compared with LUC control, with ABCB7 showing significantly stronger rescue compared with TMEM14C (13.4 ± 2.3% and 37.4 ± 7.9%, respectively) (Figure 4K), as seen with unsorted cells. Combined rescue of both TMEM14C and ABCB7 showed the highest reduction in RS counts (10.8 ± 2%) but was not significantly different compared with ABCB7 alone (Figure 4K), demonstrating that ABCB7 is the major driver of RS formation. Taken together, these data show that mutant SF3B1-dependent missplicing mimics ISAs by converging upon key mitochondrial iron pathways to drive RS formation in MDS.
Discussion
Mutations in splicing factor SF3B1 lead to pervasive missplicing of mitochondrial iron metabolic genes TMEM14C, PPOX, and ABCB7.3,4,13,31,37 Missplicing of ABCB7, the causative gene for XLSA with ataxia, and heme synthesis genes has been proposed to drive RS formation in SF3B1-mutant MDS.4,15,31 However, these hypotheses have not been tested due to lack of physiological model systems of RS formation. Here, we develop a patient-derived iPSC model of SF3B1-mutant MDS which recapitulates global missplicing observed in primary MDS-RS cells and for the first time efficiently gives rise to RS in vitro. In our model, RS formation starts at the polychromatic stage and intensifies in orthochromatic erythroblasts, possibly reflecting a perinuclear distribution of mitochondria in late-stage erythroblasts.38 We demonstrate that reduced expression due to missplicing of mitochondrial transporters TMEM14C and ABCB7 causes RS formation. Our findings explain the remarkably strong clinical association between SF3B1 mutations and RS in MDS.
Inherited sideroblastic anemias are caused by mutations in key mitochondrial pathways, such as heme synthesis, mitochondrial DNA replication, and Fe-S cluster biogenesis.1,39 ABCB7, the only known mitochondrial Fe-S exporter,40 is mutated in XLSA with ataxia,9 and its missplicing has been considered a candidate driver of RS formation in MDS. Boultwood et al first reported decreased ABCB7 expression in MDS-RS.37 Dolatshad et al showed that missplicing of ABCB7, due to usage of an alternative 3′ splice site, occurs in the HSPCs and erythroblasts of MDS patients with SF3B1 mutations.4 ABCB7 downregulation induced mitochondrial ferritin and reduced erythroid colony capacity in normal bone marrow cells, whereas its overexpression partially rescued erythroid defects of MDS-RS precursors.15 Our functional rescue studies confirm the long-standing hypothesis that missplicing and reduced expression of ABCB7 is the major driver of RS formation in SF3B1-mutant MDS.
TMEM14C and PPOX are the only heme pathway components misspliced in MDS-RS patients, although their role has been less clear.4,12,13 Unlike ABCB7 or PPOX in which missplicing disrupts the coding sequence, missplicing occurs in the 5′UTR of TMEM14C. Missplicing within the 5′UTR is pervasive in SF3B1-mutant cells, although the functional consequences of these events are less clear. Although previous studies have not detected a change in TMEM14C expression in SF3B1-mutant cells,13 we show that TMEM14C missplicing reduces translation efficiency and total protein. Our functional rescue studies show that TMEM14C, but not PPOX, reduces RS formation. TMEM14C imports protoporphyrinogen IX, which is oxidized by PPOX into porphyrin.35 However, PPOX is not rate limiting, and inherited PPOX mutations cause hepatic but not erythroid porphyria.41 Independently increasing porphyrin levels via knockdown of ABCG2, a nonspecific PPIX efflux pump, also reduced RS counts, suggesting that TMEM14C regulates the porphyrin pool. More refined measurements of PPIX and other heme pathway intermediates are needed to confirm this hypothesis.
Iron imported into mitochondria is rapidly incorporated into heme or Fe-S.7 In our model, missplicing of TMEM14C and ABCB7 perturbs both branches of this pathway, resulting in excess iron. ABCB7 exports an unidentified cytosolic-specific Fe-S precursor.40 Fe-S availability modulates heme synthesis through the regulation of ALAS2,42 ALAD,43 and FECH.44 Because Fe-S clusters are required for activation of FECH,44 the terminal rate-limiting step of heme synthesis, loss of ABCB7 may impact both heme and Fe-S pathways. Accordingly, combined rescue of TMEM14C and ABCB7 reduces RS by more than sixfold, but is not significantly lower than ABCB7 alone, suggesting an epistatic relationship. Rescue of TMEM14C and ABCB7 does not completely abolish RS formation, suggesting that other misspliced genes may play a role. Mutations or deletions of mitochondrial DNA have been implicated in ISAs,39 and we find that MTERFD3, required for mitochondrial DNA replication,45 is highly misspliced in mutant SF3B1 cells. Taken together, our findings demonstrate that TMEM14C and ABCB7 are the major drivers of RS formation in MDS.
SF3B1 mutations are prevalent in cancers, and downstream targets remain poorly characterized. Because missplicing often has modest effects on protein levels or function, oncogenic phenotypes are likely driven by cooperative effects of multiple misspliced target genes. We show that RS formation is the result of combinatorial missplicing of TMEM14C and ABCB7 that perturbs both heme and Fe-S pathways. Our study thus highlights the paradigm that combined missplicing of multiple cooperating genes leads to cancer-associated phenotypes.
Acknowledgments
The authors thank Sioban B. Keel (UW Hematology) and Lorinda Soma (UW Laboratory Medicine) for assistance with RS stains and analysis. Chenwei Lin (Fred Hutch Proteomics Core), Xiaoping Wu (Pathology Flow Core), and Nathaniel Peters (Keck Imaging Center) provided technical assistance.
S.D. and R.K.B. were supported in part by the National Institutes of Health (NIH) National Heart, Blood, and Lung Institute (NHLBI) (grant R01 HL151651) and Edward P. Evans Foundation. S.D. was supported in part by the NIH New Innovator Award (DP2 HL147126), NIH NHLBI (grant R21 HL139864), Wayne D. Kuni and Joan E. Kuni Foundation, and American Society of Hematology Scholar Award. R.K.B. was supported in part by the NIH National Cancer Institute (grant R01 CA251138), NIH NHLBI (grant R01 HL128239), NIH National Institute of Diabetes and Digestive and Kidney Diseases (grant R01 DK103854), and Blood Cancer Discoveries Grant program through the Leukemia & Lymphoma Society, Mark Foundation for Cancer Research, and Paul G. Allen Frontiers Group (8023-20). R.K.B. is a Scholar of the Leukemia & Lymphoma Society (1344-18) and holds the McIlwain Family Endowed Chair in Data Science. Computational studies were supported in part by Fred Hutchinson Cancer Research Center’s Scientific Computing Infrastructure (Office of Research Infrastructure Programs grant S10 OD028685). This research was supported in part by the NIH NCI (Cancer Center Support Grant P30 CA015704) and Seattle Translational Tumor Research grant. E.K. is supported by The National Research Foundation of Korea (NRF) grant funded by the Korean government (NRF-2018R1A6A1A03025810 and NRF-2020R1A2C2012878). C.A.C. is supported by the Institute for Stem Cell and Regenerative Medicine fellowship.
Authorship
Contribution: C.A.C., O.A.-W., J.L.A., R.K.B., and S.D. designed the study; C.A.C., J.P., M.S., J.O.I., K.N., R.B., J.N., P.N., and E.K. performed experiments; C.A.C., J.P., M.S., J.O.I., R.K.B., M.C.S., A.R.S., and S.D. analyzed and interpreted data; D.L.S. and J.L.A. provided clinical samples and clinical history; C.A.C., S.D., and R.K.B. wrote the manuscript.
Conflict-of-interest disclosure: The authors declare no competing financial interests.
Correspondence: Sergei Doulatov, 1710 NE Pacific Street, Health Sciences Box 357710 Seattle, WA 98195; e-mail: doulatov@uw.edu; and Robert K. Bradley, 1100 Fairview Ave N, Seattle, WA 98109; e-mail: rbradley@fredhutch.org
RNA-sequencing data are available in GEO under accession number GSE189546. For other data not publicly uploaded, please contact the corresponding authors for access.
The online version of this article contains a data supplement.
There is a Blood Commentary on this article in this issue.
The publication costs of this article were defrayed in part by page charge payment. Therefore, and solely to indicate this fact, this article is hereby marked “advertisement” in accordance with 18 USC section 1734.

This feature is available to Subscribers Only
Sign In or Create an Account Close Modal