

Key Points
Asymmetric inheritance of lysosomes and mitochondria predicts future human blood stem cell daughter behavior and marker expression.
The asymmetric inheritance of multiple organelles is a coordinated process.

Abstract
Understanding human hematopoietic stem cell fate control is important for its improved therapeutic manipulation. Asymmetric cell division, the asymmetric inheritance of factors during division instructing future daughter cell fates, was recently described in mouse blood stem cells. In human blood stem cells, the possible existence of asymmetric cell division remained unclear because of technical challenges in its direct observation. Here, we use long-term quantitative single-cell imaging to show that lysosomes and active mitochondria are asymmetrically inherited in human blood stem cells and that their inheritance is a coordinated, nonrandom process. Furthermore, multiple additional organelles, including autophagosomes, mitophagosomes, autolysosomes, and recycling endosomes, show preferential asymmetric cosegregation with lysosomes. Importantly, asymmetric lysosomal inheritance predicts future asymmetric daughter cell-cycle length, differentiation, and stem cell marker expression, whereas asymmetric inheritance of active mitochondria correlates with daughter metabolic activity. Hence, human hematopoietic stem cell fates are regulated by asymmetric cell division, with both mechanistic evolutionary conservation and differences to the mouse system.
Introduction
The mechanisms regulating human hematopoietic stem cell (hHSC) fates in vivo or in vitro remain poorly understood. Although HSC daughter cells can acquire the same or different fates, the underlying reasons for these decisions remain unclear. Cell fates can be regulated either after cell division (eg, by signals from their environment and intracellular processes) or during mitosis by asymmetric cell division (ACD). During ACD, asymmetric inheritance of cell fate determinants instructs specific later daughter cell fates such as activation, differentiation, lineage choice, metabolism, and cell death. ACD and postmitotic mechanisms are not mutually exclusive and interact to regulate cell fates. Asymmetric daughter cell fates can thus also be observed without ACD. This makes the identification of ACD and its underlying mechanisms difficult and requires the simultaneous quantification of ACD marker levels, inheritance, and future daughter cell fates long after division. It was recently demonstrated that both the lysosomal degradative machinery1 and mitochondria1,2 can be asymmetrically inherited during mouse HSC divisions. The asymmetric inheritance of lysosomes was linked to future metabolic and mitochondrial activity, demonstrating functionally relevant ACD.1 Indeed, cellular organelles, such as mitochondria and lysosomes, are recently emerging as central organizers of many important cellular functions.2-5
ACD is speculated to also control hHSC fates.6-9 In surrogate progenitor populations with hHSC purities <1%, either asymmetric daughter fates long after mitosis or asymmetric inheritance, respectively, was used to suggest hHSC ACD. Asymmetric inheritance of CD53,10 CD63,10 CD71,10 CD62L,10 CD133,11 and Myosin IIB12 was suggested, with Görgens et al11 providing the most adequate analyses technically possible at the time. It is now becoming clear that asymmetric inheritance of factors and differential marker expression, respectively, seem to be the norms rather than the exceptions.1,5 However, most of these studies suffered from various technical pitfalls13,14 and/or the lack of a link to future daughter fates.14-16 Importantly, connecting asymmetric inheritance to differential daughter cell fates is a crucial prerequisite to demonstrate functionally relevant ACD.5,15-20 Definitive evidence for ACD thus is still outstanding for hHSCs and more mature human hematopoietic progenitor cells.11
Here, we demonstrate that asymmetric inheritance of hHSC components correlates with specific future daughter fates, proving the existence of ACD in human HSCs.1,5,14-16,21
Methods
Ethical statement
Anonymized human cord blood samples were collected from healthy newborns of both sexes at the University Hospital Basel or Zurich (Department of Obstetrics, University Hospital Zurich and Triemli Hospital, Zurich). All relevant ethical regulations were taken into account, and the study was conducted according to the guidelines of the local Basel ethics committees (vote 13/2007V, S-112/2010, EKNZ2015/335), or with approval by the ethics boards of the Canton Zurich (KEK StV-Nr. 40/14) and with parent written informed consent.
Fluorescence-activated cell sorting
All cells were sorted directly into a sterile 1.5 mL Eppendorf tube containing medium using a BD FACSAria III (see supplemental Table 2 for optical configuration). Sorts were done using a 100 µm nozzle with PBS as sheath fluid (settings: frequency 30). Prior to all sorts the machine was cleaned for 30 minutes with 2% H2O2, calibrated using Accudrop beads, and aligned. OneComp eBeads (Thermo Fisher) were used for compensation and Fluorescent Minus One (FMO) control CD34+ cells were used to set gates and exclude dead cells based on 7-aminoactinomycin (7-AAD) staining. Debris and doublets were excluded based on gating on forward (FSC) and side scatter (SSC) (see supplemental Figure 1A).
Hematopoietic stem and progenitor cell isolation
Cord blood cells were processed by density gradient centrifugation, and CD34+ cells were isolated using EasySep CD34 positive selection kit II (samples from Basel, catalog no. 17896, Stemcell Technologies, Vancouver, BC, Canada) or positive immunomagnetic selection with anti-human CD34 microbeads (samples from Zurich, Miltenyi Biotec, Germany) and frozen. Before fluorescence-activated cell sorting (FACS), they were thawed, resuspended in prewarmed FACS buffer (PBS; 2% fetal calf serum [FCS], 1 mM EDTA), and stained with antibodies against CD34-AF488 (BioLegend, 561), CD38-PE-Cy7 (BioLegend, HB71), CD90-APC (BioLegend, 5E10), CD45RA-BV650 (BioLegend, HI100), CD49f-PECy5 (BD Biosciences, GoH3) for 30 minutes on ice (see supplemental Table 1 for list of all antibodies). Cells were then washed, resuspended in FACS buffer with 1 µg/mL 7-AAD, and sorted using a BD FACSAria III (for optical configuration, see supplemental Table 2) with 100 µm nozzle, single-cell purity mode, and sorting purities ≥98%. Gates and thresholds were set according to FMO controls as depicted in supplemental Figure 1A.
Hematopoietic cell cultures
HSPCs were cultured as described.22 Briefly, phenol red free Iscove‘s Modified Dulbecco‘s Medium (IMDM, Gibco #21056-023) supplemented with 20% BIT (Stemcell Technologies), 100 ng/mL human recombinant stem cell factor (SCF, #255-SC), 50 ng/mL human recombinant Thrombopoietin (TPO, #288-TP), 100 ng/mL human Fms-related tyrosine kinase 3 ligand (FLT3L, #308-FK, all R&D Systems), 2 mM L-GlutaMAX (Gibco #35050-038), 100 U/mL penicillin and 100 g/mL streptomycin (Gibco #15140-122), 4 µg/mL low-density lipoprotein (Stemcell Technologies #02698), 55 µM 2-mercaptoethanol (Gibco), with or without 100 nM UM171 (Cat# 72912, Stemcell Technologies) was used with directly conjugated live “in-culture” antibodies23 or fluorescence probes for quantitative image cytometry: 20 ng/mL α-CD33-BV480 (BD, WM53), 40 ng/mL α-CD201-PE (BioLegend, RCR-401), 20 ng/mL α-CD71-AF488 (29806), 5 ng/mL α-CD71-APC (CY1G4), 40 ng/mL α-CD49c-PE (BioLegend, ASC-1), 25 ng/mL α-CD34-AF488/PE (561, BioLegend), TMRM (Thermo Fisher, 50 nM), LysoBrite Green, or LysoBriteNIR (AAT-Bioquest, 100 nM).
Immunofluorescence
Cells were fixed on µ-Slide VI0.4 slides (#80606, Ibidi GmbH) coated for 1 hour with 10 µg/mL α-CD43 biotin (MEM-59, ExBio) in PBS with 4% p-formaldehyde (Sigma), permeabilized with 0.1% Triton-X (Applichem), blocked for 90 minutes in 10% donkey serum (Jackson ImmunoResearch) in PBS, and stained with antibodies. Then, 1 µg/mL α-LC3β (H-50, Santa Cruz) and 0.4 µg/mL α-Rab11 (D4F5, Cell Signaling) were incubated in blocking buffer overnight at 4°C. After 3 washing steps (5-15 minutes incubation between each step), 6.67 µg/mL donkey α-rabbit-Alexa 555 or Alexa 488 IgG HL was added, incubated for 3.5 h at room temperature and washed 4 times. Then, 2 µg/mL α-LAMP1-BV421 (H4A3, BD Biosciences) and 0.5 µg/mL CD71-PE (CY1G4, BioLegend) were incubated for 3.5 hours at room temperature, and 2.5 µg/mL α-TOMM20-Alexa488 (EPR15581, Abcam) was incubated overnight at 4°C. To identify mitotic cells, the samples were stained with 200 ng/mL anti-α-tubulin-Alexa 647 (11H10, Cell Signaling) for 1 hour at room temperature (see supplemental Table 1 for list of all antibodies). Cells were imaged within 72 hours after staining.
Images were acquired on a Nikon A1 microscope using a CFI Plan Apo λ 100× oil objective (NA 1.45). Fluorescence signals of each daughter cell were quantified after background subtraction based on secondary antibody only controls and manual segmentation using Nikon NIS-Elements AR 5.02.
Colocalization analysis
Image analysis was done using NIS-Elements AR (Version 4.5 and 5.02). Background was subtracted based on secondary only controls using “Subtract constant” image arithmetic operation of NIS-Elements and the images denoised by using a 3×3 Gaussian kernel and subtracting an arbitrary voxel intensity of 100. Sister cells were segmented using NIS binary editor by drawing regions of interest (ROI) based on α-Tubulin staining. Next, images were segmented on LAMP1, TOMM20, and LC3β to create channel-specific binary masks. Intersections of these masks were then used to create LAMP1/TOMM20, LAMP1/LC3β and TOMM20/LC3β and LAMP1/LC3β/TOMM20 binary masks. Using these masks, the total fluorescence intensities and number of voxels (= 3D volume) were quantified per sister cells and analyzed using R. Quality of acquired images was manually curated and image-stacks with fluorescent debris/aggregates or cells touching the image border were excluded from analysis.
The total number of voxels per sister cells was used to analyze the coinheritance of the indicated organelles during division. The LAMP1 volume was used to define the lysosome high and low sister cell (#1 and #2). The percentage of the above mentioned intersection volumes received by each sister cell was calculated.
Time-lapse imaging
Time-lapse experiments were conducted using a Nikon-Ti Eclipse equipped with a linear encoded motorized stage, Orca Flash 4.0 V2 (Hamamatsu), and Spectra X fluorescent light source (Lumencor). White light emitted by Spectra X was collimated and used as a transmitted light for bright field illumination via a custom made motorized mirror controlled by Arduino UNO Rev3 (Arduino). Experiments were done at 37°C, 5% O2, 5% CO2 using the environmental control unit “The Cube” (Life Imaging Services), stage top incubators, and humidifier to prevent evaporation. Fluorescent images were acquired using optimized filter sets: CFP (436/20; 455LP; 480/40), eGFP (470/40; 495LP; 525/50), mKO2 (546/10; 560LP; 577/25), mCherry (550/32; 585LP; 605/15), Cy5 (620/60; 660LP; 700/75; all AHF) to detect BV480, LysoBriteGreen/AlexaFluor488, PE, TMRM, LysoBriteNIR/APC, respectively. Time intervals of bright field and fluorescent image acquisition were chosen to minimize phototoxicity. Images were acquired using 10 × CFI Plan Apochromat λ objective (NA 0.45). Single-cell tracking and image quantification were performed using self written software as described.24-28
Image quantification and analyses
Acquired 16-bit images with 2048 × 2048 pixel resolution were saved as .png and linearly transformed to 8-bit using channel optimized white points prior to analysis. Bright-field images were used for segmentation using fastER.26 Trained labeling masks were subsequently dilated (settings: dilation 6) to ensure proper segmentation and quantification of the entire cell in all fluorescence channels. Tracking and quantification of fluorescence channels were done as described26 and analyzed using Matlab 2019b (Mathworks) and R (Version 3.5.3).
Statistical analyses
No statistical methods were used to predetermine sample size. The experiments were not randomized, and the investigators were not blinded to allocation during experiments and outcome assessment. Unless otherwise stated, all experiments were repeated as independent replicates ≥3 times. All statistical tests used were two-sided. Unless stated differently data were analyzed using a two-tailed Mann-Whitney U test. Mean ± standard error of the mean (SEM) is displayed using GraphPad Prism 8, R (3.41) and Matlab 2019b (Mathworks). Box plot elements are defined as: center line, median; box limits, upper and lower quartiles; Tukey‘s 1.5× interquartile range; points, outlier. Significance levels were as follows: *P < 0.05; **P < 0.01; ***P < 0.001.
Code availability
Software used for data acquisition of immunostainings and time-lapse imaging is commercially available (NIS-Elements 5.0.2) or published and open-sourced (YouScope v.2.1; http://langmo.github.io/youscope/). Software for single-cell tracking and fluorescence quantification used in this study is published and open-sourced (https://doi.org/10.1038/nbt.3626). Software used for image segmentation is published and open-sourced (https://academic.oup.com/bioinformatics/article/33/13/2020/3045025). Software used for dimensionality reduction using Uniform Manifold Approximation and Projection (UMAP) is published and open-sourced (https://github.com/lmcinnes/umap.git). All code is available from the corresponding author on reasonable request.
Results
To determine whether ACD controls hHSC daughter fates, we used improved HSC enrichment of the CD34+CD38−CD45RA−CD90+CD49f+ phenotype (CD49fHSCs) containing ∼10% functional hHSCs with >6 months of long-term repopulating activity29 (supplemental Figure 1A). We quantified the relative difference (“SisterRatio”) of inherited lysosomes (detected by LysoBrite), activated mitochondria (by TMRM), and CD33, CD201, CD71, CD49c, and CD34 (by fluorescent antibodies) during CD49fHSC in vitro divisions using long-term, single-cell time-lapse imaging1,22,26-28,30-35 (Figure 1A-D). CD34highCD71low expression enriches (although to low purity) hHSCs with long-term repopulation potential.36 CD33,37 CD201,38 and CD49c39 were recently described to further enrich for functional hHSCs. Importantly, CD201 and CD49c identify hHSCs also after culture, whereas most other markers lose validity for hHSC identification in culture.38 CD34 and CD49c (Integrin α3) modulate cell adhesion,40 CD71 (Transferrin receptor) correlates with proliferation and metabolic activation,1,36 and CD201 (EPCR) regulates inflammation and reactive oxygen detoxification.41
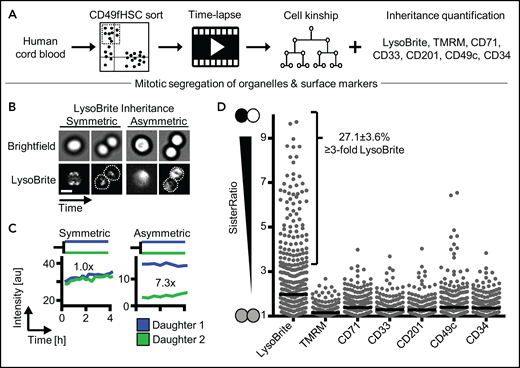
Asymmetric inheritance of lysosomes and cell fate markers in human CD49fHSCs divisions. (A) Experimental design. (B) Representative video frames of dividing CD49fHSCs (quantification displayed in panel C) with symmetric and asymmetric LysoBrite inheritance. Scale bar: 10 μm. (C) Representative LysoBrite fluorescence intensity quantification over time of CD49fHSC daughter cells for a-/symmetric inheritance. Fold sister differences early (up to 60 minutes) after division are indicated, respectively. (D) Quantification of sister ratios directly after division. LysoBrite sister cell ratios are higher than for CD33, CD201, CD71, TMRM, CD49c, and CD34. LysoBrite sister cell ratios >3× and <1.5× were considered as a-/symmetric, respectively. n = 5 independent experiments for LysoBrite, CD33, CD201, CD71, and CD49c. n = 4 for CD34 and TMRM with 426, 260, 260, 166. 166, 207, and 211 CD49fHSC divisions analyzed for LysoBrite, TMRM, CD71, CD33, CD201, CD49c, and CD34, respectively.
Asymmetric inheritance of lysosomes and cell fate markers in human CD49fHSCs divisions. (A) Experimental design. (B) Representative video frames of dividing CD49fHSCs (quantification displayed in panel C) with symmetric and asymmetric LysoBrite inheritance. Scale bar: 10 μm. (C) Representative LysoBrite fluorescence intensity quantification over time of CD49fHSC daughter cells for a-/symmetric inheritance. Fold sister differences early (up to 60 minutes) after division are indicated, respectively. (D) Quantification of sister ratios directly after division. LysoBrite sister cell ratios are higher than for CD33, CD201, CD71, TMRM, CD49c, and CD34. LysoBrite sister cell ratios >3× and <1.5× were considered as a-/symmetric, respectively. n = 5 independent experiments for LysoBrite, CD33, CD201, CD71, and CD49c. n = 4 for CD34 and TMRM with 426, 260, 260, 166. 166, 207, and 211 CD49fHSC divisions analyzed for LysoBrite, TMRM, CD71, CD33, CD201, CD49c, and CD34, respectively.
Coordinated asymmetric segregation of lysosomes, mitophagosomes, and mitochondria
We found asymmetric mitotic segregation for different markers, with lysosomes showing the most pronounced asymmetry (Figure 1B-D; supplemental Videos 1 and 2) exceeding a threefold difference in LysoBrite inheritance between daughter cells in 27.1 ± 3.6% CD49fHSC divisions (Figure 1D). Importantly, ratiometric quantifications depend on used markers, fluorochromes, and imaging modalities. Thresholds for asymmetric inheritance therefore have to be individually adjusted and validated for all markers, and lower SisterRatios of other markers could also influence later cell fate acquisition (supplemental Figure 1B-F).
To test whether other components of the lysosomal degradative machinery are also asymmetrically inherited, we used high-resolution 3D imaging and stained fixed mitotic CD34+ cells with markers for lysosomes (LAMP1), autophagosomes (LC3β), and mitochondria (TOMM20) to identify mitophagosomes and autolysosomes loaded with mitochondria destined for degradation1 (supplemental Figure 1G-J). Autophagosomes (LC3β+TOMM20−LAMP1−), mitophagosomes (LC3β+TOMM20+LAMP1−), and autolysosomes (LC3β+TOMM20+LAMP1+) were indeed co-inherited into daughter cells receiving more lysosomes (LysoHigh), whereas mitochondria (LC3β−TOMM20+LAMP1−) outside of the degradative machinery were inherited into opposite daughters receiving fewer lysosomes (LysoLow) (supplemental Figure 1H,J). Asymmetric inheritance of the degradative machinery1 and mitochondria2,42 is thus conserved from adult mouse bone marrow to human umbilical cord HSCs. In addition, we now further show that lysosomes and nondegrading mitochondria are preferentially inherited into opposite daughter cells. To confirm this, we imaged the inheritance of both organelles in living CD49fHSCs (supplemental Figure 2A-D). Similar to fixed samples, active mitochondria (as detected by TMRM) can asymmetrically segregate and are predominantly (59.6 ± 3.4%) inherited by LysoLow daughters (supplemental Figure 2A-D). Although evidence of HSC fate control by organelle inheritance is mounting,1,2,42 the involved mechanisms of organelle inheritance remain unclear. It could be a coordinated process, or stochastic as previously suggested for lysosomes in cell lines.43 If stochastic, lysosomes and TMRM should be inherited with equal frequencies into the same daughter cells. However, lysosomes and TMRM are co-inherited in only 16.2 ± 6.6%, whereas anti-inherited in 59.6 ± 3.4% of CD49fHSC divisions with asymmetric lysosome inheritance (supplemental Figure 2D). The inheritance of lysosomes and/or active mitochondria thus is not a purely stochastic process and is at least in part coordinated.
Cell-surface markers like CD71 were described to be asymmetrically inherited in fixed CD34+ human hematopoietic progenitors10 and asymmetrically regulated in mouse HSC daughters.1 We thus examined the inheritance of CD71 and other hHSC markers (CD34, CD201, CD33, and CD49c) in living CD49fHSCs (supplemental Figure 2E-G). CD71 can also be asymmetrically inherited during CD49fHSC divisions and asymmetrically segregating CD71 is localized on the cell’s inside, rather than on the surface (supplemental Figure 2F). This observation is in line with reports in fixed CD34+ progenitors, showing that only endosomal, but not cell surface CD71 is asymmetrically inherited.10 CD34, CD33, CD201, and CD49c were also partially localized inside the cell and were co-inherited into LysoHigh daughters also receiving more CD71 (supplemental Figure 2F-G). CD71 is reported to colocalize with recycling endosomes,44,45 suggesting that endosomes are asymmetrically inherited during CD49fHSC divisions and serve as a platform for the asymmetric inheritance of many cell surface proteins.
High-resolution 3D confocal analysis showed that CD71 indeed colocalizes more with the recycling endosomal marker Rab11 than with LAMP1+ lysosomes (supplemental Figure 2H-J), and Rab11 and CD71 are both asymmetrically co-inherited with lysosomes in fixed mitotic CD34+ cells (supplemental Figure 2K-M).
We further controlled for the possibility that the addition of live “in-culture” fluorescent antibodies in time-lapse movies of CD49fHSCs might influence the localization and inheritance of surface markers by for instance antibody internalization and accumulation in autolysosomes. Using CD71 as an example, we cultured CD34+ progenitors with or without α-CD71-APC and then stained fixed mitotic cells with α-CD71-PE. If asymmetric CD71 inheritance would solely be caused by accumulation of internalized α-CD71 in autolysosomes over time, intracellular CD71 labeling and CD71 sister cell differences should be higher in cells labeled by live “in-culture” antibody staining. However, we found that overall CD71 staining and sister cell ratios are not affected by the presence of α-CD71 antibody in culture before fixation (supplemental Figure 3A-C). Thus, asymmetric co-inheritance of lysosomes and CD71 during live-cell imaging is not exclusively caused by the accumulation of internalized antibodies in autolysosomes. Taken together, these data demonstrate that CD71+ recycling endosomes and lysosomes are asymmetrically co-inherited into the same daughter cell.
Asymmetric lysosomal inheritance predicts future asymmetric CD49fHSC daughter cell marker expression and behaviors
So far, we demonstrated coordinated asymmetric inheritance of different markers during CD49fHSC divisions. Next, we quantified daughter cell expression dynamics of CD33, CD201, CD71, TMRM, CD49c, and CD34 as early markers of CD49fHSC fate changes (Figure 2A-B). Clustering of paired daughter time series showed asymmetric (cluster 1), weakly asymmetric (cluster 2), and symmetric (cluster 3) paired daughter cell expression dynamics for all tested markers at varying frequencies as determined by the average paired-daughter cell difference per cluster. Heterogeneity in marker expression levels in paired CD49fHSC daughter cells thus is common but does not in itself provide evidence for ACD because it could stem from mechanisms independent of mitosis.1,6,14,21,46
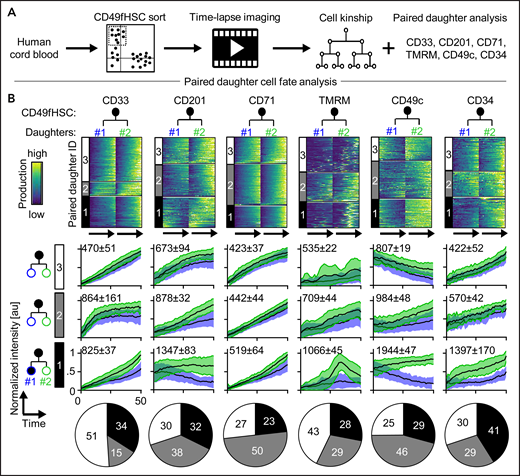
Asymmetric cell fate marker expression in CD49fHSC daughters. (A) Experimental design. (B) Heatmap of fluorescence dynamics over the complete lifetime of CD49fHSC daughter cells (top). Each row represents a pair of CD49fHSC daughter cells (#1 and #2). Different degrees of symmetric and asymmetric expression of CD33 (332 analyzed cells), CD201 (332), CD71 (520), TMRM (520), CD49c (408), and CD34 (121) between daughter cells are observed and clustered. These clusters 1, 2, and 3 are shown as black, gray, and white in all parts of panel B. (Middle) Mean fluorescence intensities over time of the different symmetric and asymmetric clusters, mean ± SD. Quantification of symmetric and asymmetric daughter cell fate cluster frequencies (bottom). n = 4 independent experiments for CD71, TMRM, and CD34, n = 5 for CD33, CD201, and CD49c. Numbers indicate average paired daughter cell difference per cluster.
Asymmetric cell fate marker expression in CD49fHSC daughters. (A) Experimental design. (B) Heatmap of fluorescence dynamics over the complete lifetime of CD49fHSC daughter cells (top). Each row represents a pair of CD49fHSC daughter cells (#1 and #2). Different degrees of symmetric and asymmetric expression of CD33 (332 analyzed cells), CD201 (332), CD71 (520), TMRM (520), CD49c (408), and CD34 (121) between daughter cells are observed and clustered. These clusters 1, 2, and 3 are shown as black, gray, and white in all parts of panel B. (Middle) Mean fluorescence intensities over time of the different symmetric and asymmetric clusters, mean ± SD. Quantification of symmetric and asymmetric daughter cell fate cluster frequencies (bottom). n = 4 independent experiments for CD71, TMRM, and CD34, n = 5 for CD33, CD201, and CD49c. Numbers indicate average paired daughter cell difference per cluster.
To demonstrate that ACD controls CD49fHSC daughter cell fates, we tested whether asymmetric lysosome inheritance predicts future asymmetric daughter cell marker expression dynamics (Figure 3; supplemental Figure 4). Sister cells with symmetric lysosome inheritance showed symmetric and asymmetric expression dynamics for all markers tested (Figure 3A-E; supplemental Figure 4A-D). Importantly, although asymmetric expression dynamics after symmetric lysosome inheritance can be observed, higher and lower marker production occurs in both daughter cells with equal proportion. In contrast, sisters with asymmetric lysosome inheritance showed a drastically increased frequency of asymmetric CD34 and CD49c production (Figure 3D; supplemental Figure 4A-D) and clear directionality of daughter cell differences, with an overall higher production of CD34, CD49c, and, to a minor extent, CD71 in LysoLow daughters. In contrast, CD33, CD201, and TMRM production levels were comparable after symmetric and asymmetric lysosome inheritance (Figure 3E).
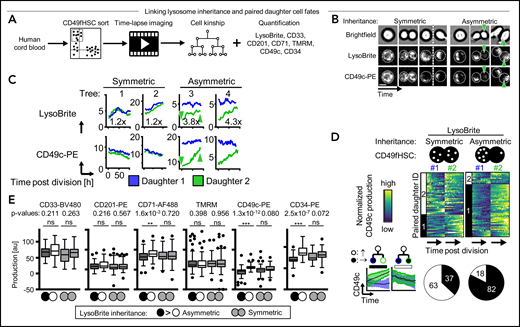
Asymmetric LysoBrite inheritance predicts CD49c, CD34, and CD71 production. (A) Experimental design. (B) Dividing CD49fHSC with simultaneous quantification of LysoBrite and CD49c dynamics. Representative video frames of HSCs with a-/symmetric LysoBrite inheritance (trees 1 and 3 in panel C, respectively). Cells with symmetric LysoBrite inheritance produce comparable levels of CD49c in both daughters. With asymmetric inheritance, LysoLow daughters receive less CD49c and produce more CD49c throughout their cell cycle (green arrowhead, also in panel C). n = 5 independent experiments. Scale bar: 10 µm. (C) Representative quantification of LysoBrite inheritance and CD49c expression dynamics in paired daughter cells. LysoLow daughters produce more CD49c. Fold sister differences early after division are indicated, respectively. (D) Heatmap and clustering (top) and cluster frequency (bottom) of paired daughter cell CD49c dynamics after the a-/symmetric inheritance of LysoBrite. Each row represents a CD49fHSC daughter pair (#1 and #2). Cluster 1: asymmetric (mean paired daughter difference 1472 ± 159); Cluster 2: symmetric (91 ± 112). LysoLow (daughter #2) produces more CD49c. Lower left, mean CD49c fluorescence intensities of a-/symmetric paired daughter cell clusters, mean ± SD. n = 5 independent experiments. (E) CD33, CD201, CD71, TMRM, CD49c, or CD34 production after a-/symmetric LysoBrite inheritance in paired daughter cells. Asymmetric LysoLow daughters (white) produce more CD49c, CD34, and CD71 than their sisters (black). Comparable CD33, CD201, and TMRM production in daughter cells after asymmetric LysoBrite inheritance. Two-tailed Mann-Whitney test. n = 4 independent experiments for CD71, TMRM, and CD34, n = 5 for CD33, CD201, and CD49c.
Asymmetric LysoBrite inheritance predicts CD49c, CD34, and CD71 production. (A) Experimental design. (B) Dividing CD49fHSC with simultaneous quantification of LysoBrite and CD49c dynamics. Representative video frames of HSCs with a-/symmetric LysoBrite inheritance (trees 1 and 3 in panel C, respectively). Cells with symmetric LysoBrite inheritance produce comparable levels of CD49c in both daughters. With asymmetric inheritance, LysoLow daughters receive less CD49c and produce more CD49c throughout their cell cycle (green arrowhead, also in panel C). n = 5 independent experiments. Scale bar: 10 µm. (C) Representative quantification of LysoBrite inheritance and CD49c expression dynamics in paired daughter cells. LysoLow daughters produce more CD49c. Fold sister differences early after division are indicated, respectively. (D) Heatmap and clustering (top) and cluster frequency (bottom) of paired daughter cell CD49c dynamics after the a-/symmetric inheritance of LysoBrite. Each row represents a CD49fHSC daughter pair (#1 and #2). Cluster 1: asymmetric (mean paired daughter difference 1472 ± 159); Cluster 2: symmetric (91 ± 112). LysoLow (daughter #2) produces more CD49c. Lower left, mean CD49c fluorescence intensities of a-/symmetric paired daughter cell clusters, mean ± SD. n = 5 independent experiments. (E) CD33, CD201, CD71, TMRM, CD49c, or CD34 production after a-/symmetric LysoBrite inheritance in paired daughter cells. Asymmetric LysoLow daughters (white) produce more CD49c, CD34, and CD71 than their sisters (black). Comparable CD33, CD201, and TMRM production in daughter cells after asymmetric LysoBrite inheritance. Two-tailed Mann-Whitney test. n = 4 independent experiments for CD71, TMRM, and CD34, n = 5 for CD33, CD201, and CD49c.
Lysosomal inheritance in CD49fHSC thus does not predict future mitochondrial activity of daughter cells, which contrasts previous observations in mouse bone marrow HSCs.1 This suggests that mitochondrial activity is regulated differently in human HSCs or at different developmental stages. Indeed, different from mouse HSCs, where TMRM levels steadily increase over time, TMRM exhibits bursts and shows no obvious correlation with CD71 levels in CD49fHSCs (supplemental Figure 5A-B and Loeffler et al1). These TMRM bursts correlate with reactive oxygen species production bursts and are reduced upon administration of FCCP, an uncoupler of mitochondrial oxidative phosphorylation, confirming that TMRM bursts reflect sudden changes in mitochondrial activity (supplemental Figure 5C-G). The absence of a clear correlation between lysosomal inheritance and mitochondrial activity might explain why CD71 differences between CD49fHSC daughter cells are less pronounced (supplemental Figure 4), despite CD71’s correlation with differentiation as previously reported for mouse (supplemental Figure 6).
We found additional differences between human and mouse cell fate regulation when we quantified the production of surface markers in CD49fHSC daughter cells. We expected LysoLow daughters that produce more CD34, CD71, and CD49c over their cell lifetime to also have higher levels of these markers at the end of their cell lifetime, as previously described for CD71 in mouse HSCs.1 However, despite higher production of CD34, CD71, and CD49c, LysoLow daughters also inherit fewer of these molecules, and they remain at lower levels throughout the entire cell lifetime than LysoHigh daughters, which had inherited more. The increased production in LysoLow CD49fHSC could be a regulatory feedback mechanism initiated to compensate for the mitotic loss. However, the increased marker production of LysoLow CD49fHSC is often not sufficient to reach levels of LysoHigh sisters, which then remain at higher levels of CD33, CD34, and CD71 throughout both sister cells lifetimes (supplemental Figure 4E). This provides further evidence that the asymmetric and coordinated inheritance of lysosomes, recycling endosomes, and surface adhesion molecules predicts CD49fHSC daughter cell marker expression and behavior. Asymmetrically inherited CD71 localizes to recycling endosomes and possibly returns to the cell surface to influence future daughter cell behavior.
Asymmetric inheritance of active mitochondria correlates with later metabolic activation of CD49fHSC daughter cells
Although lysosomes, recycling endosomes, and surface markers are co-inherited into the same daughter cells, active mitochondria (as detected by TMRM) are preferentially inherited into LysoLow daughters (supplemental Figures 1G-J and 2A-D). However, the degree of asymmetric inheritance is smaller for TMRM than lysosomes (Figure 1D), and asymmetric inheritance of TMRM into opposite daughter does not occur in all cells (supplemental Figures 1J and 2D). It thus remains unclear whether the relatively small TMRM sister differences are of functional relevance and affect future cell behaviors. Asymmetric mitochondria inheritance in mouse HSCs has previously been suggested, but no clear link to future daughter cell fate acquisition, and thus functional relevance, has been demonstrated.2 Asymmetric cell division involving mitochondria had thus not yet been demonstrated in highly purified mouse HSCs and human CD49fHSCs.
We therefore tested whether the asymmetric inheritance of active mitochondria could predict future CD49fHSC daughter cell marker expression and behavior. We quantified their inheritance using TMRM42 and measured the cell-cycle length, mitochondrial activity, and CD71 expression in daughters over time (Figure 4A). CD49fHSC daughters inheriting more TMRM had more mitochondrial activity later (Figure 4B-D,G), whereas, in contrast to lysosomal inheritance, CD71 upregulation and cell-cycle length of CD49fHSC daughter cells could not be predicted (Figure 4E,F,H). This shows that the asymmetric inheritance of TMRM correlates with future differences in mitochondrial activity in daughter cells.
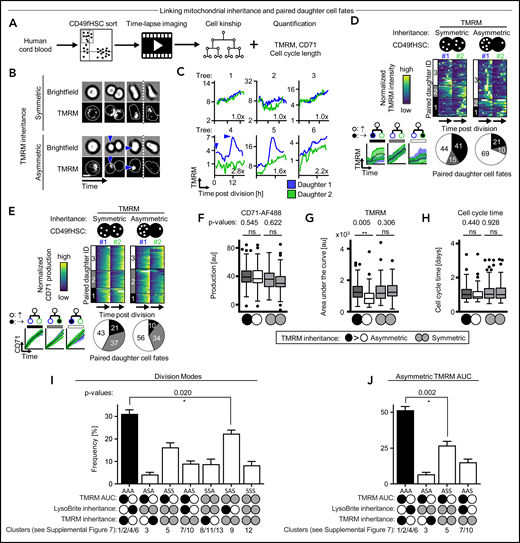
Asymmetric TMRM inheritance predicts mitochondrial activation. (A) Experimental design. (B) Dividing CD49fHSC with quantification of TMRM inheritance and dynamics. Representative frames of CD49fHSCs with a-/symmetric TMRM inheritance (trees 4 and 2 in panel C, respectively). Cells with symmetric inheritance of TMRM produce comparable levels TMRM in both daughter cells. With asymmetric inheritance, daughters receiving more TMRM upregulate mitochondrial activity (blue arrowhead). n = 4 independent experiments. Scale bar: 10 µm. (C) Representative quantification of TMRM inheritance and dynamics in paired daughter cells. Daughters receiving more TMRM have more future mitochondrial activity. Fold sister differences early after division are indicated, respectively. (D,E) Heatmap and clustering (top) and cluster frequency (bottom) of paired daughter cell TMRM dynamics (D) or CD71 production (E) after a-/symmetric inheritance of TMRM. Each row represents a CD49fHSC daughter pair (#1 and #2). Daughter #1 receives more TMRM during asymmetric inheritance and later has more active mitochondria (cluster 3 with mean paired daughter difference: −645 ± 112; clusters 1/2 with 847 ± 39/80 ± 208). TMRM inheritance does not predict symmetric (cluster 1; mean paired daughter difference: 57 ± 66) or asymmetric (clusters 2 and 3; −572 ± 33 and 382 ± 74) CD71 production. Lower left, mean TMRM and CD71 fluorescence intensities of a-/symmetric paired daughter cell clusters, respectively, mean ± SD. n = 4 independent experiments, 110 and 37 analyzed symmetric (<1.1-fold) and asymmetric (>1.5-fold) divisions, respectively. (F-H) Quantification of CD71 production (F) mitochondrial activity (G) and CD49fHSC daughter cell lifetimes (H) after a-/symmetric TMRM inheritance. TMRM inheritance predicts mitochondrial activity in CD49fHSCs daughter cells, but not CD71 production and daughter cell lifetimes. Box-plot elements: center line, median; box limits, upper and lower quartiles; Tukey’s 1.5× interquartile range; points, outlier. n = 4 independent experiments, 110 and 37 analyzed symmetric (<1.1-fold) and asymmetric (>1.5-fold) divisions, respectively. (I) Overall frequency of a-/symmetric LysoBrite/TMRM co-/anti-inheritance and future paired daughter cell mitochondrial activity (TMRM area under the curve). Antisegregation of TMRM and lysosomes correlates with asymmetric mitochondria activity of CD49fHSC daughters. (J) Frequency of a-/symmetric lysosome and TMRM division modes of paired daughter cells with only asymmetric mitochondrial activity. Asymmetric antisegregation of TMRM and lysosomes correlates with asymmetric mitochondrial activity in paired daughter cells. n = 8 independent experiments with 647 CD49fHSC divisions total.
Asymmetric TMRM inheritance predicts mitochondrial activation. (A) Experimental design. (B) Dividing CD49fHSC with quantification of TMRM inheritance and dynamics. Representative frames of CD49fHSCs with a-/symmetric TMRM inheritance (trees 4 and 2 in panel C, respectively). Cells with symmetric inheritance of TMRM produce comparable levels TMRM in both daughter cells. With asymmetric inheritance, daughters receiving more TMRM upregulate mitochondrial activity (blue arrowhead). n = 4 independent experiments. Scale bar: 10 µm. (C) Representative quantification of TMRM inheritance and dynamics in paired daughter cells. Daughters receiving more TMRM have more future mitochondrial activity. Fold sister differences early after division are indicated, respectively. (D,E) Heatmap and clustering (top) and cluster frequency (bottom) of paired daughter cell TMRM dynamics (D) or CD71 production (E) after a-/symmetric inheritance of TMRM. Each row represents a CD49fHSC daughter pair (#1 and #2). Daughter #1 receives more TMRM during asymmetric inheritance and later has more active mitochondria (cluster 3 with mean paired daughter difference: −645 ± 112; clusters 1/2 with 847 ± 39/80 ± 208). TMRM inheritance does not predict symmetric (cluster 1; mean paired daughter difference: 57 ± 66) or asymmetric (clusters 2 and 3; −572 ± 33 and 382 ± 74) CD71 production. Lower left, mean TMRM and CD71 fluorescence intensities of a-/symmetric paired daughter cell clusters, respectively, mean ± SD. n = 4 independent experiments, 110 and 37 analyzed symmetric (<1.1-fold) and asymmetric (>1.5-fold) divisions, respectively. (F-H) Quantification of CD71 production (F) mitochondrial activity (G) and CD49fHSC daughter cell lifetimes (H) after a-/symmetric TMRM inheritance. TMRM inheritance predicts mitochondrial activity in CD49fHSCs daughter cells, but not CD71 production and daughter cell lifetimes. Box-plot elements: center line, median; box limits, upper and lower quartiles; Tukey’s 1.5× interquartile range; points, outlier. n = 4 independent experiments, 110 and 37 analyzed symmetric (<1.1-fold) and asymmetric (>1.5-fold) divisions, respectively. (I) Overall frequency of a-/symmetric LysoBrite/TMRM co-/anti-inheritance and future paired daughter cell mitochondrial activity (TMRM area under the curve). Antisegregation of TMRM and lysosomes correlates with asymmetric mitochondria activity of CD49fHSC daughters. (J) Frequency of a-/symmetric lysosome and TMRM division modes of paired daughter cells with only asymmetric mitochondrial activity. Asymmetric antisegregation of TMRM and lysosomes correlates with asymmetric mitochondrial activity in paired daughter cells. n = 8 independent experiments with 647 CD49fHSC divisions total.
Although asymmetric TMRM inheritance can predict future mitochondrial activity in daughter cells, asymmetric inheritance of LysoBrite alone does not. This is surprising given the frequent anti-inheritance of TMRM and LysoBrite, and the link between LysoBrite inheritance and future mitochondrial activity in mouse HSCs.1 Because only 59.6 ± 3.4% of CD49fHSC divisions with asymmetric LysoBrite inheritance show clear asymmetric antisegregation of TMRM, this discrepancy could be explained by measurement noise introduced by other segregation patterns (supplemental Figures 1J and 2D). We thus imaged divisions of CD49fHSCs stained by both LysoBrite and TMRM and quantified the mitochondrial activity in paired daughter cells. To minimize human bias by selecting arbitrary thresholds for a-/symmetric inheritance, we used unsupervised clustering on SisterRatios, absolute inherited differences, and absolute level of LysoBrite and TMRM and mitochondrial activity in paired daughter cells (supplemental Figure 7A-D). By also taking the amounts of inherited organelles into account, we identified 13 clusters, representing 7 different combinations of a-/symmetric LysoBrite/TMRM co-/antisegregation and paired daughter cell fates (Figure 4I). Importantly, and in line with our previous observations, asymmetric antisegregation of LysoBrite and TMRM is the predominant division mode, correlates with asymmetric mitochondrial activity in paired daughter cells, and constitutes 51.4 ± 2.6% of all paired daughter cells with asymmetric mitochondrial activity (Figure 4J). This correlation is missed when relying on LysoBrite inheritance alone because LysoHigh daughters give rise to daughters with low and high mitochondrial activity to comparable proportions (Figure 4I; compare “AAA” vs “SAS + AAS”). However, only 58.1 ± 3% (Figure 4J; “AAA + ASA”) of daughters with asymmetric mitochondrial activity also have asymmetric TMRM inheritance, suggesting mitochondrial activity is also regulated by other unknown factors.
ACD regulates cell fates also of further purified CD49fHSCs
CD49fHSCs are a heterogeneous population with varying self-renewal and differentiation potential, containing about 10% functional HSCs.29 Several surface markers have recently been described to enrich for stem cell potential (CD201, CD33, CD49c) within the CD49fHSC population.37-39 To further increase hHSC purity, we quantitatively imaged living CD49fHSCs and clustered their single-cell expression dynamics of either CD201/CD33, CD71/TMRM, or CD49c/CD71. This creates real-time differentiation landscapes of different cellular states as they change during culture (Figure 5A; supplemental Figure 8).
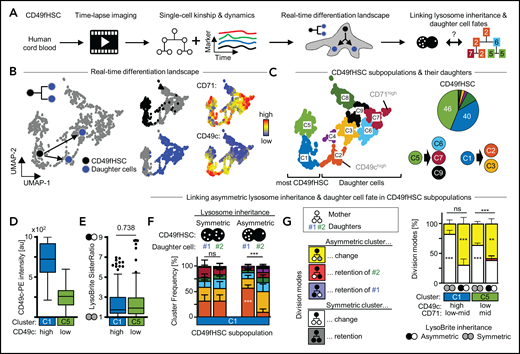
More purified CD49fHSC subpopulations also use asymmetric cell division to regulate daughter fates. (A) Experimental design. (B) CD49fHSC real-time differentiation landscapes by Uniform Manifold Approximation and Projection (UMAP). Localization of CD49fHSCs and daughters in landscape including CD71 and CD49c levels before divisions. n = 5 independent experiments; 1093 cells analyzed. (C) Identification of high-dimensional cell states (= clusters) in real-time differentiation landscape. Frequency of CD49f subpopulations and their potential to give rise of daughter cells in different parts of the depicted landscape. (D) CD49c expression of cluster C1 and C5 CD49fHSCs. (E) Both CD49c(high) and (low) CD49fHSCs show a- and symmetric lysosome inheritance. (F) Average frequency of cell fates (= clusters) in daughter cells after a-/symmetric LysoBrite inheritance in CD49c(high) cluster1 HSCs. Sister cell fates (= clusters, colors as in panel C) are comparable after symmetric inheritance, but differ after asymmetric inheritance. Asymmetric LysoHigh sisters more frequently acquire fates (clusters) with higher levels of CD49c than their LysoLow sisters. Two-way analysis of variance (ANOVA), Sidak multiple comparison corrected. n = 5 independent experiments; 1093 cells analyzed. (G) Quantification of overall a-/symmetric paired daughter cell fates (= clusters) after a-/symmetric LysoBrite inheritance. Five theoretically possible combinations of mother and daughter clusters (“division modes”) are shown on the left. Lysosome inheritance predicts division modes in CD49chigh and CD49clow CD49fHSC subpopulations (clusters C1 and C5, respectively). In these subpopulations, after a-/symmetric LysoBrite inheritance, daughter cells a-/symmetrically change mother clusters (yellow/white). Two-way ANOVA, Sidak multiple comparison corrected. n = 5 independent experiments mean ± SEM.
More purified CD49fHSC subpopulations also use asymmetric cell division to regulate daughter fates. (A) Experimental design. (B) CD49fHSC real-time differentiation landscapes by Uniform Manifold Approximation and Projection (UMAP). Localization of CD49fHSCs and daughters in landscape including CD71 and CD49c levels before divisions. n = 5 independent experiments; 1093 cells analyzed. (C) Identification of high-dimensional cell states (= clusters) in real-time differentiation landscape. Frequency of CD49f subpopulations and their potential to give rise of daughter cells in different parts of the depicted landscape. (D) CD49c expression of cluster C1 and C5 CD49fHSCs. (E) Both CD49c(high) and (low) CD49fHSCs show a- and symmetric lysosome inheritance. (F) Average frequency of cell fates (= clusters) in daughter cells after a-/symmetric LysoBrite inheritance in CD49c(high) cluster1 HSCs. Sister cell fates (= clusters, colors as in panel C) are comparable after symmetric inheritance, but differ after asymmetric inheritance. Asymmetric LysoHigh sisters more frequently acquire fates (clusters) with higher levels of CD49c than their LysoLow sisters. Two-way analysis of variance (ANOVA), Sidak multiple comparison corrected. n = 5 independent experiments; 1093 cells analyzed. (G) Quantification of overall a-/symmetric paired daughter cell fates (= clusters) after a-/symmetric LysoBrite inheritance. Five theoretically possible combinations of mother and daughter clusters (“division modes”) are shown on the left. Lysosome inheritance predicts division modes in CD49chigh and CD49clow CD49fHSC subpopulations (clusters C1 and C5, respectively). In these subpopulations, after a-/symmetric LysoBrite inheritance, daughter cells a-/symmetrically change mother clusters (yellow/white). Two-way ANOVA, Sidak multiple comparison corrected. n = 5 independent experiments mean ± SEM.
The majority of CD49fHSCs fall into CD49chighCD71low-mid (40%) and CD49clowCD71mid (46%) subpopulations (clusters C1 and C5, respectively). These subpopulations differ in their CD49c levels, give rise to daughter cells in different parts of the landscape, and show asymmetric and symmetric lysosome inheritance (Figure 5C-E). Importantly, lysosome inheritance of the more purified CD49chighCD49fHSC subpopulation can also be linked to daughter cell fate acquisition, with LysoHigh daughters from asymmetric lysosome divisions preferentially falling into cluster C2, which describes cells expressing high levels of the in vitro hHSC marker CD49c (Figure 5F). To further validate this result and to exclude potential artifacts introduced by averaging effects of unrelated cells, we quantified paired daughter cell fate acquisition after a-/symmetric lysosome inheritance. For this analysis, we categorized all theoretical mother/daughter cluster combinations into 5 division modes, indicative of different types of a-/symmetric fate acquisition between the paired daughter cells (Figure 5G). This analysis confirmed our previous conclusions, demonstrating that in CD49chighCD49fHSCs with asymmetric lysosome inheritance, the paired daughter cell fates acquired are predominantly asymmetric (= Asymmetric cluster change). This conclusion is further supported by using differentiation landscapes created based on the stem cell markers CD201/CD33 and CD71/TMRM (supplemental Figure 8). Here, CD49fHSC subpopulations expressing either stem cell markers CD201 and CD33 (cluster A6) or TMRM and CD71 (cluster B3) also show asymmetric lysosome inheritance, which can be linked to later asymmetric daughter cell fate acquisition (supplemental Figure 8Q,R). Taken together, our data demonstrate that also the more purified CD49fHSC population (CD49cHighCD201+CD33+TMRMLow) uses ACD to regulate daughter cell fates.
Absolute levels of inherited lysosomes correlate with later myeloid differentiation
LysoHigh CD49fHSC daughters after asymmetric lysosome inheritance retain higher expression levels of hHSC markers throughout their cell lifetime than their sibling. LysoLow daughters are thus expected to differentiate faster. To test this hypothesis, we tracked the offspring of CD49fHSCs over 14 days; quantified the expression dynamics of CD201, CD49c, and CD33; and created real-time differentiation landscapes spanning 4 cell generations (Figure 6A; supplemental Figure 10A-D) including LysoBrite to see whether CD49fHSCs differ in their absolute lysosome levels. Cells were then clustered by their expression and dynamics of these markers. In line with our previous observations (Figure 5; supplemental Figures 8 and 9), freshly isolated CD49fHSCs (cluster 4) and their offspring localize to different parts of the landscape (Figure 6B-D; supplemental Figure 10A-D). In this landscape, CD49cHighCD201HighCD33Low should enrich for HSCs with durable self-renewal potential more than CD49f alone.37 High CD33 levels (cluster 1) indicate myeloid differentiation.47 Interestingly, and in line with recent reports in mouse HSCs,4 lysosome levels vary among CD49fHSCs (Figure 6B). To test whether CD49fHSCs with different lysosome levels give rise to offspring with different cell fates (= clusters), we compared the output of CD49fHSCs with low, intermediate, and high LysoBrite levels over time (Figure 6E). This analysis showed that LysoLow CD49fHSCs give rise to offspring expressing higher CD33 levels (Figure 6F) that preferentially localize to cluster 1 (Figure 6F), indicative of myeloid differentiation. This suggests that not only the relative difference between sisters (SisterRatio) but also the absolute amount of inherited lysosome of CD49fHSC daughters can influence later cell fate acquisition.
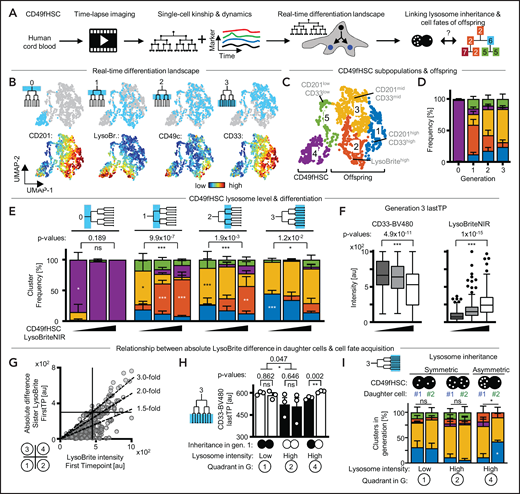
Lysosome abundance and inheritance predict CD33 upregulation. (A) Experimental design. (B) CD49fHSC real-time differentiation landscapes by Uniform Manifold Approximation and Projection (UMAP). Localization of CD49fHSCs and offspring until generation 3 in landscapes, and CD201, LysoBrite, CD49c, and CD33 levels before divisions. n = 4 independent experiments, 1994 cells analyzed. (C,D) Identification of high-dimensional cell states (= clusters) in real-time differentiation landscape. Frequency of cell states in different cell generations. (E) Average frequency of cell fates (= clusters, colors as in panel C) in offspring generations of LysoLow, LysoMid, and LysoHigh CD49fHSCs. LysoLow CD49fHSC offspring more frequently acquire clusters with higher levels of CD33 than LysoHigh offspring. Two-way ANOVA, Sidak multiple comparison corrected. n = 3 independent experiments mean ± SEM; 1994 cells analyzed. (F) Quantification of CD33 levels (left) and LysoBriteNIR (right) before division in generation 3 offspring of LysoLow, LysoMid, and LysoHigh CD49fHSCs. CD33 levels higher in LysoLow offspring. Box-plot elements: center line, median; box limits, upper and lower quartiles; Tukey’s 1.5× interquartile range; points, outlier. Two-tailed Mann-Whitney test. (G) LysoBrite levels inherited by CD49fHSC daughter cells after division and absolute difference in LysoBrite levels between sister cells. LysoLow and LysoHigh daughters can distribute lysosomes symmetrically (quadrants 1 and 2), whereas LysoHigh cells show strongest asymmetric inheritance of absolute LysoBrite levels (quadrant 4). A total of 139, 55, and 33 CD49fHSC divisions in quadrants 1, 2, and 4, respectively. (H) CD33 levels before division in generation 3 offspring after a-/symmetric LysoBrite inheritance in LysoLow and LysoHigh CD49fHSCs as depicted in panel G. Symmetric LysoBrite inheritance of LysoLow and LysoHigh CD49fHSCs gives rise to symmetrically high and low CD33 expression in generation 3 offspring, respectively. CD33 levels in offspring of LysoLow daughters is higher than LysoHigh daughters after asymmetric LysoBrite inheritance. n = 3 independent experiments. Mean ± SEM. Two-tailed paired t test. (I) Average frequency of cell fates (= clusters, colors as in panel C) in offspring (generation 3) after a-/symmetric LysoBrite inheritance in LysoLow and LysoHigh CD49fHSC as depicted in panel G. Sister offspring clusters are comparable after symmetric inheritance, but differ after asymmetric inheritance. Asymmetric LysoLow sisters more frequently acquire fates (clusters) with higher levels of CD33 than their LysoHigh sisters. χ2 test, Sidak multiple comparison corrected. n = 3 independent experiments, mean ± SEM; 1994 cells analyzed.
Lysosome abundance and inheritance predict CD33 upregulation. (A) Experimental design. (B) CD49fHSC real-time differentiation landscapes by Uniform Manifold Approximation and Projection (UMAP). Localization of CD49fHSCs and offspring until generation 3 in landscapes, and CD201, LysoBrite, CD49c, and CD33 levels before divisions. n = 4 independent experiments, 1994 cells analyzed. (C,D) Identification of high-dimensional cell states (= clusters) in real-time differentiation landscape. Frequency of cell states in different cell generations. (E) Average frequency of cell fates (= clusters, colors as in panel C) in offspring generations of LysoLow, LysoMid, and LysoHigh CD49fHSCs. LysoLow CD49fHSC offspring more frequently acquire clusters with higher levels of CD33 than LysoHigh offspring. Two-way ANOVA, Sidak multiple comparison corrected. n = 3 independent experiments mean ± SEM; 1994 cells analyzed. (F) Quantification of CD33 levels (left) and LysoBriteNIR (right) before division in generation 3 offspring of LysoLow, LysoMid, and LysoHigh CD49fHSCs. CD33 levels higher in LysoLow offspring. Box-plot elements: center line, median; box limits, upper and lower quartiles; Tukey’s 1.5× interquartile range; points, outlier. Two-tailed Mann-Whitney test. (G) LysoBrite levels inherited by CD49fHSC daughter cells after division and absolute difference in LysoBrite levels between sister cells. LysoLow and LysoHigh daughters can distribute lysosomes symmetrically (quadrants 1 and 2), whereas LysoHigh cells show strongest asymmetric inheritance of absolute LysoBrite levels (quadrant 4). A total of 139, 55, and 33 CD49fHSC divisions in quadrants 1, 2, and 4, respectively. (H) CD33 levels before division in generation 3 offspring after a-/symmetric LysoBrite inheritance in LysoLow and LysoHigh CD49fHSCs as depicted in panel G. Symmetric LysoBrite inheritance of LysoLow and LysoHigh CD49fHSCs gives rise to symmetrically high and low CD33 expression in generation 3 offspring, respectively. CD33 levels in offspring of LysoLow daughters is higher than LysoHigh daughters after asymmetric LysoBrite inheritance. n = 3 independent experiments. Mean ± SEM. Two-tailed paired t test. (I) Average frequency of cell fates (= clusters, colors as in panel C) in offspring (generation 3) after a-/symmetric LysoBrite inheritance in LysoLow and LysoHigh CD49fHSC as depicted in panel G. Sister offspring clusters are comparable after symmetric inheritance, but differ after asymmetric inheritance. Asymmetric LysoLow sisters more frequently acquire fates (clusters) with higher levels of CD33 than their LysoHigh sisters. χ2 test, Sidak multiple comparison corrected. n = 3 independent experiments, mean ± SEM; 1994 cells analyzed.
If true, cell fates should differ between LysoBrite high and low CD49fHSC offspring, independently of a-/symmetric inheritance. Indeed, whereas paired sisters acquire more symmetric fates after symmetric lysosome inheritance, symmetric LysoLow sister pairs differ from symmetric LysoHigh sister pairs in their future CD33 regulation and cell fate acquisition (Figure 6G-H). After asymmetric lysosome inheritance, CD33 expression and cell fate acquisitions in LysoLow and LysoHigh offspring corresponds to that of symmetric LysoHigh and LysoLow sister pairs, respectively (Figure 6H-I). This demonstrates that the levels of inherited lysosomes influence cell fate acquisition and marker expression of CD49fHSC offspring independently of its a-/symmetry (supplemental Figure 10E). Our analysis thus demonstrates that both lysosome levels and inheritance correlate with later cell fate acquisition of CD49fHSC offspring and that low lysosome levels correlate with increased myeloid differentiation.
Cell-cycle kinetics correlate with lysosomal and mitochondrial inheritance
Although not statistically significant, we noticed that clusters A5, B3, and C1, all associated with higher expression of stem cell markers, have fewer divisions with high lysosome sister ratios (supplemental Figure 8P). These CD49fHSC subpopulations also have longer time to first division in culture (supplemental Figure 8J-L), a widely used indicator of HSC dormancy strongly correlating with increased stem cell potential in mice48,49 and man.50,51 We thus compared lysosome and active mitochondria inheritance in CD49fHSC with short and long time to first division (supplemental Figure 9B-C). Lysosomes were more symmetrically inherited in a CD49fHSCs subset with very long times to first division in culture (supplemental Figure 9B) and opposite to lysosomal inheritance, asymmetric inheritance of active mitochondria increases with a longer time to first CD49fHSC division (supplemental Figure 9C).
This slow-cycling subpopulation accounts for less than 10% of CD49fHSCs and can also be seen in data from previous studies,50 but has until now not been further characterized. It expresses lower CD33, TMRM, and CD34 and higher CD49c and CD71. CD201 levels are the same as in CD49fHSCs with short first division times (supplemental Figure 9D). This hints at the existence of a deeply quiescent CD49fHSC subpopulation prone to symmetric lysosomal and asymmetric mitochondrial segregation. This population might be reminiscent of recently reported CD34− human cord blood-derived HSCs, which also exhibit a very long time to first division in vitro and have been proposed to be at the apex of the human HSC hierachy,52 but functional assays will be required to confirm this hypothesis. Furthermore, lysosomes were recently shown to regulate quiescence in mouse HSCs.4,53 In line with this observation, LysoHigh daughters also have a slightly shorter cell lifetime (supplemental Figure 9E), suggesting a link between lysosome inheritance and cell-cycle progression in CD49fHSCs, as was reported for the vacuole in yeast.54
Discussion
Taken together, we demonstrate that lysosomes, autophagosomes, mitophagosomes, autolysosomes, and the surface markers CD71, CD49c, CD34, CD201, and CD33 can be asymmetrically co-inherited during human cord blood-derived CD49fHSC divisions. This inheritance predicts the future production of CD49c, CD34, and CD71, and cell lifetimes of CD49fHSC daughters. It also predicts the regulation of the myeloid lineage marker CD33 several cell generations later. We demonstrate that both the absolute lysosome levels and their partitioning during division correlate with future daughter cell fates. Lysosomal inheritance also predicts later levels of hHSCs markers CD201, CD49c, CD33, and TMRM. Although the hHSC purity that can be achieved when all these markers are combined has not yet been tested using the most stringent functional assays available, previous studies showed that these markers individually increase the purity of functional CD49fHSCs.37-39 The combination of these markers thus likely exceeds the 10% purity of CD49fHSCs and yields functional hHSCs with theoretical purities of up to 20% to 50%. Although it remains likely that ACD also occurs outside the functional long-term reconstituting hHSC compartment not analyzed in more detail here, asymmetric lysosomal inheritance can be found in all tested CD49fHSC subsets, suggesting that even further purified CD49fHSC use ACD. Noteworthy, and in contrast to previous studies using inbred animal models to investigate HSC fate regulation, we show ACD can also be robustly read out in primary CD49fHSCs from a heterogeneous outbred human population.
Additionally, we find that lysosomes, autophagosomes, mitophagosomes, and recycling endosomes are inherited into the same daughter cell, whereas TMRM+ active mitochondria preferentially segregate into the opposite daughter in living and fixed human HSPCs. This indicates that mitotic organelle partitioning is a coordinated rather than a stochastic process and regulates numerous cellular processes in daughter cells, such as surface marker levels, cell-cycle length, differentiation, and metabolic activity. These observations are in line with lysosomes’ emerging role as major hubs for signaling pathways55,56 regulating growth, differentiation,3,57 and quiescence in mouse1,4,58 and human HSCs,59 where lysosome-mediated degradation of membrane receptors was suggested as a possible mechanism of organelle-mediated cell fate decisions. Whether hHSC in vitro self-renewal is also controlled by ACD would ultimately have to be shown by single-cell xenotransplantation assays. Although we did not test whether human adult bone marrow-derived HSCs use ACD, both mouse bone marrow and human cord blood-derived CD49fHSCs use ACD via the asymmetric partitioning of lysosomes, suggesting parts of the underlying mechanisms to be conserved.
Our data make it likely that mammalian HSCs use ACD also in vivo. This and the likely influence of different in vivo HSC niches will be important to analyze but is currently prohibited by technical limitations. Improved bone marrow imaging enables better quantification of HSCs in fixed60-64 and live65,66 bone marrow. However, in mouse and even more so in human bone marrow, it remains impossible to identify HSCs during or directly after division to quantify asymmetric inheritance of molecules or organelles with the required accuracy and throughput and with the required knowledge of future paired daughter cell fates. We provide evidence for the existence of ACD as a mechanism regulating fates of CD49fHSCs in culture, which is highly relevant for their therapeutic expansion or genetic manipulation. It will be interesting to now address open questions about the regulation of ACD by cell-extrinsic and cell-intrinsic cues, of the coordinated polarization and inheritance of lysosomes and other organelles, and about the identity of ACD fate regulators and their molecular target programs.
Acknowledgments
The authors thank G. Camenisch, M. Hussherr, and H. Oller for their support and J. Bernitz for commenting on the manuscript.
This work was supported by the Swiss National Science Foundation grant 179490 to T.S. D.L. acknowledges financial support from ETH Seed Grant SEED-23 18-2.
Authorship
Contribution: D.L. and F.S. planned, performed, and analyzed experiments; D.L. developed analysis software; W.W. supported cord blood preparation and flow cytometry; A.W. implemented fluorescence image correction; M.G.M. and C.L. supplied umbilical cord blood; T.S. and D.L. designed and supervised the study; T.S. and D.L. developed quantitative long-term bioimaging and T.K. supported its maintenance; and all authors read and commented on the final manuscript.
Conflict-of-interest disclosure: The authors declare no competing financial interests.
All data are available in the manuscript or the supplemental materials. The datasets generated during and/or analyzed during the current study are available from the corresponding author on reasonable request.
Correspondence: Timm Schroeder, Department of Biosystems Science and Engineering, Eidgenössische Technische Hochschule Zurich, Mattenstrasse 26, 4058 Basel, Switzerland; e-mail: timm.schroeder@bsse.ethz.ch.
The online version of this article contains a data supplement.
There is a Blood Commentary on this article in this issue.
The publication costs of this article were defrayed in part by page charge payment. Therefore, and solely to indicate this fact, this article is hereby marked “advertisement” in accordance with 18 USC section 1734.

This feature is available to Subscribers Only
Sign In or Create an Account Close Modal