

Key Points
Across conditioning intensities, peri-HCT MRD dynamics improve accuracy of risk assessment over isolated pre- or post-HCT MRD assessments.
Non-MAC regimens were less likely to clear MRD than MAC regimens, but if they did, the impact on outcome was greater.

Abstract
In acute myeloid leukemia (AML), measurable residual disease (MRD) before or after allogeneic hematopoietic cell transplantation (HCT) is an established independent indicator of poor outcome. To address how peri-HCT MRD dynamics could refine risk assessment across different conditioning intensities, we analyzed 810 adults transplanted in first or second remission after myeloablative conditioning (MAC; n = 515) or non-MAC (n = 295) who underwent multiparameter flow cytometry–based MRD testing before as well as 20 to 40 days after allografting. Patients without pre- and post-HCT MRD (MRDneg/MRDneg) had the lowest risks of relapse and highest relapse-free survival (RFS) and overall survival (OS). Relative to those patients, outcomes for MRDpos/MRDpos and MRDneg/MRDpos patients were poor regardless of conditioning intensity. Outcomes for MRDpos/MRDneg patients were intermediate. Among 161 patients with MRD before HCT, MRD was cleared more commonly with a MAC (85 of 104; 81.7%) than non-MAC (33 of 57; 57.9%) regimen (P = .002). Although non-MAC regimens were less likely to clear MRD, if they did, the impact on outcome was greater. Thus, there was a significant interaction between conditioning intensity and “MRD conversion” for relapse (P = .020), RFS (P = .002), and OS (P = .001). Similar findings were obtained in the subset of 590 patients receiving HLA-matched allografts. C-statistic values were higher (indicating higher predictive accuracy) for peri-HCT MRD dynamics compared with the isolated use of pre-HCT MRD status or post-HCT MRD status for prediction of relapse, RFS, and OS. Across conditioning intensities, peri-HCT MRD dynamics improve risk assessment over isolated pre- or post-HCT MRD assessments in patients with AML.
Introduction
Measurable (minimal) residual disease (MRD) has strong independent prognostic significance in acute myeloid leukemia (AML) at various time points throughout the treatment course.1-6 For patients undergoing allogeneic hematopoietic cell transplantation (HCT), numerous studies show that pre- and post-HCT MRD testing can inform on prognosis. In contrast, how peri-HCT MRD dynamics (ie, testing MRD before and approximately 1 month after HCT) could serve as prognostic biomarker or refine the information provided by pre- or post-HCT MRD testing is poorly understood. In a previous analysis of 279 adults who received an allograft after myeloablative conditioning (MAC) while their AML was in remission, we found that almost 80% of patients with pre-HCT MRD had no detectable MRD approximately 1 month after HCT.7 However, for patients with pre-HCT MRD, outcomes were poor regardless of the early post-HCT MRD status, indicating that early post-HCT “MRD conversion” with MAC had, at best, limited benefit. The relationship between early post-HCT MRD conversion and outcome after non-MAC has thus far not been studied. Plausibly, lower conditioning intensities are associated with lower MRD conversion rates. Conversely, because early post-HCT MRD clearance with lower-intensity conditioning might identify treatment-sensitive leukemias better than with MAC, MRD conversion might have greater impact in those that convert. Because multiparameter flow cytometry–based MRD testing on bone marrow samples is routine before and approximately 1 month after HCT at our institution, we evaluated this idea in a large cohort of adults who underwent MAC or non-MAC allogeneic HCT for AML in first or second remission over a period of almost 14 years.
Patients and methods
Study cohort
We identified all adults ≥18 years of age with AML (2016 World Health Organization criteria8) who underwent a first allogeneic HCT while in first or second remission (ie, <5% blasts in bone marrow) between April 2006 (when a new MRD assay was introduced) and December 2019. Data from 714 of the 810 patients in the final study cohort, including 264 patients examined for early post-HCT MRD clearance after MAC, have been partially reported.7,9-17 The HCT-specific comorbidity index was calculated as previously described.18 Related or unrelated donors were selected by high-resolution HLA typing. Post-HCT maintenance therapy was not typically done except in a small subset of patients with FLT3-mutated AML after midostaurin was approved in 2017. Information on post-HCT outcomes was captured via the Long-Term Follow-Up Program through medical records from our outpatient clinic and local clinics that provided primary care for patients in addition to records obtained on patients on research studies. All patients were treated on institutional review board–approved research protocols (all registered with clinicaltrials.gov) or standard treatment protocols and gave consent in accordance with the Declaration of Helsinki. Follow-up was current as of 30 March 2021.
Classification of disease risk and treatment response
The refined Medical Research Council/National Cancer Research Institute (MRC/NCRI) criteria19 were used to assign cytogenetic risk at diagnosis. Cytogenetically normal AML was considered in patients with a normal karyotype regardless of how many metaphases were available for analysis.17,20 Because molecular data at time of diagnosis were lacking in many patients, only cytogenetic risk could be used to classify patients. Secondary AML was defined as disease following an antecedent hematologic disorder or treatment with systemic chemotherapy and/or radiotherapy for a different disorder.11,13,17 Treatment responses were categorized as proposed by the European LeukemiaNet21 except that post-HCT relapse was defined as emergence > 5% blasts by morphology or multiparameter flow cytometry (MFC) in blood or bone marrow, emergence of cytogenetic abnormalities seen previously, or presence/emergence of any level of disease if leading to a therapeutic intervention. Peripheral blood CD3 chimerism data were categorized as done by Craddock et al.22
Types and intensity of conditioning regimens
High-dose fractionated total body irradiation (TBI; ≥12 Gy) with or without cyclophosphamide (CY) or fludarabine (FLU), high-dose TBI/thiotepa/FLU, busulfan (4 days) with CY or FLU, treosulfan/FLU with or without low-dose TBI, or any regimen containing a radiolabeled antibody was considered MAC regimens. Nonmyeloablative (NMA) conditioning regimens included 2- to 3-Gy TBI with or without FLU and, in the case of HLA-haploidentical and cord blood HCT, cyclophosphamide. All others were considered reduced intensity conditioning (RIC) regimens.
Detection of MRD by multiparameter flow cytometry
Ten-color flow cytometry was performed as a routine clinical test on bone marrow aspirates obtained during the pre-HCT work up (ie, before starting conditioning therapy) and during several time points after HCT. The methodology of the MRD assay has remained essentially unchanged throughout the study period.7,9-11131723 MRD was identified by visual inspection via “difference from normal approach” as a cell population showing deviation (typically seen in more than 1 antigen) from the normal patterns of antigen expression found on specific cell lineages at specific stages of maturation compared with either normal or regenerating marrow based on the tested antibody panel.23 The assay detects MRD in the large majority of cases to a level of 0.1% and in progressively smaller subsets of patients as the level of MRD decreases below that level. When identified, the abnormal population was quantified as a percentage of the total CD45+ white blood cell (WBC) events. Because post-HCT relapse rates were similar for patients with a low, intermediate, or high level of pre-HCT MRD and substantially higher than those for patients without pre-HCT MRD (supplemental Figure 1 available on the Blood Web site), any measurable level of MRD was considered positive, as done in prior analyses.7,9-17 Differences in absolute numerical values of the percentage of abnormal blasts, regardless of their magnitude, were used to categorize patients based on decreasing vs stable/increasing MRD levels. Of note, the proportion of patients with pre-HCT MRD was lower in the 2013 to 2019 compared with the 2006 to 2012 era. However, among the patients with pre-HCT MRD, the levels of MRD were similar across the study period, as were relapse rates in individual patient subsets, demonstrating stability of the performance of the MRD assay over time (supplemental Table 1; supplemental Figure 2).
Statistical analysis
Unadjusted probabilities of relapse-free survival (RFS; events = relapse and death) and overall survival (OS; event = death) were estimated using the Kaplan-Meier method, and probabilities of relapse and nonrelapse mortality (NRM) were summarized using cumulative incidence estimates. NRM was defined as death without prior relapse and was considered a competing risk for relapse, whereas relapse was a competing risk for NRM. Day +40 post-HCT landmark analyses for all outcomes were performed to assess the relationship with peri-HCT MRD dynamics. Associations with RFS and OS were assessed using Cox regression; cause-specific regression models were used for relapse and NRM. C-statistics were calculated for regression models.24 In multivariable models evaluating peri-HCT MRD status as 4 categories, the MRDneg/MRDpos group was excluded from models for relapse, RFS, and NRM because of unstable hazard ratio estimates caused by all patients in the subgroup having relapsed and most having relapsed by time 0 of the relapse and RFS measurements. Missing cytogenetic risk, karyotype, and CD3 chimerism data were accounted for as separate categories. Categorical patient characteristics were compared using Fisher’s exact test, and quantitative characteristics were compared with the Wilcoxon rank sum test. Two-sided P values are reported. Statistical analyses were performed using R (http://www.r-project.org).
Results
Characteristics of study cohort
We identified 892 adults meeting the inclusion criteria for our study. Of these, 19 did not agree to their data being used for research purposes and 11 did not undergo MRD testing at our institution during the pre-HCT work-up. Fifteen patients died within 40 days of HCT. Among the remaining 847 patients, 810 (95.6%) underwent early bone marrow staging studies between days +20 and +40 after allografting following MAC (n = 515), RIC (n = 88), or NMA conditioning (n = 207) and were included in our analyses of early peri-HCT dynamics. Because of the relatively small number of patients undergoing RIC, we focused our main analyses on the comparison of MAC vs non-MAC. Table 1 summarizes the characteristics of this study population, donors, and HCTs, both overall and separately for MAC and non-MAC (for RIC vs NMA; supplemental Table 2). The proportion of patients with a positive MRD test before HCT was similar for MAC vs non-MAC (P = .78). However, consistent with our institutional approach to prioritize MAC unless significant comorbidities are present, patients differed significantly regarding many characteristics, including age at diagnosis and HCT (P < .001), WBC count at diagnosis (P = .0013), proportion of secondary AML (P < .001), HCT-specific comorbidity index score (P < .001), blood count recovery before HCT (P = .0018), and type of stem cell source/HLA matching (both P < .001) between MAC and non-MAC. Some of these characteristics are independently associated with post-HCT outcomes (see results from multivariable models).
Pre-HCT demographic and clinical characteristics of study cohort, stratified by conditioning intensity (MAC vs non-MAC)
| MAC (n = 515) | Non-MAC (n = 295) | All patients (n = 810) | P | |
|---|---|---|---|---|
| Median age at diagnosis (range), y | 48.0 (16.7-71.3) | 64.5 (19.4-77.2) | 53.8 (16.7-77.2) | <.001 |
| Median age at HCT (range), y | 48.5 (18.1-72.6) | 65.2 (20.0-79.5) | 54.5 (18.1-79.5) | <.001 |
| Male sex, n (%) | 265 (51) | 167 (57) | 432 (53) | .16 |
| Median WBC at diagnosis (range), ×103/µL | 9.4 (0.2-297.2) | 4.4 (0.2-347.5) | 8.1 (0.2-347.5) | .0014 |
| Cytogenetics at diagnosis, n (%) | .66 | |||
| Favorable | 38 (7) | 15 (5) | 53 (7) | |
| Intermediate | 331 (64) | 193 (65) | 524 (65) | |
| Adverse | 125 (24) | 75 (25) | 200 (25) | |
| Missing | 21 (4) | 12 (4) | 33 (4) | |
| Secondary AML, n (%) | 110 (21) | 108 (37) | 218 (27) | <.001 |
| Disease status at HCT, n (%) | .61 | |||
| First remission | 389 (76) | 228 (77) | 617 (76) | |
| Second remission | 126 (24) | 67 (23) | 193 (24) | |
| Median remission duration before HCT (range), d | 98 (7-485) | 105 (11-788) | 100 (7-788) | .27 |
| Pre-HCT MRD status, n (%) | .78 | |||
| MRDneg | 411 (80) | 238 (81) | 649 (80) | |
| MRDpos | 104 (20) | 57 (19) | 161 (20) | |
| Post-HCT MRD status day +20-40, n (%) | <.001 | |||
| MRDneg | 493 (96) | 256 (87) | 749 (92) | |
| MRDpos | 22 (4) | 39 (13) | 61 (8) | |
| Early peri-HCT MRD dynamics (dichotomized), n (%) | <.001 | |||
| MRDneg/MRDneg | 408 (79) | 223 (76) | 631 (78) | |
| MRDneg/MRDpos | 3 (1) | 15 (5) | 18 (2) | |
| MRDpos/MRDneg | 85 (17) | 33 (11) | 118 (15) | |
| MRDpos/MRDpos | 19 (4) | 24 (8) | 43 (6) | |
| Early peri-HCT MRD dynamics (continuous), n (%) | <.001 | |||
| MRDneg | 408 (79) | 223 (76) | 631 (78) | |
| MRDdecreasing | 99 (19) | 44 (15) | 143 (18) | |
| MRDstable/increasing | 8 (2) | 28 (9) | 36 (4) | |
| Median time from pre-HCT MRD testing to HCT (range), days | 25 (7-68) | 21 (6-94) | 22 (6-94) | <.001 |
| Pre-HCT MRDneg | 25 (7-68) | 21 (6-94) | 23 (6-94) | .046 |
| Pre-HCT MRDpos | 23.5 (7-65) | 19 (8-42) | 22 (8-55) | |
| Recovered peripheral blood counts before HCT,* n (%) | 394 (77) | 195 (66) | 589 (73) | .0018 |
| Cytogenetics before HCT, n (%) | .48 | |||
| Normalized karyotype | 213 (41) | 106 (36) | 319 (39) | |
| Abnormal karyotype | 80 (16) | 48 (16) | 128 (16) | |
| Non-informative karyotype† | 204 (40) | 130 (44) | 334 (41) | |
| Missing | 18 (4) | 11 (4) | 29 (4) | |
| Post-HCT PB CD3 chimerism day +20-40, n (%) | <.001 | |||
| Full (≥95%) | 232 (45) | 103 (35) | 335 (41) | |
| Mixed (<95%) | 73 (14) | 157 (53) | 230 (28) | |
| Missing | 210 (41) | 35 (12) | 245 (30) | |
| HCT comorbidity index, n (%) | <.001 | |||
| 0-1 | 183 (36) | 58 (20) | 241 (30) | |
| 2-3 | 206 (40) | 110 (37) | 316 (39) | |
| ≥4 | 126 (24) | 127 (43) | 253 (31) | |
| Unrelated donor, n (%) | 344 (67) | 233 (79) | 577 (71) | <.001 |
| HLA matching, n (%) | <.001 | |||
| 10/10 HLA-identical related donor | 158 (31) | 47 (16) | 205 (25) | |
| 10/10 HLA-matched unrelated donor | 218 (42) | 167 (57) | 385 (48) | |
| 9/10 HLA-matched unrelated donor | 49 (10) | 36 (12) | 85 (10) | |
| HLA-haploidentical donor | 9 (2) | 13 (4) | 22 (3) | |
| UCB | 81 (16) | 32 (11) | 113 (14) | |
| Source of stem cells, n (%) | <.001 | |||
| PB | 372 (72) | 256 (87) | 628 (78) | |
| BM | 62 (12) | 7 (2) | 69 (9) | |
| UCB | 81 (16) | 32 (11) | 113 (14) | |
| GVHD prophylaxis, n (%) | <.001 | |||
| CNI + MMF ± sirolimus | 157 (31) | 252 (85) | 409 (50) | |
| CNI + MTX ± other | 289 (56) | 19 (6) | 308 (38) | |
| PTCy | 56 (11) | 23 (8) | 79 (10) | |
| Other | 13 (3) | 1 (0) | 14 (2) |
ANC, absolute neutrophil count; BM, bone marrow; CNI, calcineurin inhibitor; GVHD, graft-versus-host disease; MMF, mycophenolate mofetil; MTX, methotrexate; PB, peripheral blood; PTCy, posttransplantation cyclophosphamide; UCB, umbilical cord blood.
ANC ≥ 1000/µL and platelets ≥ 100 000/µL.
Normal cytogenetics in patient with cytogenetically normal AML or missing cytogenetics at diagnosis.
Relationship between pre- or early post-HCT MRD status and outcome (day +40 landmark analyses)
In our cohort, there were 381 deaths, 270 relapses, and 150 NRM events contributing to the probability estimates for relapse, OS, RFS, and NRM. The median (range) follow-up after HCT (day +40) among survivors was 63.2 (10.9-173.5) months: 70.6 (10.9-169.8) months for MAC and 53.1 (11.3-173.5) months for non-MAC HCT patients, respectively. First, we assessed the relationship between MRD status and post-HCT outcome in day +40 landmark analyses using information from either the pre-HCT or the post-HCT MRD assay in an isolated fashion (ie, not taking peri-HCT MRD dynamics into account). One hundred sixty-one of the 810 patients (19.9%) had MRD detected during the pre-HCT assessment. Consistent with our previous studies,7,9-17 these patients had a higher risk of relapse, lower RFS, and lower OS than the 649 patients without MRD before HCT. This was true for our cohort overall (all P < .001) and the MAC and non-MAC subgroups separately (supplemental Figure 3; supplemental Figure 4; Table 2; see supplemental Table 3 for patients undergoing RIC and NMA). In the MAC cohort, 3-year RFS and OS were 71% and 74% for those without MRD at the start of HCT vs 21% and 33% for those with it, respectively. In the non-MAC cohort, 3-year RFS and OS were 45% and 53% in the pre-HCT MRD-negative cohort and 21% and 33% in those with pre-HCT MRD, respectively. At the early post-HCT disease reassessment between day +20 and day +40, 61 of the 810 patients (7.5%) had MRD. These patients had a significantly higher risk of relapse, lower RFS, and lower OS than the 749 patients without post-HCT MRD (all P < .001). In the MAC group, 3-year RFS and OS were 64% and 68% without post-HCT MRD vs 5% and 18% with it, and for the non-MAC group, it was 47% and 55% without post-HCT MRD vs 0% and 10% with it, respectively (supplemental Figure 5; Table 2; supplemental Table 3).
Outcome probabilities (with 95% confidence interval) stratified by conditioning intensity and pre- and/or post-HCT MRD status
| Cumulative incidence of relapse at 3 y | RFS at 3 y | OS at 3 y | Cumulative incidence of NRM at 100 d | Cumulative incidence of NRM at 3 y | |
|---|---|---|---|---|---|
| All patients (n = 810) | 32% (28-35%) | 54% (50-57%) | 60% (56-63%) | 3% (2-4%) | 15% (12-17%) |
| Pre-HCT MRD information only | |||||
| MRDneg (n = 649) | 23% (20-27%) | 62% (58-65%) | 66% (62-70%) | 4% (3-6%) | 15% (12-18%) |
| MRDpos (n = 161) | 65% (57-72%) | 21% (15-28%) | 33% (26-41%) | 6% (3-10%) | 15% (10-21%) |
| Post-HCT MRD information only | |||||
| MRDneg (n = 749) | 27% (24-30%) | 58% (54-61%) | 64% (60-67%) | 5% (4-7%) | 15% (13-18%) |
| MRDpos (n = 61) | 90% (78-96%) | 2% (0-8%) | 13% (6-23%) | 0% (—) | 8% (3-18%) |
| Peri-HCT MRD information | |||||
| MRDneg/MRDneg (n = 631) | 21% (18-24%) | 63% (60-67%) | 68% (64-72%) | 4% (3-6%) | 15% (13-18%) |
| MRDneg/MRDpos (n = 18) | 100% (—) | 0% (—) | 6% (0-22%) | 0% (—) | 0% (—) |
| MRDpos/MRDneg (n = 118) | 57% (47-65%) | 28% (20-36%) | 40% (30-49%) | 8% (4-13%) | 15% (10-23%) |
| MRDpos/MRDpos (n = 43) | 86% (72-94%) | 2% (0-11%) | 16% (7-29%) | 0% (—) | 12% (4-24%) |
| MRDdecreasing (n = 143) | 62% (53-69%) | 24% (17-31%) | 36% (28-45%) | 6% (3-11%) | 15% (10-21%) |
| MRDstable/increasing (n = 36) | 100% (—) | 0% (—) | 6% (1-16%) | 0% (—) | 0% (—) |
| MAC HCT (n = 515) | 28% (24-32%) | 61% (57-65%) | 66% (61-70%) | 5% (3-7%) | 11% (8-14%) |
| Pre-HCT MRD information only | |||||
| MRDneg (n = 411) | 19% (15-23%) | 71% (66-75%) | 74% (70-78%) | 4% (2-6%) | 10% (7-13%) |
| MRDpos (n = 104) | 66% (56-74%) | 21% (13-29%) | 33% (24-42%) | 7% (3-13%) | 14% (8-21%) |
| Post-HCT MRD information only | |||||
| MRDneg (n = 493) | 25% (22-29%) | 64% (59-68%) | 68% (63-72%) | 5% (3-7%) | 11% (9-14%) |
| MRDpos (n = 22) | 91% (61-98%) | 5% (0-19%) | 18% (6-36%) | 0% (—) | 5% (0-20%) |
| Peri-HCT MRD information | |||||
| MRDneg/MRDneg (n = 408) | 18% (14-22%) | 72% (67-76%) | 75% (70-79%) | 4% (2-7%) | 10% (8-14%) |
| MRDneg/MRDpos (n = 3) | 100% (—) | 0% (—) | 0% (—) | 0% (—) | 0% (—) |
| MRDpos/MRDneg (n = 85) | 61% (49-70%) | 24% (15-34%) | 35% (25-46%) | 0% (—) | 15% (9-24%) |
| MRDpos/MRDpos (n = 19) | 90% (56-98%) | 5% (0-21%) | 21% (7-41%) | 0% (—) | 5% (0-23%) |
| MRDdecreasing (n = 99) | 64% (54-73%) | 22% (14-30%) | 33% (25-44%) | 7% (3-13%) | 14% (8-22%) |
| MRDstable/increasing (n = 8) | 100% (—) | 0% (—) | 0% (—) | 0% (—) | 0% (—) |
| Non-MAC HCT(n = 295) | 37% (32-43%) | 41% (35-46%) | 49% (43-55%) | 5% (3-8%) | 22% (17-27%) |
| Pre-HCT MRD information only | |||||
| MRDneg (n = 238) | 31% (26-37%) | 45% (39-52%) | 53% (46-59%) | 5% (3-8%) | 32% (18-29%) |
| MRDpos (n = 57) | 62% (48-74%) | 21% (11-33%) | 33% (21-46%) | 4% (1-11%) | 17% (9-28%) |
| Post-HCT MRD information only | |||||
| MRDneg (n = 256) | 29% (24-35%) | 47% (41-53%) | 55% (49-61%) | 6% (3-9%) | 24% (19-29%) |
| MRDpos (n = 39) | 100% (—) | 0% (—) | 10% (3-22%) | 0% (—) | 8% (2-20%) |
| Peri-HCT MRD information | |||||
| MRDneg/MRDneg (n = 223) | 27% (21-33%) | 49% (42-55%) | 56% (49-62%) | 5% (3-9%) | 25% (19-31%) |
| MRDneg/MRDpos (n = 15) | 100% (—) | 0% (—) | 7% (0-26%) | 0% (—) | 0% (—) |
| MRDpos/MRDneg (n = 33) | 46% (28-62%) | 39% (22-55%) | 50% (31-66%) | 6% (1-18%) | 16% (6-31%) |
| MRDpos/MRDpos (n = 24) | 100% (—) | 0% (—) | 13% (3-29%) | 0% (—) | 9% (1-33%) |
| MRDdecreasing (n = 44) | 55% (39-69%) | 27% (15-42%) | 40% (25-55%) | 5% (1-14%) | 25% (19-31%) |
| MRDstable/increasing (n = 28) | 100% (—) | 0% (—) | 7% (1-20%) | 0% (—) | 7% (1-24%) |
Relationship between early peri-HCT MRD dynamics and post-HCT outcome (day +40 landmark analyses)
In a second analysis, we studied the relationship between the early peri-HCT disease burden dynamics and post-HCT outcome. Among the 161 patients with MRD before HCT, 118 (73.3%) tested negative for MRD early after HCT. Conversely, of the 649 patients without MRD before HCT, 18 (2.8%) developed new evidence of disease; of these, 4 had >5% blasts by MFC (8.9%, 40.9%, 71.6%, 94.1%), whereas 15 had <5% blasts by MFC (median: 0.95%; range: 0.005%-3%). Across the entire cohort, this resulted in 631 patients (77.9%) who had no MFC evidence of MRD before and early after HCT (ie, were MRDneg/MRDneg), 18 patients (2.2%) who were MRDneg/MRDpos, 118 patients (14.6%) who were MRDpos/MRDneg, and 43 patients (5.3%) who were MRDpos/MRDpos; the baseline characteristics of these patients are summarized in supplemental Table 4. Of the 179 patients with detectable MRD before and/or early after HCT, 143 (79.9%) had decreasing levels of MRD (MRDdecreasing) over the early peri-HCT period, whereas 36 patients (20.1%) had stable or increasing MRD levels (MRDstable/increasing) over this time. As depicted in Figure 1 and Table 2, the MRDneg/MRDneg patients had the best outcomes, with 3-year OS and RFS estimates of 68% (64%-72%) and 63% (60%-67%), respectively, and a risk of relapse of 21% (18%-24%) at 3 years. In contrast, 3-year OS, RFS, and relapse estimates were 6% (0%-22%), 0%, and 100% for MRDneg/MRDpos patients. Three-year outcome estimates for the MRDpos/MRDpos patients resembled those of MRDneg/MRDpos patients (OS: 16% [7%-29%]; RFS: 2% [0%-11%]; relapse: 86% [72%-93%]), whereas 3-year estimates for OS (40% [30%-49%]), RFS (28% [20%-36%]), and relapse (57% [47%-65%]) for the MRDpos/MRDneg patients were between those for MRDneg/MRDneg and MRDpos/MRDpos patients. In this cohort, measures of peri-HCT MRD dynamics were prognostically informative as well when MRD data were used as continuous rather than categorized variables: 3-year estimates of OS and RFS were significantly higher for the subset of MRDdecreasing than the subset of MRDstable/increasing patients (OS: 36% [28%-45%] vs 6% [1%-16%]; RFS: 24% [17%-31%] vs 0%).
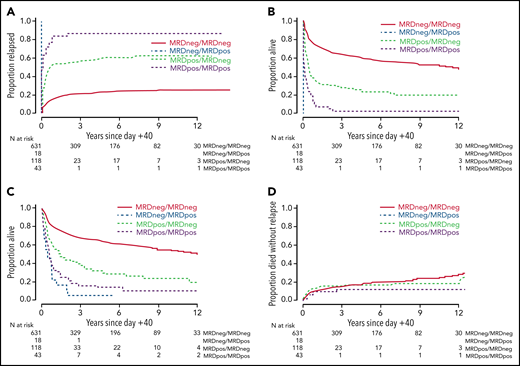
Post-HCT outcomes for 810 adults with AML undergoing allogeneic HCT while in first or second morphologic remission, stratified by early peri-HCT MRD dynamics. (A) Risk of relapse, (B) RFS, (C) OS, and (D) risk of NRM, shown for the entire study cohort.
Post-HCT outcomes for 810 adults with AML undergoing allogeneic HCT while in first or second morphologic remission, stratified by early peri-HCT MRD dynamics. (A) Risk of relapse, (B) RFS, (C) OS, and (D) risk of NRM, shown for the entire study cohort.
The likelihood of conversion of a positive MRD test before HCT to a negative test early after HCT differed across conditioning intensity. Specifically, whereas 85 of 104 (81.7%) of patients with pre-HCT MRD converted to an MRD negative state early after MAC, this was only the case for 33 of 57 patients (57.9%) after non-MAC conditioning (P = .002). Among the non-MAC patients, MRD conversion occurred in 10 of 16 patients (62.5%) after RIC and 23 of 41 patients (56.1%) after NMA HCT (P = .77). Relapse rates were high, and survival estimates were poor, for MRDpos/MRDpos and MRDneg/MRDpos patients regardless of the conditioning intensity. As expected, results were best for those who were MRDneg/MRDneg; 3-year RFS and OS were 72% and 75% with MAC and 49% and 56% in the non-MAC cohort, respectively. In the MRDpos/MRDneg patients, the 3-year RFS and OS were 24% and 35% in the MAC group and 39% and 50% in the non-MAC cohort, respectively (Figure 2; Table 2; supplemental Figure 6; supplemental Table 3).
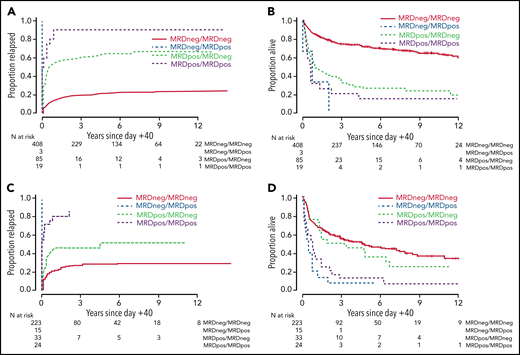
Post-HCT outcomes for 810 adults with AML undergoing allogeneic HCT while in first or second morphologic remission, stratified by early peri-HCT MRD dynamics and conditioning intensity. Risk of relapse and OS are shown separately for patients with HCT on the MAC (n = 463; A-B) and non-MAC (n = 317; C-D) regimens.
Post-HCT outcomes for 810 adults with AML undergoing allogeneic HCT while in first or second morphologic remission, stratified by early peri-HCT MRD dynamics and conditioning intensity. Risk of relapse and OS are shown separately for patients with HCT on the MAC (n = 463; A-B) and non-MAC (n = 317; C-D) regimens.
Pre-HCT and early post-HCT MRD status and early peri-HCT MRD dynamics as independent prognostic factors
To study the relationship between pre- and early post-HCT MRD status, early peri-HCT MRD dynamics, intensity of the conditioning regimen, and post-HCT outcomes in more detail, we evaluated both univariate and multivariable regression models for the end points of relapse, RFS, OS, and NRM, accounting for the covariates noted in "Patients and methods." As summarized in Table 3, univariate models showed that having MRD before HCT was associated with higher risk of relapse, lower RFS, and lower OS compared with not having pre-HCT MRD (all P < .001). Likewise, MRD detectable early after HCT was associated with higher risk of relapse, lower RFS, and lower OS compared with not having MRD (all P < .001). Compared with MRDneg/MRDneg patients, all others had higher risks of relapse, lower RFS, and lower OS, with those risks being highest in MRDneg/MRDpos patients and risks of MRDpos/MRDpos patients being between MRDneg/MRDpos and MRDpos/MRDneg patients, respectively. Consistent with the observation that outcomes for MRDpos/MRDneg patients were more disparate from the outcomes of MRDneg/MRDneg patients in the MAC than the non-MAC subgroup, there was a significant interaction between conditioning intensity and MRD conversion (interaction P values: OS: P = .001; RFS: P = .002; relapse: P = .020). We then assessed the performance of the pre-HCT MRD status, post-HCT MRD status, and peri-HCT MRD dynamics as outcome predictors for relapse, RFS, and OS by estimating C-statistics for univariate regression models. The C-statistic values were higher (indicating higher predictive accuracy) for peri-HCT MRD dynamics compared with the pre-HCT MRD status and post-HCT MRD status for relapse (0.67 vs 0.64 vs 0.61), RFS (0.62 vs 0.61 vs 0.58), and OS (0.61 vs 0.59 vs 0.56).
Univariate regression models of entire study cohort
| Relapse | RFS | OS | NRM | |||||
|---|---|---|---|---|---|---|---|---|
| HR (95% CI) | P | HR (95% CI) | P | HR (95% CI) | P | HR (95% CI) | P | |
| Pre-HCT MRD status | ||||||||
| MRDneg (n = 649) | 1 (Reference) | 1 (Reference) | 1 (Reference) | 1 (Reference) | ||||
| MRDpos (n = 161) | 4.31 (3.37-5.52) | <.001 | 3.28 (2.66-4.04) | <.001 | 2.67 (2.15-3.32) | <.001 | 1.71 (1.12-2.62) | .014 |
| Early post-HCT MRD status | ||||||||
| MRDneg (n = 749) | 1 (Reference) | 1 (Reference) | 1 (Reference) | 1 (Reference) | ||||
| MRDpos (n = 61) | 10.96 (8.06-14.91) | <.001 | 8.10 (6.11-10.74) | <.001 | 3.90 (2.92-5.21) | <.001 | 2.18 (0.89-5.35) | .089 |
| Early peri-HCT MRD dynamics | ||||||||
| MRDneg/MRDneg (n = 631) | 1 (Reference) | 1 (Reference) | 1 (Reference) | 1 (Reference) | ||||
| MRDneg/MRDpos (n = 18) | — | — | — | — | 6.24 (3.80-10.25) | <.001 | — | — |
| MRDpos/MRDneg (n = 118) | 3.93 (2.95-5.24) | <.001 | 2.91 (2.29-3.70) | <.001 | 2.48 (1.93-3.19) | <.001 | 1.60 (1.01-2.55) | .046 |
| MRDpos/MRDpos (n = 43) | 11.15 (7.70-16.15) | <.001 | 7.58 (5.44-10.57) | <.001 | 4.18 (2.96-5.89) | <.001 | 2.37 (0.96-5.85) | .06 |
| Quantitative MRD dynamics | ||||||||
| MRDneg (n = 631) | 1 (Reference) | 1 (Reference) | 1 (Reference) | 1 (Reference) | ||||
| MRDdecreasing (n = 143) | 4.46 (3.42-5.82) | <.001 | 3.23 (2.59-4.03) | <.001 | 2.56 (2.03-3.23) | <.001 | 1.63 (1.05-2.53) | .13 |
| MRDstable/increasing (n = 36) | 29.64 (19.84-44.26) | <.001 | 20.79 (14.36-30.12) | <.001 | 7.17 (4.99-10.30) | <.001 | 4.09 (0.99-16.87) | .051 |
| Post-HCT PB CD3 chimerism | ||||||||
| Full (n = 335) | 1 (Reference) | 1 (Reference) | 1 (Reference) | 1 (Reference) | ||||
| Mixed (n = 230) | 1.40 (1.06-1.85) | .019 | 1.27 (1.02-1.59) | .037 | 1.11 (0.87-1.40) | .53 | 1.07 (0.73-1.56) | .74 |
| Conditioning regimen | ||||||||
| MAC (n = 515) | 1 (Reference) | 1 (Reference) | 1 (Reference) | 1 (Reference) | ||||
| Non-MAC (n = 295) | 1.50 (1.18-1.91) | .0011 | 1.81 (1.49-2.20) | <.001 | 1.76 (1.43-2.15) | <.001 | 2.54 (1.84-3.51) | <.001 |
| Disease status | ||||||||
| First remission (n = 617) | 1 (Reference) | 1 (Reference) | 1 (Reference) | 1 (Reference) | ||||
| Second remission (n = 193) | 1.36 (1.04-1.78) | .024 | 1.41 (1.14-1.75) | .0015 | 1.50 (1.20-1.87) | <.001 | 1.52 (1.06-2.16) | .021 |
| Cytogenetic risk | ||||||||
| Favorable/intermediate (n = 577) | 1 (Reference) | 1 (Reference) | 1 (Reference) | 1 (Reference) | ||||
| Adverse (n = 200) | 2.05 (1.60-2.64) | <.001 | 1.42 (1.15-1.76) | .0013 | 1.27 (1.01-1.59) | .041 | 0.58 (0.36-0.92) | .02 |
| Age at HCT (per 10 y) | 1.09 (1.00-1.19) | .061 | 1.20 (1.11-1.29) | <.001 | 1.20 (1.11-1.30) | <.001 | 1.47 (1.29-1.69) | <.001 |
| WBC at diagnosis | 1.00 (1.00-1.00) | .76 | 1.00 (1.00-1.00) | .24 | 1.00 (1.00-1.00) | .12 | 1.00 (1.00-1.00) | .77 |
| HCT comorbidity index | ||||||||
| 0-1 (n = 241) | 1 (Reference) | 1 (Reference) | 1 (Reference) | 1 (Reference) | ||||
| 2-3 (n = 316) | 1.06 (0.79-1.41) | .71 | 1.16 (0.92-1.48) | .21 | 1.21 (0.94-1.56) | .14 | 1.41 (0.93-2.14) | .10 |
| ≥4 (n = 253) | 1.15 (0.85-1.56) | .37 | 1.34 (1.05-1.71) | .021 | 1.40 (1.08-1.82) | .01 | 1.78 (1.17-2.72) | .0077 |
| Type of AML | ||||||||
| De novo (n = 592) | 1 (Reference) | 1 (Reference) | 1 (Reference) | 1 (Reference) | ||||
| Secondary (n = 218) | 1.17 (0.90-1.52) | .24 | 1.27 (1.03-1.56) | .025 | 1.25 (1.01-1.56) | .043 | 1.45 (1.03-2.03) | .032 |
| Pre-HCT karyotype | ||||||||
| Normalized (n = 319) | 1 (Reference) | 1 (Reference) | 1 (Reference) | 1 (Reference) | ||||
| Not normalized (n = 128) | 2.27 (1.66-3.10) | <.001 | 2.19 (1.69-2.85) | <.001 | 2.05 (1.55-2.71) | <.001 | 1.96 (1.20-3.20) | .0069 |
| Pre-HCT blood counts* | ||||||||
| Recovered (n = 589) | 1 (Reference) | 1 (Reference) | 1 (Reference) | 1 (Reference) | ||||
| Not recovered (n = 221) | 1.09 (0.84-1.43) | .52 | 1.31 (1.07-1.62) | .01 | 1.38 (1.11-1.72) | .0035 | 1.80 (1.20-2.52) | <.001 |
| Stem cell source | ||||||||
| PB (n = 628) | 1 (Reference) | 1 (Reference) | 1 (Reference) | 1 (Reference) | ||||
| BM (n = 69) | 1.26 (0.85-1.86) | .25 | 1.00 (0.71-1.41) | .99 | 1.00 (0.70-1.42) | .98 | 0.58 (0.28-1.18) | .25 |
| UCB (n = 113) | 0.83 (0.57-1.21) | .33 | 0.89 (0.66-1.19) | .42 | 0.96 (0.71-1.30) | .80 | 0.98 (0.62-1.56) | .33 |
ANC, absolute neutrophil count; BM, bone marrow; CI, confidence interval; HR, hazard ratio; PB, peripheral blood; UCB, umbilical cord blood.
Recovered: ANC ≥ 1000/µL and platelets ≥ 100 000/µL; not recovered: ANC < 1000/µL and/or platelets < 100 000/µL.
Similar findings to those from the univariate models were found in the multivariable models (Table 4). In a second set of multivariable analyses, we assessed the risks of relapse, lower RFS, and lower OS of MRDneg/MRDneg patients with those of MRDdecreasing or MRDstable/increasing patients (supplemental Table 5). In these models, outcomes were best for MRDneg/MRDneg patients and worst for MRDstable/increasing patients. Outcomes for MRDdecreasing patients were in between those of MRDneg/MRDneg patients and those of MRDstable/increasing patients.
Multivariable regression models of entire study cohort (dichotomized early peri-HCT MRD dynamics)
| Relapse | RFS | OS | NRM | |||||
|---|---|---|---|---|---|---|---|---|
| HR (95% CI) | P | HR (95% CI) | P | HR (95% CI) | P | HR (95% CI) | P | |
| Early peri-HCT MRD dynamics | ||||||||
| MRDneg/MRDneg | 1 (Reference) | 1 (Reference) | 1 (Reference) | 1 (Reference) | ||||
| MRDneg/MRDpos | — | — | — | — | 5.31 (3.11-9.07) | <.001 | — | — |
| MRDpos/MRDneg | 4.34 (3.16-5.95) | <.001 | 3.06 (2.35-3.98) | <.001 | 2.45 (1.87-3.22) | <.001 | 1.36 (0.81-2.28) | .25 |
| MRDpos/MRDpos | 8.06 (5.27-12.34) | <.001 | 5.77 (3.95-8.43) | <.001 | 3.07 (2.07-4.55) | <.001 | 2.17 (0.82-5.74) | .12 |
| Post-HCT PB CD3 chimerism | ||||||||
| Full | 1 (Reference) | 1 (Reference) | 1 (Reference) | 1 (Reference) | ||||
| Mixed | 1.43 (1.02-2.02) | .037 | 1.19 (0.91-1.56) | .20 | 0.94 (0.72-1.25) | .68 | 0.90 (0.57-1.41) | .63 |
| Conditioning intensity | ||||||||
| MAC | 1 (Reference) | 1 (Reference) | 1 (Reference) | 1 (Reference) | ||||
| Non-MAC | 1.37 (0.97-1.94) | .073 | 1.57 (1.20-2.06) | .001 | 1.54 (1.16-2.05) | .003 | 1.81 (1.16-2.82) | .0093 |
| Disease status | ||||||||
| First remission | 1 (Reference) | 1 (Reference) | 1 (Reference) | 1 (Reference) | ||||
| Second remission | 1.39 (1.01-1.91) | .040 | 1.39 (1.08-1.77) | .0091 | 1.35 (1.05-1.73) | .019 | 1.45 (0.98-2.14) | .064 |
| Cytogenetic risk | ||||||||
| Favorable/intermediate | 1 (Reference) | 1 (Reference) | 1 (Reference) | 1 (Reference) | ||||
| Adverse | 1.58 (1.11-2.25) | .011 | 1.14 (0.86-1.51) | .38 | 1.23 (0.93-1.63) | .15 | 0.53 (0.31-0.92) | .024 |
| Age at HCT (per 10 y) | 0.96 (0.86-1.06) | .43 | 1.04 (0.96-1.14) | .33 | 1.06 (0.96-1.16) | .26 | 1.27 (1.07-1.49) | .0052 |
| WBC at diagnosis | 1.00 (1.00-1.00) | .041 | 1.00 (1.00-1.00) | .0032 | 1.00 (1.00-1.00) | .0062 | 1.00 (1.00-1.01) | .034 |
| HCT comorbidity index | ||||||||
| 0-1 | 1 (Reference) | 1 (Reference) | 1 (Reference) | 1 (Reference) | ||||
| 2-3 | 0.93 (0.68-1.26) | .62 | 1.01 (0.78-1.29) | .95 | 1.07 (0.82-1.39) | .62 | 1.23 (0.80-1.89) | .35 |
| ≥4 | 1.04 (0.74-1.45) | .82 | 1.12 (0.86-1.47) | .39 | 1.21 (0.92-1.59) | .17 | 1.31 (0.84-2.04) | .24 |
| Type of AML | ||||||||
| De novo | 1 (Reference) | 1 (Reference) | 1 (Reference) | 1 (Reference) | ||||
| Secondary | 0.80 (0.59-1.09) | .15 | 0.92 (0.72-1.17) | .49 | 0.99 (0.78-1.27) | .96 | 1.19 (0.81-1.75) | .37 |
| Pre-HCT karyotype | ||||||||
| Normalized | 1 (Reference) | 1 (Reference) | 1 (Reference) | 1 (Reference) | ||||
| Not normalized | 1.75 (1.23-2.49) | .002 | 1.65 (1.23-2.22) | <.001 | 1.39 (1.03-1.89) | .034 | 1.44 (0.85-2.46) | .18 |
| Pre-HCT blood counts* | ||||||||
| Recovered | 1 (Reference) | 1 (Reference) | 1 (Reference) | 1 (Reference) | ||||
| Not recovered | 0.83 (0.61-1.12) | .22 | 0.96 (0.76-1.21) | .73 | 1.12 (0.89-1.41) | .35 | 1.30 (0.90-1.89) | .16 |
| Stem cell source | ||||||||
| PB | 1 (Reference) | 1 (Reference) | 1 (Reference) | 1 (Reference) | ||||
| BM | 1.67 (1.10-2.55) | .016 | 1.46 (1.02-2.11) | .040 | 1.30 (0.89-1.89) | .18 | 0.90 (0.42-1.91) | .78 |
| UCB | 0.91 (0.59-1.41) | .69 | 1.02 (0.73-1.43) | .90 | 1.09 (0.78-1.53) | .60 | 1.31 (0.77-2.22) | .32 |
ANC, absolute neutrophil count; BM, bone marrow; CI, confidence interval; HR, hazard ratio; PB, peripheral blood; UCB, umbilical cord blood.
Recovered: ANC ≥ 1000/µL and platelets ≥ 100 000/µL; not recovered: ANC < 1000/µL and/or platelets < 100 000/µL.
Relationship between early peri-HCT MRD dynamics and post-HCT outcome in patients receiving HLA-matched allografts (day +40 landmark analyses)
Finally, because our study cohort was heterogeneous regarding patient and donor characteristics, we examined the interplay between early peri-HCT MRD dynamics, intensity of HCT conditioning, and outcomes in a subset analysis in which we restricted our dataset to the 590 patients who underwent HCT with 10/10 HLA-matched unrelated donor or 10/10 HLA-identical sibling donor allografts. Baseline characteristics of these patients, 376 and 214 of whom received MAC and non-MAC regimens, respectively, are summarized in supplemental Table 6. Overall, findings in this subset were similar to those obtained in the entire study cohort regarding outcomes of MRDneg/MRDneg, MRDneg/MRDpos, MRDpos/MRDneg, and MRDpos/MRDpos patients for the outcomes of relapse, RFS, OS, and NRM, respectively (supplemental Table 7). Like in the entire cohort, outcomes for MRDpos/MRDneg patients were more disparate from outcomes of MRDneg/MRDneg patients in the MAC than the non-MAC subgroup, with a significant interaction between conditioning intensity (MAC vs non-MAC) and MRD conversion (interaction P values: OS: P = .005; RFS: P = .003; relapse: P = .011).
Discussion
In many institutions, adults with AML in morphologic remission nowadays routinely undergo MRD testing before and/or after allografting for prognostication and possibly to guide treatment decision making. Consistent with our earlier reports7,9-17 and data from other investigators,1-4 our study finds that a positive pre- or post-HCT MRD test indeed identifies subsets of patients with substantially increased risks of relapse and inferior survival relative to patients without MRD. Extending these findings by assessing peri-HCT MRD dynamics rather than pre- or post-HCT MRD tests in isolation, our data presented herein provide new insights into the prognostic role of MRD testing in the setting of allogeneic HCT. Specifically, our analyses support 3 main conclusions. First, over the immediate post-HCT period, a significant proportion of patients with pre-HCT MRD will clear their MRD. Perhaps unsurprisingly, the likelihood of MRD conversion is higher with higher conditioning intensity than with non-MAC regimens (82% vs 58%). Second, although non-MAC regimens are less likely to clear MRD, if MRD is cleared, the impact on outcome appears greater than with MAC conditioning. Third, using information from both pre- and early post-HCT MRD testing refines prognostication over what can be accomplished with use of either pre- or post-HCT MRD testing alone.
In line with a previous report on a smaller cohort of patients,7 approximately 80% of patients with MRD during the pre-HCT disease staging will test negative for MRD around 1 month after MAC-based allografting. Presumably, over this immediate post-HCT period, MRD conversion is largely because of the anti-AML efficacy of the conditioning therapy rather than a result of an immunological graft-versus-leukemia effect. MRD conversion is also observed with non-MAC regimens, although the likelihood of this conversion is lower. It is conceivable that this relationship between the rate of early post-HCT MRD conversion and conditioning intensity is primarily a reflection of a lower anti-AML efficacy of non-MAC regimens relative to MAC. Consistent with this notion, the proportion of MRDneg/MRDpos patients was lower with MAC than non-MAC (3 of 515 [0.6%] vs 15 of 295 [5.1%]), as was the proportion of MRDincreasing/stable patients (8 of 515 [1.6%] vs 28 of 295 [9.5%]).
In our previous study, the relapse rates and survival estimates of MAC patients with early post-HCT MRD conversion appeared only minimally better than those of MRDpos/MRDpos patients.7 With a larger number of patients undergoing MAC HCT available for analyses, our current data suggest that outcomes of MRDpos/MRDneg MAC patients are indeed somewhat better than those of MRDpos/MRDpos patients, albeit overall still poor. By comparison, patients receiving non-MAC conditioning regimens who achieved early post-HCT MRD conversion had outcomes that came closer to the outcomes of the MRDneg/MRDneg patients: a notion that was supported statistically by a significant interaction in regression models between conditioning intensity and MRD conversion. In other words, our data suggest the prognostic significance of an early post-HCT MRD conversion is greater after non-MAC conditioning than after MAC. This does not imply that non-MAC regimens should be preferred; among our cohort, OS and RFS favored use of MAC, and the conversion rate for MRDpos to MRDneg was highest after MAC. Our data do, however, suggest a lesser significance of conversion after MAC compared with non-MAC HCT. Although such association studies between conditioning intensity and MRD conversion do not provide any direct mechanistic insights, and one must acknowledge the possibility of selection bias related to assigning patients to individual conditioning intensities (see below), it is interesting to speculate as to why such a relationship might exist. As one speculation, MRD conversion after lower-intensity conditioning may be a better indicator of AML cell sensitivity to, and debulking with, conditioning therapy than MRD conversion after MAC. Differences in age and disease characteristics (eg, age, WBC at diagnosis) and in the biology of leukemias (eg, with regard to proliferative capacity, allowing more or less time for graft-versus-leukemia effects to take effect) in patients undergoing MAC or non-MAC HCT may also be at play. Such differences are likely incompletely captured in analyses such as ours; however, as our multivariable analyses indicate, some of these patient/disease characteristics are independently associated with post-HCT outcomes.
Multiparameter flow cytometry–based MRD testing has been routinely performed on bone marrow specimens during the pre-HCT work-up and around 1 month after allografting in our institution for many years. Between April 2006 and December 2019, HCT outcomes and the performance of the MRD test have remained very stable (supplemental Table 1; supplemental Figure 2), allowing us to include a large number of consecutive patients in the current analyses. Results from MRD testing were always made available to transplantation teams. However, although MRD was increasingly recognized as a relevant prognostic marker over the study period, patients were assigned to different conditioning intensities primarily based on the burden of comorbidities, with preference for MAC whenever felt tolerated. A small number of patients were enrolled in trials comparing different intensities of conditioning regimens. With this, the pre-HCT MRD status typically played no major role in the selection of the type of preparative regimen. Reflecting this approach, the proportion of patients with MRD before HCT was relatively similar across the spectrum of conditioning intensities.
Post-HCT MRD testing at our institution was standardized to occur approximately 1 month after HCT. With this, our study is not suited to determine whether this time point represents the most optimal time point for post-HCT MRD assessments for adults with AML undergoing allografting. Several other limitations must be acknowledged as well. Most importantly, this is a retrospective analysis of patients assigned to different conditioning intensities in a (largely) nonrandomized fashion. Second, it is possible that the sensitivities of the MRD assay when done before and after HCT may differ for some patients considering that the normal, reference cell population differs (autologous, chemotherapy-exposed bone marrow cells vs allogeneic, typically chemotherapy-naive bone marrow cells). As another limitation, no uniform treatment strategies were pursued when AML was detected at the submicroscopic or microscopic level; therapies used included expedited withdrawal of immunosuppressive agents, donor lymphocyte infusions, treatment with azanucleosides or molecularly targeted agents, administration of intensive chemotherapy, or various combinations thereof used simultaneously or sequentially. As a fourth shortcoming, our ability to account for disease risk was limited because mutational profiles were only available for a small subset of patients and could therefore not be included. Acknowledging these limitations, our data indicate that the intensity of the HCT conditioning therapy greatly impacts the likelihood of MRD clearance over the immediate peri-HCT period. The prognostic significance of this clearance differs between the different conditioning intensities. For all intensities, however, taking into considerations peri-MRD dynamics rather than isolated pre- or post-HCT MRD assessments refines risk assessment for adults with AML transplanted in morphologic remission. Of clinical relevance, patients who have MRD before HCT have significantly worse survival expectations than those without pre-HCT MRD, even if they clear MRD in the immediate post-HCT period. As argued before,7 these data suggest that all patients with pre-HCT MRD should be considered for preemptive therapeutic strategies, ideally in the setting of well-controlled clinical trials, given their high risk of disease recurrence regardless of the early post-HCT MRD information. The data in this report provide potentially valuable information for the design of such studies.
Acknowledgments
The authors acknowledge the excellent care provided by the physicians and nurses of the HCT teams, the staff in the Long-Term Follow-up office at the Fred Hutchinson Cancer Research Center, the Hematopathology Laboratory at the University of Washington, and the patients for participating in our research protocols.
Research reported in this publication was supported by grants P01-CA078902, P01-CA018029, R01-CA175008, and P30-CA015704 from the National Cancer Institute/National Institutes of Health, Bethesda, MD.
Authorship
Contribution: G.P. and L.M.M. contributed to the collection and assembly of data and drafting of the manuscript; M.O. conducted all statistical analyses and participated in data interpretation and drafting of the manuscript; L.C.Z., R.P., G.S., and C.D. contributed to the collection and assembly of data; F.M., B.M.S., M.B., M.E.D.F., H.J.D., F.R.A., and R.S. contributed to the provision of study material, patient recruitment, and acquisition of data; R.B.W. conceptualized and designed this study and participated in data analysis and interpretation and drafting of the manuscript; and all authors revised the manuscript critically and gave final approval to submit for publication.
Conflict-of-interest disclosure: The authors declare no competing financial interests.
Correspondence: Roland B. Walter, Clinical Research Division, Fred Hutchinson Cancer Research Center, 1100 Fairview Ave N, D2-190, Seattle, WA 98109-1024; e-mail: rwalter@fredhutch.org.
Requests for data sharing may be submitted to Roland B. Walter (rwalter@fredhutch.org).
The online version of this article contains a data supplement.
The publication costs of this article were defrayed in part by page charge payment. Therefore, and solely to indicate this fact, this article is hereby marked “advertisement” in accordance with 18 USC section 1734.

This feature is available to Subscribers Only
Sign In or Create an Account Close Modal