

Key Points
MoMacs fail to mature in CGD mice, an effect driven more by the milieu than by intrinsic absence of Nox2.
Prolonged recruitment of MoMacs in CGD peritonitis results in nascent granulomata within fibrin clots at ectopic sites (eg, diaphragm).

Abstract
Loss of NADPH oxidase activity leads to altered phagocyte responses and exaggerated inflammation in chronic granulomatous disease (CGD). We sought to assess the effects of Nox2 absence on monocyte-derived macrophages (MoMacs) in gp91phox-/y mice during zymosan-induced peritonitis. MoMacs from CGD and wild-type (WT) peritonea were characterized over time after zymosan injection. Although numbers lavaged from both genotypes were virtually identical, there were marked differences in maturation: newly recruited WT MoMacs rapidly enlarged and matured, losing Ly6C and gaining MHCII, CD206, and CD36, whereas CGD MoMacs remained small and were mostly Ly6C+MHCII–. RNA-sequencing analyses showed few intrinsic differences between genotypes in newly recruited MoMacs but significant differences with time. WT MoMacs displayed changes in metabolism, adhesion, and reparative functions, whereas CGD MoMacs remained inflammatory. PKH dye labeling revealed that although WT MoMacs were mostly recruited within the first 24 hours and remained in the peritoneum while maturing and enlarging, CGD monocytes streamed into the peritoneum for days, with many migrating to the diaphragm where they were found in fibrin(ogen) clots surrounding clusters of neutrophils in nascent pyogranulomata. Importantly, these observations seemed to be driven by milieu: adoptive transfer of CGD MoMacs into inflamed peritonea of WT mice resulted in immunophenotypic maturation and normal behavior, whereas altered maturation/behavior of WT MoMacs resulted from transfer into inflamed peritonea of CGD mice. In addition, Nox2-deficient MoMacs behaved similarly to their Nox2-sufficient counterparts within the largely WT milieu of mixed bone marrow chimeras. These data show persistent recruitment with fundamental failure of MoMac maturation in CGD.
Introduction
In chronic granulomatous disease (CGD), mutations in the phagocyte NADPH oxidase resulting in diminished or absent production of reactive oxygen species (ROS) are associated with immunodeficiency against certain pathogens.1,2 Diminished NADPH oxidase activity is also associated with overexuberant inflammation, and patients with CGD often experience sterile granuloma, colitis, autoimmunity, and poor wound healing.3-5
Investigations of phagocytes from patients with CGD6-9 as well as murine models bearing mutations in the NADPH oxidase10-13 have shown that diminished ROS or changes in downstream signaling result in significantly altered functions. CGD neutrophils have diminished extracellular trap production, slowed apoptosis, and poor signaling for clearance (efferocytosis) by macrophages.14-16 Various investigations of CGD macrophages have shown them to be pro-inflammatory, often with heightened inflammasome activation, but also impaired anti-inflammatory/reparative functions, including efferocytic activity.17-19 To date, however, comprehensive in vivo analysis of specific macrophage populations over the course of inflammation in CGD are lacking, and many questions remain regarding their altered functions.
We examined sterile zymosan-induced peritonitis in gp91phox-/y mice, a model of X-linked CGD, to investigate the activities, programming, and fates of monocyte-derived macrophages (MoMacs) during inflammation. Using immunophenotyping, RNA-sequencing, labeling strategies, and histology, we found that although the total numbers of lavagable MoMacs throughout the inflammatory response are virtually identical for CGD and wild-type (WT) mice, the turnover of MoMacs (ie, recruitment and disappearance) from the peritoneal lavage is markedly increased in CGD. Furthermore, we show that these cells remain pro-inflammatory and fail to mature in a number of ways typical of WT macrophages. Instead, they appear to remain migratory, moving en masse from the peritoneal cavity to distinct sites, most notably the diaphragm, where they appear trapped in fibrinous clots and contribute to pyogranuloma formation, a process entirely absent in WT mice. Finally, using adoptive transfers between genotypes and mixed bone marrow chimeras, we show that the CGD milieu, more than intrinsic differences between the Nox2-sufficient and Nox2-deficient MoMacs, drives these alterations.
Methods
Mice and reagents
C57BL/6, CD45.1, and gp91phox-/y mice were obtained from The Jackson Laboratory and bred in-house in a specific pathogen-free facility at National Jewish Health. Ccr2−/−;dsRed mice were obtained by crossing Ccr2-/- mice (The Jackson Laboratory) with ActB-dsRed mice (Andras Nagy, Lunenfeld-Tanenbaum Research Institute). Male mice 8 to 12 weeks of age were used in accordance with protocols approved by the Institutional Animal Care and Use Committee. Experimental mice were treated with 200 μg zymosan (MilliporeSigma) via intraperitoneal (i.p.) injection. Peritoneal phagocyte labeling was performed by i.p. injection of 0.25 μM PKH 67 solution in diluent B (MilliporeSigma).
Tissue sample collection
Mice were killed by carbon dioxide asphyxiation. Peritoneal lavage was performed by using 8 mL lavage buffer (Hanks balanced salt solution/10 mM N-2-hydroxyethylpiperazine-N ′-2-ethanesulfonic acid/1 mM Ethylenediaminetetraacetic acid). Omenta and diaphragms were minced and digested with 1 mg/mL collagenase D and 100 μg/mL DNase I20 for 30 minutes or 300 μg/mL Liberase for 45 minutes, respectively (Roche/Sigma). Single-cell suspensions were created by manual homogenization and passage through a 70 μm nylon cell strainer.
Fluorescence-activated cell sorting
Single-cell suspensions were incubated with anti-CD16/32 antibody before the addition of staining antibodies (supplemental Table 1, available on the Blood Web site). Data were acquired on an LSR II or LSR Fortessa flow cytometer and analyzed by using FlowJo software (BD). Dead cells were excluded by using 1 μM Sytox dyes (Thermo Fisher Scientific). Cell sorting for RNA-sequencing was performed on a Synergy cell sorter (Sony) (supplemental Figure 2B-D). For interleukin-1β detection, mice were treated with 250 μg Brefeldin A 4 hours before harvest, and intracellular cytokine staining was performed by using the FoxP3 fixation/permeabilization kit (Thermo Fisher Scientific).
RNA-sequencing and quantitative reverse transcription polymerase chain reaction
RNA extraction from sorted cells was performed by using the RNeasy Micro kit (Qiagen). Isolated total RNA was processed for next-generation sequencing library construction as described in the supplemental Methods for analysis with an Illumina HiSeq 2500 sequencer.
For quantitative reverse transcription polymerase chain reaction, complementary DNA synthesis was performed by using SuperScript IV VILO master mix (Thermo Fisher Scientific). Quantitative polymerase chain reaction was performed by using TaqMan Fast Advanced master mix and gene expression assays, Mm00516030_m1 and Hs99999901_s1 (Applied Biosystems), for Idh1 and 18S, respectively.
Data analysis
Statistical analysis was performed in Prism version 9 (GraphPad Software) with the exception of RNA-sequencing data analysis using applications and methods developed previously,21-26 described in detail in the supplemental Methods. The pantherdb.org27 application (accessed 6 November 2020) was used to test for statistical overrepresentation of Gene Ontology Biological Processes with reference to the database mouse genome.
Immunofluorescence
Tissues were cryopreserved and fixed in 2% paraformaldehyde, 20% sucrose before freezing in Optimal Cutting Temperature media (Tissue-Tek; Sakura Finetek). Cryosections were stained with primary antibodies followed by secondary antibodies as described in supplemental Table 1. 4′,6-Diamidino-2-phenylindole was used to stain nuclei. Some tissues were processed in 10% formalin and paraffinized for hematoxylin and eosin staining. Image acquisition and analysis are described in the figure legends.
Adoptive transfer
Peritoneal lavage cells were collected from donor mice at 18 hours post–zymosan injection. Then, 2 to 6 × 10⁶ total lavage cells from CD45.1 WT or CGD donors labeled with carboxyfluorescein succinimidyl ester (MilliporeSigma) were transferred into CD45.2 recipient animals. Recipient animals were killed 24 hours after adoptive transfer.
Bone marrow chimeras
Eight-week old CD45.1 C57BL/6 recipient mice received 900 rad before intravenous reconstitution with 5 to 10 × 106 80:20 Ccr2−/−;dsRed:CD45.1 or 80:20 Ccr2−/−;dsRed:gp91phox-/y bone marrow cells. Successful chimerism and expected ratios of neutrophils and monocytes were demonstrated 4 to 6 weeks later (supplemental Figure 7A). Six weeks post-reconstitution, chimeras were treated with zymosan i.p.
Results
CGD mice display exaggerated inflammation in a zymosan-induced peritonitis model
To investigate the role of MoMacs in CGD inflammation, we adopted a sterile peritonitis model induced by i.p. zymosan injection in Nox2-sufficient C57BL/6 (WT) mice and in gp91phox-/y (CGD) mice, lacking the major subunit of the Nox2 NADPH oxidase complex.
Confirming previous reports, excessive inflammation was evident in CGD mice relative to WT mice after zymosan treatment.28,29 Weight loss in CGD mice was sustained over at least 14 days (Figure 1A). Concentrations of pro-inflammatory mediators and monocyte chemoattractants were higher in the peritoneal lavage of CGD mice, both initially and sustained over at least 72 hours (supplemental Figure 1). Neutrophils were rapidly recruited into the peritoneal cavity, with peak accumulation around 6 hours’ post-treatment in both genotypes. Thereafter, neutrophil numbers declined rapidly in WT mice; they returned to baseline levels within 72 hours but remained significantly elevated in the CGD peritoneal cavity, failing to return to pretreatment numbers within 5 days (Figure 1B). Both genotypes exhibited the well-described, almost immediate “disappearance” of Tim4+ resident peritoneal macrophages (RPMF).30,31
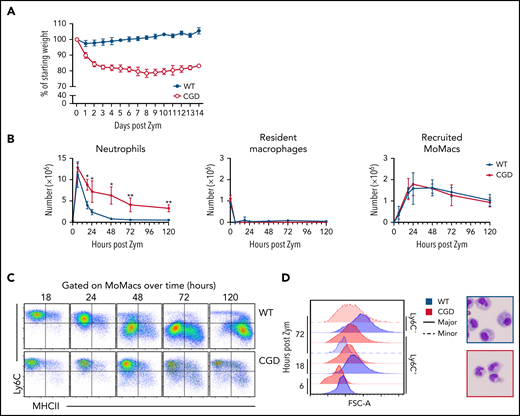
Heightened and sustained inflammation in CGD. Zymosan was delivered i.p. to WT and gp91phox-/y mice to induce peritonitis. (A) Mice were monitored for weight loss over time as a percentage of starting weight. (B) Enumeration of neutrophils, Resident peritoneal macrophages, and recruited monocyte-derived macrophages (MoMacs) from peritoneal lavage over time. Cell counts were derived from flow cytometry (as described in supplemental Figure 2) and hemocytometer counting. (C) Ly6C and MHCII expression by WT (top) and CGD (bottom) MoMacs during peritonitis. (D) MoMac cell size over time measured by forward scatter area (FSC-A) and by cytospin. Blue denotes WT cells, red denotes CGD. Filled histograms or dashed lines represent major and minor MoMac populations, respectively. Cytospins were performed at 72 hours post–zymosan injection (post Zym), and images were acquired by using an Olympus BX15 microscope at 40× original magnification (cropped images shown). Graphs show mean per group ± standard error and are representative of 5 experiments. *P < .05, **P < .01.
Heightened and sustained inflammation in CGD. Zymosan was delivered i.p. to WT and gp91phox-/y mice to induce peritonitis. (A) Mice were monitored for weight loss over time as a percentage of starting weight. (B) Enumeration of neutrophils, Resident peritoneal macrophages, and recruited monocyte-derived macrophages (MoMacs) from peritoneal lavage over time. Cell counts were derived from flow cytometry (as described in supplemental Figure 2) and hemocytometer counting. (C) Ly6C and MHCII expression by WT (top) and CGD (bottom) MoMacs during peritonitis. (D) MoMac cell size over time measured by forward scatter area (FSC-A) and by cytospin. Blue denotes WT cells, red denotes CGD. Filled histograms or dashed lines represent major and minor MoMac populations, respectively. Cytospins were performed at 72 hours post–zymosan injection (post Zym), and images were acquired by using an Olympus BX15 microscope at 40× original magnification (cropped images shown). Graphs show mean per group ± standard error and are representative of 5 experiments. *P < .05, **P < .01.
Accumulation of lavagable MoMacs (F4/80+ CD64+ Tim4–) (supplemental Figure 2A) peaked between 18 and 24 hours in both genotypes, and then gradually declined over the next 120 hours (Figure 1B). Although the total number of MoMacs recovered was similar between genotypes, further examination showed striking differences. In both genotypes, the predominant population in the first 24 hours of peritonitis expressed high levels of Ly6C consistent with recruitment of “inflammatory” monocytes from circulation (Figure 1C). From 24 to 120 hours post–zymosan injection, most of the WT MoMacs were larger in size and phenotypically differentiated, having downregulated Ly6C and gained MHCII expression, as described previously.32-35 In contrast, CGD MoMacs in the peritoneal cavity failed to undergo these changes, with the predominant population at all time points remaining smaller in size, and expressing Ly6C and little MHCII (Figure 1C-D).
Nox2-deficient monocytes fail to mature in the peritoneal cavity
To gain insight into the gene expression changes that occur during monocyte-to-macrophage differentiation during peritonitis in WT mice, and contrast this action with the apparent failure of CGD MoMacs to mature, we performed RNA-sequencing over time on MoMac subsets distinguished by different levels of Ly6C/MHCII expression. Transcripts measured in 6-hour WT MoMacs were used as a reference to identify differentially expressed genes (DEGs) (differing by at least twofold with an adjusted P value <.01) in all other samples. WT and CGD MoMacs had similar transcriptomes at 6 hours with only 58 DEGs. Over time, lavagable WT MoMacs underwent a series of changes that resulted in >3700 DEGs between the 6- and 72-hour cells (Figure 2A). CGD cells underwent markedly fewer transcriptional changes over time, regardless of their Ly6C/MHCII phenotype (2400-2800 DEGs). Indeed, for any given time point, genotype, rather than the expression of Ly6C/MHCII, was the more significant predicting factor for the number of gene expression changes. In light of this, further analyses addressed MoMacs of the predominant Ly6C/MHCII phenotype in WT or CGD mice (Ly6C+MHCII– in both genotypes at 6 and 18 hours, and CGD at 72 hours; Ly6C–MHCII– in WT at 72 hours).
![CGD MoMacs fail to mature into resolving macrophages. Next-generation RNA-sequencing was performed on MoMacs isolated from WT or CGD mice at 6, 18, and 72 hours post–zymosan injection (post Zym), sorted according to Ly6C or MHCII expression (described in supplemental Figure 2). (A) Numbers of DEGs (twofold different with adjusted P values <.01) in each sample compared with the reference 6-hour WT sample. Symbol denotes MoMac phenotype, and color indicates genotype (WT [blue] or CGD [red]). (B-C) Analysis of genes that change expression between 18 and 72 hours after zymosan injection in the major population of WT MoMacs that do not similarly change expression in CGD samples (as described in the text). Gene expression changes were separated into transcripts either downregulated in WT (by less than −1.5 log2FC) (B) or upregulated (by >1.5 log2FC) (C). Adjusted P values for differential expression in this analysis were <.05. Heat maps show triplicate samples for the major population at each time point in either WT (blue) or CGD (red). Rows are minimum (Min)–maximum (Max) scaled to highlight samples with the maximum expression of each gene and ranked from top to bottom by differential expression between WT and CGD samples at 72 hours. (D) Gene Ontology overrepresentation tests were performed on genes identified as downregulated in WT from panel B (top) or upregulated in WT from panel C (bottom). Graphs show the top 10 enriched Biological Processes by number of genes per annotation.](https://ash.silverchair-cdn.com/ash/content_public/journal/blood/139/11/10.1182_blood.2021011798/5/m_bloodbld2021011798f2.png?Expires=1765914761&Signature=tS1yxR-LhMTGlTbI8f6-SFJ2f4ene6xo63dftFUmOOS7QnNMA8Sly7ko~JGe4QIyHK3iTaz5vFntTLtCh34t8ImLvwImajvDJ4liAuDCyz2WDuo5GDnVOEVXr2zxUOSX2kuJeuVMlmUQE-CAhS0JYne-HOolMD7CTlfYBqzX4retLsYxeORvNvZ-37dpvA0~MFvyhdKFjb1cRYNvnc8lJF44tkCq1jCdFaGKCeHfFHQsaSa2UjkBNYGZW7waC0QNGPKF6Uu363ROmzf1~v3pNy1cz1LAyK-~1aUjG~6SlHuK2l2M0SCM3oG37Se2EcixnTmpXh2eWYbJRGuF-TgWuQ__&Key-Pair-Id=APKAIE5G5CRDK6RD3PGA)
CGD MoMacs fail to mature into resolving macrophages. Next-generation RNA-sequencing was performed on MoMacs isolated from WT or CGD mice at 6, 18, and 72 hours post–zymosan injection (post Zym), sorted according to Ly6C or MHCII expression (described in supplemental Figure 2). (A) Numbers of DEGs (twofold different with adjusted P values <.01) in each sample compared with the reference 6-hour WT sample. Symbol denotes MoMac phenotype, and color indicates genotype (WT [blue] or CGD [red]). (B-C) Analysis of genes that change expression between 18 and 72 hours after zymosan injection in the major population of WT MoMacs that do not similarly change expression in CGD samples (as described in the text). Gene expression changes were separated into transcripts either downregulated in WT (by less than −1.5 log2FC) (B) or upregulated (by >1.5 log2FC) (C). Adjusted P values for differential expression in this analysis were <.05. Heat maps show triplicate samples for the major population at each time point in either WT (blue) or CGD (red). Rows are minimum (Min)–maximum (Max) scaled to highlight samples with the maximum expression of each gene and ranked from top to bottom by differential expression between WT and CGD samples at 72 hours. (D) Gene Ontology overrepresentation tests were performed on genes identified as downregulated in WT from panel B (top) or upregulated in WT from panel C (bottom). Graphs show the top 10 enriched Biological Processes by number of genes per annotation.
CGD MoMacs fail to mature into resolving macrophages. Next-generation RNA-sequencing was performed on MoMacs isolated from WT or CGD mice at 6, 18, and 72 hours post–zymosan injection (post Zym), sorted according to Ly6C or MHCII expression (described in supplemental Figure 2). (A) Numbers of DEGs (twofold different with adjusted P values <.01) in each sample compared with the reference 6-hour WT sample. Symbol denotes MoMac phenotype, and color indicates genotype (WT [blue] or CGD [red]). (B-C) Analysis of genes that change expression between 18 and 72 hours after zymosan injection in the major population of WT MoMacs that do not similarly change expression in CGD samples (as described in the text). Gene expression changes were separated into transcripts either downregulated in WT (by less than −1.5 log2FC) (B) or upregulated (by >1.5 log2FC) (C). Adjusted P values for differential expression in this analysis were <.05. Heat maps show triplicate samples for the major population at each time point in either WT (blue) or CGD (red). Rows are minimum (Min)–maximum (Max) scaled to highlight samples with the maximum expression of each gene and ranked from top to bottom by differential expression between WT and CGD samples at 72 hours. (D) Gene Ontology overrepresentation tests were performed on genes identified as downregulated in WT from panel B (top) or upregulated in WT from panel C (bottom). Graphs show the top 10 enriched Biological Processes by number of genes per annotation.
Gene expression changes occurring in WT MoMacs over time are expected to show downregulation of pro-inflammatory activity and upregulation of pro-resolving functions. We focused on a set of genes that: (1) changed expression in WT MoMacs between 18 and 72 hours (by >1.5 log2FC or less than −1.5 log2FC); (2) differed in expression between WT and CGD MoMacs at 72 hours (P < .05); (3) differed in the direction or magnitude of change over time between WT and CGD samples (P < .05); and (4) were well expressed in at least one cell type (transcripts per million, >65). This analysis identified 93 genes that were strongly downregulated over time by WT MoMacs but not by CGD MoMacs and 77 genes that were strongly upregulated over time by WT MoMacs but not by CGD MoMacs (Figure 2B-C). These genes were subjected to statistical overrepresentation tests to identify biological processes that may be differentially regulated between WT and CGD MoMacs. Gene Ontology annotations such as “defense response” and “cytokine production” were enriched in the set of genes downregulated by WT MoMacs but not by CGD MoMacs. Annotations including “regulation of immune system process,” “response to stress,” and “regulation of phagocytosis” were enriched in the set of genes upregulated over time by WT MoMacs but not by CGD MoMacs (Figure 2D).
Inappropriate regulation of these biological processes might contribute to the exacerbated inflammation in CGD. Pro-inflammatory genes expressed early in both genotypes but poorly downregulated in CGD MoMacs included Il1b, Il1a, Tnf, Nos2, Ccl4, Ccl5, and Cxcl10 (Figure 3A,E). These observations corroborate previous reports in CGD human blood monocytes and CGD murine macrophages showing heightened inflammasome activation and pro-inflammatory cytokine production.7,12,17,18,35 Prolonged expression of Myd88, Tlr2, Tlr6, and Ccr2 in CGD MoMacs also suggested that these cells remained responsive to an inflammatory milieu. Expected pro-resolving molecules of WT MoMacs, not observed in CGD cells, included upregulation of transcripts for Alox15 and genes associated with clearance of debris and efferocytosis (Figures 2C and 3B).36-39 Heightened expression of CD36, MerTK, and CD206 (Mrc1) by WT MoMacs was confirmed at the level of protein expression (Figure 3F). Normal MoMac maturation also seemed to be associated with changes in adhesion molecules. WT MoMacs upregulated expression of adhesion molecules Icam2 and Bcam (Figure 3C,G), proteins prominently expressed by RPMF during homeostasis.40 Finally, the growing field of immunometabolism describes metabolic changes that support different macrophage activation states.41,42 Genes associated with glycolysis and supportive of heightened pro-inflammatory cytokine production,43,44 including Slc2a1, Irg1, Tpi1, and Pkm, were expressed in early MoMacs of both genotypes but displayed prolonged expression in CGD MoMacs (Figure 3D,H; supplemental Figure 3). Conversely, Idh1, which promotes oxidative metabolism, and several genes encoding electron transport chain components were upregulated over time in WT MoMacs but not CGD MoMacs (Figure 3D,H).
![WT and CGD MoMacs are differently programmed. Genes involved in the following biological processes were identified from RNA-sequencing data, and genes differentially expressed at least twofold between the major population of WT and CGD MoMacs at 72 hours are presented. Heat maps show differential expression of pro-inflammatory genes (A), genes associated with efferocytosis and phagocytosis (B), cell adhesion molecules and integrins (C), and metabolic genes either associated with glycolysis (top) or oxidative metabolism (below) (D). All heat maps are minimum (Min)–maximum (Max) scaled by row and show triplicate samples from the major population of WT (blue) or CGD (red) MoMacs at the indicated time points after zymosan injection. Genes are ranked by differential expression (log2FC [WT/CGD]) at 72 hours post–zymosan injection (post Zym) so that genes with the greatest differences between genotypes are at the top (higher in WT) and bottom (higher in CGD). Genes marked with an asterisk were chosen for subsequent validation. (E-G) Expression of the indicated proteins by WT and CGD MoMacs over time was confirmed by flow cytometry. Graphs show mean fluorescence intensity (MFI) of antibody staining of the major MoMac population at the time points indicated relative to isotype control staining (±standard error) and representative of 2 independent experiments with total n > 5 mice per group. *P < .05, **P < .01, ***P < .001 comparing WT and CGD at the indicated time point. (H) GLUT1 (Slc2a1) protein expression was confirmed by flow cytometry. Expression of Idh1 transcript was confirmed by quantitative reverse transcription polymerase chain reaction from independently sorted MoMacs pooled from 3 animals; data were normalized to both expression of the 18S ribosomal gene and expression of the target gene by 24-hour WT MoMacs. N.D., not detected.](https://ash.silverchair-cdn.com/ash/content_public/journal/blood/139/11/10.1182_blood.2021011798/5/m_bloodbld2021011798f3a.png?Expires=1765914761&Signature=cx0lNfO9GjKXIXgogFXIKelYwN7jVehoKJKAQf5cAb6yRai9q8uMWQ6S3mcTJ1nkHYnZTDHLl-C5r71wQ7JqniF6vF170dpZ~jupJBt1KJb~W2SKq5ipc8dvMf19pCgTBO1lOMiHwntfnnJnzpIYL3xbLwGT0cLXmGQuxHQ01bmCsgeC8C4PaWZiStRIc9gU7Yz8JfNiAoM0VUpCJ-vUUNABZTa2L2onnYwTNyT-QHrBPty465ZQxBfycNEjrbzRxWpBnrWylfc2IY-LWjOfAj6m3Kd6l-jYeTsZ5FwvdS~bxr0PCFOoVPtJ6dUgkqe5iA4o5FDMVlvhJam22i~ilg__&Key-Pair-Id=APKAIE5G5CRDK6RD3PGA)
![WT and CGD MoMacs are differently programmed. Genes involved in the following biological processes were identified from RNA-sequencing data, and genes differentially expressed at least twofold between the major population of WT and CGD MoMacs at 72 hours are presented. Heat maps show differential expression of pro-inflammatory genes (A), genes associated with efferocytosis and phagocytosis (B), cell adhesion molecules and integrins (C), and metabolic genes either associated with glycolysis (top) or oxidative metabolism (below) (D). All heat maps are minimum (Min)–maximum (Max) scaled by row and show triplicate samples from the major population of WT (blue) or CGD (red) MoMacs at the indicated time points after zymosan injection. Genes are ranked by differential expression (log2FC [WT/CGD]) at 72 hours post–zymosan injection (post Zym) so that genes with the greatest differences between genotypes are at the top (higher in WT) and bottom (higher in CGD). Genes marked with an asterisk were chosen for subsequent validation. (E-G) Expression of the indicated proteins by WT and CGD MoMacs over time was confirmed by flow cytometry. Graphs show mean fluorescence intensity (MFI) of antibody staining of the major MoMac population at the time points indicated relative to isotype control staining (±standard error) and representative of 2 independent experiments with total n > 5 mice per group. *P < .05, **P < .01, ***P < .001 comparing WT and CGD at the indicated time point. (H) GLUT1 (Slc2a1) protein expression was confirmed by flow cytometry. Expression of Idh1 transcript was confirmed by quantitative reverse transcription polymerase chain reaction from independently sorted MoMacs pooled from 3 animals; data were normalized to both expression of the 18S ribosomal gene and expression of the target gene by 24-hour WT MoMacs. N.D., not detected.](https://ash.silverchair-cdn.com/ash/content_public/journal/blood/139/11/10.1182_blood.2021011798/5/m_bloodbld2021011798f3b.png?Expires=1765914761&Signature=cHevLXmm16-KxOoN7mnNwIFE2VUfA3cyLa8SZA5lnvN30HluF46kAorkS9aE-2~pfhW37QRtUctj0cuFJOzfy7IlCHe4-49-b69H5N~DgD0bhwNnyrtbLpFA4ybGHFrJPr-J9MEnjUtd2AFsajs8xCQtKQUVAS1EKkmb1ryj3Llfr2MHxrhJLv9Gib1T6m4TlDHm0nl0f3kpCnL4y387x76oW23ONYDHd1ZshU9PjFdjT6LbXqAaJU9JKZH8lUCvyYkyR3dj-GNzZBzE6lna8ZRh1uEXe-l58NXB-5UzBLyB-xcC~XKbCMfRy0rAhwRoZgg2~7SRbRv1laESFall3Q__&Key-Pair-Id=APKAIE5G5CRDK6RD3PGA)
WT and CGD MoMacs are differently programmed. Genes involved in the following biological processes were identified from RNA-sequencing data, and genes differentially expressed at least twofold between the major population of WT and CGD MoMacs at 72 hours are presented. Heat maps show differential expression of pro-inflammatory genes (A), genes associated with efferocytosis and phagocytosis (B), cell adhesion molecules and integrins (C), and metabolic genes either associated with glycolysis (top) or oxidative metabolism (below) (D). All heat maps are minimum (Min)–maximum (Max) scaled by row and show triplicate samples from the major population of WT (blue) or CGD (red) MoMacs at the indicated time points after zymosan injection. Genes are ranked by differential expression (log2FC [WT/CGD]) at 72 hours post–zymosan injection (post Zym) so that genes with the greatest differences between genotypes are at the top (higher in WT) and bottom (higher in CGD). Genes marked with an asterisk were chosen for subsequent validation. (E-G) Expression of the indicated proteins by WT and CGD MoMacs over time was confirmed by flow cytometry. Graphs show mean fluorescence intensity (MFI) of antibody staining of the major MoMac population at the time points indicated relative to isotype control staining (±standard error) and representative of 2 independent experiments with total n > 5 mice per group. *P < .05, **P < .01, ***P < .001 comparing WT and CGD at the indicated time point. (H) GLUT1 (Slc2a1) protein expression was confirmed by flow cytometry. Expression of Idh1 transcript was confirmed by quantitative reverse transcription polymerase chain reaction from independently sorted MoMacs pooled from 3 animals; data were normalized to both expression of the 18S ribosomal gene and expression of the target gene by 24-hour WT MoMacs. N.D., not detected.
WT and CGD MoMacs are differently programmed. Genes involved in the following biological processes were identified from RNA-sequencing data, and genes differentially expressed at least twofold between the major population of WT and CGD MoMacs at 72 hours are presented. Heat maps show differential expression of pro-inflammatory genes (A), genes associated with efferocytosis and phagocytosis (B), cell adhesion molecules and integrins (C), and metabolic genes either associated with glycolysis (top) or oxidative metabolism (below) (D). All heat maps are minimum (Min)–maximum (Max) scaled by row and show triplicate samples from the major population of WT (blue) or CGD (red) MoMacs at the indicated time points after zymosan injection. Genes are ranked by differential expression (log2FC [WT/CGD]) at 72 hours post–zymosan injection (post Zym) so that genes with the greatest differences between genotypes are at the top (higher in WT) and bottom (higher in CGD). Genes marked with an asterisk were chosen for subsequent validation. (E-G) Expression of the indicated proteins by WT and CGD MoMacs over time was confirmed by flow cytometry. Graphs show mean fluorescence intensity (MFI) of antibody staining of the major MoMac population at the time points indicated relative to isotype control staining (±standard error) and representative of 2 independent experiments with total n > 5 mice per group. *P < .05, **P < .01, ***P < .001 comparing WT and CGD at the indicated time point. (H) GLUT1 (Slc2a1) protein expression was confirmed by flow cytometry. Expression of Idh1 transcript was confirmed by quantitative reverse transcription polymerase chain reaction from independently sorted MoMacs pooled from 3 animals; data were normalized to both expression of the 18S ribosomal gene and expression of the target gene by 24-hour WT MoMacs. N.D., not detected.
Thus, RNA-sequencing analysis allowed us to characterize gene expression changes over time, which, in WT MoMacs, describe normal monocyte-to-macrophage maturation. CGD MoMacs failed to sufficiently downregulate pro-inflammatory effectors, including various chemokines and chemokine receptors, or upregulate genes involved in efferocytosis and oxidative phosphorylation, or to change the use of adhesion molecules. They therefore remained both phenotypically and transcriptionally immature.
CGD MoMacs are continuously recruited to the peritoneal cavity
The immature phenotype of CGD MoMacs raised the question of whether the cells recovered in peritoneal lavage represented long-lived immature cells or recently recruited monocyte-derived cells. Injection of the monocyte/macrophage-directed dye PKH at 17 hours post–zymosan injection selectively labeled >85% of all MoMacs present in the peritoneal cavity in both genotypes within 1 hour. MoMacs labeled in WT mice persisted throughout the time course investigated, with minimal loss of label over time: 83.1% of lavagable WT MoMacs remained PKH+ 120 hours after injection (Figure 4A). Importantly, labeled Ly6C+ cells were found to be the source of the Ly6C– MoMacs recovered at later time points, consistent with their maturation in the peritoneal cavity (Figure 4B). In striking contrast, labeled MoMacs from CGD mice were rapidly lost from peritoneal lavage, with only 49.5% of MoMacs PKH+ 6 hours later, further decreasing 31 hours after labeling to 6.4%. This loss of labeled MoMacs corresponded with an increase in the number of unlabeled Ly6C+ MoMacs, exhibiting almost complete turnover of lavagable CGD MoMacs within 31 hours of labeling. Heightened MoMac turnover in CGD was sustained for at least 72 hours, as injection of PKH at either 48 or 72 hours after zymosan injection also resulted in loss of almost one-half of labeled CGD MoMacs within 6 hours (Figure 4C). Again, PKH staining was completely retained in WT MoMacs. These data show that, in contrast to WT mice, in which early recruited MoMacs persist and mature in the peritoneal cavity, in CGD mice there was prolonged recruitment of large numbers of inflammatory monocytes that maintain a constant number of MoMacs in lavage (Figure 1B).
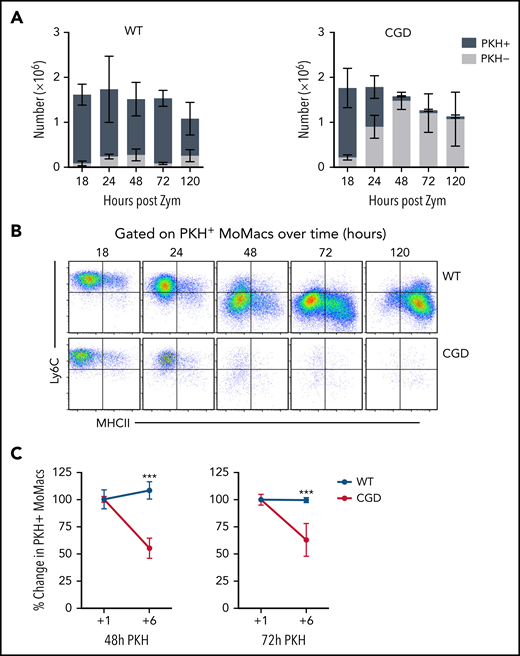
CGD MoMacs are continuously recruited into the peritoneal cavity. (A) PKH injection was performed at 17 hours post–zymosan injection (post Zym), and PKH-positive (+) and PKH-negative (–) MoMacs were enumerated at the indicated time points from WT (left) and CGD mice (right). (B) Phenotype of PKH+ MoMacs over time in WT (top) and CGD mice (bottom). (C) PKH injection was performed at either 48 (left) or 72 (right) hours post Zym, and percent PKH+ MoMacs were analyzed 1 or 6 hours later; data shown are normalized to the percent labeling 1 hour after PKH injection. All data shown are mean ± standard error of the mean and represent n = 5 to 8 mice per group, summarized from at least 2 independent experiments. ***P < .001 comparing WT and CGD.
CGD MoMacs are continuously recruited into the peritoneal cavity. (A) PKH injection was performed at 17 hours post–zymosan injection (post Zym), and PKH-positive (+) and PKH-negative (–) MoMacs were enumerated at the indicated time points from WT (left) and CGD mice (right). (B) Phenotype of PKH+ MoMacs over time in WT (top) and CGD mice (bottom). (C) PKH injection was performed at either 48 (left) or 72 (right) hours post Zym, and percent PKH+ MoMacs were analyzed 1 or 6 hours later; data shown are normalized to the percent labeling 1 hour after PKH injection. All data shown are mean ± standard error of the mean and represent n = 5 to 8 mice per group, summarized from at least 2 independent experiments. ***P < .001 comparing WT and CGD.
CGD MoMacs do not turn over or traffic via typical pathways
Both induction of apoptosis and migration into lymphatics are reportedly important mechanisms for MoMac clearance in resolving peritonitis.34,45,46 However, we found no differences between CGD and WT animals in the proportion of apoptotic or necrotic MoMacs in peritoneal lavage (Figure 5A) and no difference in susceptibility of MoMacs to death in ex vivo culture (supplemental Figure 4). Using the same PKH-labeling strategy described earlier, we found no evidence of increased trafficking to draining lymph nodes in CGD, as numbers of PKH+ MoMacs were virtually identical in the lymph nodes of both genotypes (Figure 5B). Furthermore, whereas some WT MoMacs were found adherent to the omentum, a site of interaction with lymphoid cells described for both “disappearing” RPMF and recruited MoMacs after stimulation,45,47 this was not the case for CGD MoMacs (Figure 5C). In addition, we found no reverse transmigration out of the peritoneal cavity into circulation for either genotype. These observations collectively show that the excessive turnover of CGD MoMacs was not the result of cell death in the peritoneal cavity or of typical cell trafficking.
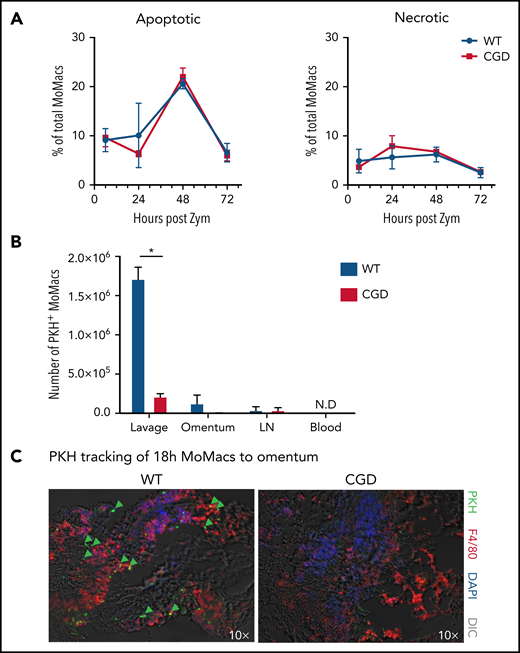
CGD MoMac turnover is not the result of cell death or migration to lymph nodes, circulation, or omenta. (A) Percentages of apoptotic (right) and necrotic (left) MoMacs were calculated from peritoneal lavage at the indicated times post–zymosan injection (post Zym) by staining with Annexin V and Sytox Blue. Data represent n = 3 to 5 mice per group; shown as mean ± standard error of the mean. (B-C) WT and CGD mice were injected with PKH at 18 hours post–zymosan injection (post Zym), and tissues were collected 24 hours later (42 hours post Zym). (B) Number of PKH+MoMacs recovered from each of the indicated tissues. Bars show mean ± standard error with n = 3 to 5 mice per group representative of 2 independent experiments (*P < .05). (C) Sections of omenta from WT (left) or CGD (right) were stained as indicated. PKH+ F4/80+ MoMacs from the peritoneal cavity are denoted by green arrows; original magnification, 10×. Images were acquired by using a Marianas fluorescence microscope and analyzed by using SlideBook software (3i). DAPI, 4′,6-diamidino-2-phenylindole; DIC, differential interference contrast; N.D., not detected.
CGD MoMac turnover is not the result of cell death or migration to lymph nodes, circulation, or omenta. (A) Percentages of apoptotic (right) and necrotic (left) MoMacs were calculated from peritoneal lavage at the indicated times post–zymosan injection (post Zym) by staining with Annexin V and Sytox Blue. Data represent n = 3 to 5 mice per group; shown as mean ± standard error of the mean. (B-C) WT and CGD mice were injected with PKH at 18 hours post–zymosan injection (post Zym), and tissues were collected 24 hours later (42 hours post Zym). (B) Number of PKH+MoMacs recovered from each of the indicated tissues. Bars show mean ± standard error with n = 3 to 5 mice per group representative of 2 independent experiments (*P < .05). (C) Sections of omenta from WT (left) or CGD (right) were stained as indicated. PKH+ F4/80+ MoMacs from the peritoneal cavity are denoted by green arrows; original magnification, 10×. Images were acquired by using a Marianas fluorescence microscope and analyzed by using SlideBook software (3i). DAPI, 4′,6-diamidino-2-phenylindole; DIC, differential interference contrast; N.D., not detected.
CGD MoMacs accumulate in fibrin clots associated with the diaphragm and form nascent pyogranulomata
Anatomical observations revealed the appearance of milky streaks on the diaphragm exclusively in CGD mice during peritonitis. Histologic examination showed the presence of pyogranulomata with clusters of neutrophils at the center surrounded by F4/80+ macrophages (Figure 6A-B). Accordingly, digests showed a dramatic accumulation of both neutrophils and MoMacs in CGD mice beginning 12 hours’ post–zymosan injection, with peak accumulation of neutrophils at 24 hours and of MoMacs at 48 hours (Figure 6C). Only a slight, transient accumulation of inflammatory cells was observed in WT mice in the first 18 hours. MoMacs recovered from digests of CGD diaphragms exhibited an immature phenotype (Figure 6D) consistent with those in peritoneal lavage. Intraperitoneal injection of PKH at 18 hours after zymosan injection labeled MoMacs associated with the diaphragm that persisted over time (Figure 6E).
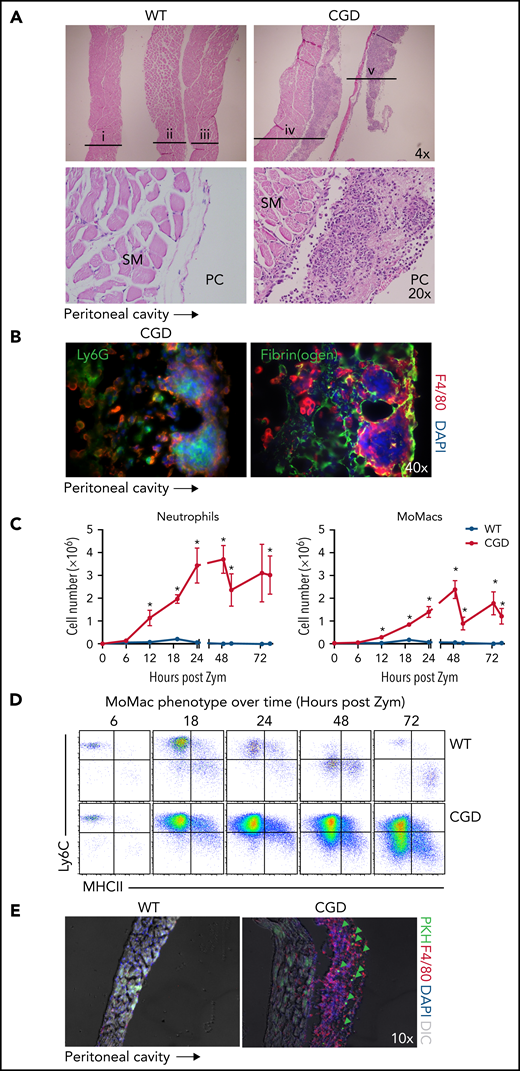
The diaphragm is a site of MoMac accumulation in CGD mice. (A) Hematoxylin and eosin–stained sections of diaphragm collected at 72 hours post–zymosan injection (post Zym) from WT (n = 3 mice shown, labeled i-iii) and CGD (n = 2 mice shown, labeled iv-v). Images captured at 4× magnification (top) or 20× (below). SM denotes diaphragm smooth muscle, PC denotes the peritoneal cavity. (B) Immunofluorescence staining of F4/80 with Ly6G (left) or Fibrin(ogen) (right) of diaphragm tissues from CGD mice at 72 hours after zymosan injection. Images were captured at 40× magnification, and orientation of the tissue with respect to the peritoneal cavity is indicated by the arrow below. (C) Quantitation of neutrophils (left) and MoMacs (right) from digests of diaphragm-associated tissues over time after zymosan injection. Graphs show mean ± standard error with n = 3 to 6 mice per group representative of 2 independent experiments. (D) Phenotype of MoMacs recovered from digests of diaphragm tissue over time post Zym. (E) Immunofluorescence analysis of diaphragm tissues from WT and CGD mice at 42 hours post Zym from animals also treated with i.p. PKH at 18 hours post Zym. Original magnification, 10×. Green arrows indicate PKH-labeled MoMacs. *P < .05. DAPI, 4′,6-diamidino-2-phenylindole; DIC, differential interference contrast.
The diaphragm is a site of MoMac accumulation in CGD mice. (A) Hematoxylin and eosin–stained sections of diaphragm collected at 72 hours post–zymosan injection (post Zym) from WT (n = 3 mice shown, labeled i-iii) and CGD (n = 2 mice shown, labeled iv-v). Images captured at 4× magnification (top) or 20× (below). SM denotes diaphragm smooth muscle, PC denotes the peritoneal cavity. (B) Immunofluorescence staining of F4/80 with Ly6G (left) or Fibrin(ogen) (right) of diaphragm tissues from CGD mice at 72 hours after zymosan injection. Images were captured at 40× magnification, and orientation of the tissue with respect to the peritoneal cavity is indicated by the arrow below. (C) Quantitation of neutrophils (left) and MoMacs (right) from digests of diaphragm-associated tissues over time after zymosan injection. Graphs show mean ± standard error with n = 3 to 6 mice per group representative of 2 independent experiments. (D) Phenotype of MoMacs recovered from digests of diaphragm tissue over time post Zym. (E) Immunofluorescence analysis of diaphragm tissues from WT and CGD mice at 42 hours post Zym from animals also treated with i.p. PKH at 18 hours post Zym. Original magnification, 10×. Green arrows indicate PKH-labeled MoMacs. *P < .05. DAPI, 4′,6-diamidino-2-phenylindole; DIC, differential interference contrast.
Detailed histologic examination revealed that the leukocytes appeared to be adherent along the peritoneal surface of the diaphragm, rather than within the structure itself or within lymphatics (supplemental Figure 5A). In CGD mice, staining for fibrin(ogen) showed that macrophages were contained within fibrin clots along the surface of the diaphragm (Figure 6B). Because earlier studies in WT mice showed that the zymosan-induced “disappearance” of RPMF from lavage was attributed to their aggregation into fibrin “clots,”31 we sought to definitively identify these cells as recruited CGD MoMacs. Accordingly, the F4/80+ cells within diaphragm clots were found to be Tim4– and not labeled by injection of PKH before zymosan delivery (supplemental Figure 5B).
Although visible accumulations of clots were not appreciated within the peritoneal cavity, close histologic examination of sections of the ventral peritoneal wall revealed rare fibrin clots containing macrophages observed in CGD mice but not seen in WT animals (supplemental Figure 5C). These findings led us to propose that CGD MoMacs are likely sequestered in microscopic fibrin clots throughout the peritoneal cavity, most noticeably (although not exclusively) associated with the diaphragm.
Phenotypic maturation and behavior of early MoMacs are determined by their environment
Finally, we questioned whether the failure of CGD MoMac maturation and their heightened turnover were attributable to the loss of MoMac-intrinsic Nox2 activity or driven by the inflammatory milieu in Nox2-deficient animals. We designed 2 models wherein CGD and WT cells were assessed within the inflamed peritoneum of the same mouse.
In the first model, adoptive transfer of total peritoneal cells was performed crisscrossed between genotypes at 18 hours post–zymosan injection, a time when WT and CGD MoMacs are both relatively phenotypically immature and proinflammatory. MoMacs (0.5 to 1 × 10⁶ ) were transferred at a time when there were ∼1.5 × 10⁶ endogenous MoMacs in the peritoneal cavity. In all cases, transferred MoMacs recovered 24 hours later were found to phenotypically resemble those of the recipients’ endogenous MoMacs (Figure 7A). Thus, transplant of CGD cells into WT mice restored the ability of these cells to downregulate Ly6C (Figure 7B), whereas WT MoMacs failed to undergo phenotypic maturation when transferred into CGD mice. Furthermore, transferred MoMacs were poorly retained in the CGD peritoneal cavity, with only 2% of transferred MoMacs recoverable by lavage 24 hours after transplant regardless of donor genotype (Figure 7C). Supporting the previous distribution experiments, MoMacs transferred into CGD recipients displayed some accumulation at the diaphragm and little movement toward the omentum (Figure 7D). In contrast, MoMacs transferred into WT recipients exhibited better recovery in peritoneal lavage and preferential accumulation in the omentum but not the diaphragm (Figure 7E; supplemental Figure 6).
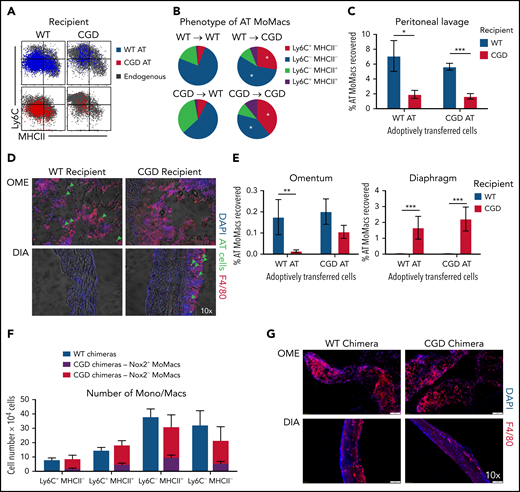
External milieu drives MoMac behavior. Total peritoneal lavage cells were isolated from donor mice at 18 hours post–zymosan injection and adoptively transferred (AT) into peritonea of time-matched recipient mice. Recovery and phenotype of AT MoMacs were assessed 24 hours after adoptive transfer (42 hours post–zymosan injection). (A) Phenotype of MoMacs from WT (blue) or CGD (red) donor mice AT into WT (left) or CGD (right) recipient animals, overlaid onto MoMacs of the recipient animal (gray). (B) Pie charts show the percentage of total AT MoMacs with the indicated phenotype. Reported statistics represent results of analysis with reference to the transfer of WT PL cells into WT recipient animals. (C) Recovery in peritoneal lavage of AT MoMacs as a percentage of the input MoMac number, from either WT (blue) or CGD (red) recipient animals. (D) Immunofluorescence analysis of omentum (OME, top) and diaphragm (DIA, bottom) tissues stained as indicated. Green arrows indicate the location of AT CGD MoMacs in WT omentum and associated with CGD diaphragm. Original magnification, 10×. (E) Recovery of AT MoMacs in omentum (left) or diaphragm (right) digests analyzed by flow cytometry. Note difference in the y-axis. (F and G) WT and CGD mixed bone marrow chimeras (supplemental Figure 7 describes experimental design) were administered i.p. zymosan and harvested at 96 hours after zymosan injection. Peritoneal lavage fluid was assessed by flow cytometry, and diaphragm and omentum were assessed by immunofluorescence. (F) Number of MoMacs, subsetted based on Ly6C and MHCII expression, in WT (blue) and CGD (red and purple) chimeras. MoMacs within the CGD chimeras were further separated based on Nox2 expression, either Nox2-sufficient (purple) or Nox2-deficient (red). (G) Immunofluorescence staining of omentum (left) and diaphragm (right) from WT (top) and CGD (bottom) mixed chimeras. All images were 10× original magnification; they were acquired by using an Olympus VS200 and analyzed by using VS200 ASW software. All data represent 8 to 10 mice per group over 2 to 3 independent experiments. Error bars indicate standard error of the mean. *P < .05, **P < .01, ***P < .001. DAPI, 4′,6-diamidino-2-phenylindole; DIC, differential interference contrast.
External milieu drives MoMac behavior. Total peritoneal lavage cells were isolated from donor mice at 18 hours post–zymosan injection and adoptively transferred (AT) into peritonea of time-matched recipient mice. Recovery and phenotype of AT MoMacs were assessed 24 hours after adoptive transfer (42 hours post–zymosan injection). (A) Phenotype of MoMacs from WT (blue) or CGD (red) donor mice AT into WT (left) or CGD (right) recipient animals, overlaid onto MoMacs of the recipient animal (gray). (B) Pie charts show the percentage of total AT MoMacs with the indicated phenotype. Reported statistics represent results of analysis with reference to the transfer of WT PL cells into WT recipient animals. (C) Recovery in peritoneal lavage of AT MoMacs as a percentage of the input MoMac number, from either WT (blue) or CGD (red) recipient animals. (D) Immunofluorescence analysis of omentum (OME, top) and diaphragm (DIA, bottom) tissues stained as indicated. Green arrows indicate the location of AT CGD MoMacs in WT omentum and associated with CGD diaphragm. Original magnification, 10×. (E) Recovery of AT MoMacs in omentum (left) or diaphragm (right) digests analyzed by flow cytometry. Note difference in the y-axis. (F and G) WT and CGD mixed bone marrow chimeras (supplemental Figure 7 describes experimental design) were administered i.p. zymosan and harvested at 96 hours after zymosan injection. Peritoneal lavage fluid was assessed by flow cytometry, and diaphragm and omentum were assessed by immunofluorescence. (F) Number of MoMacs, subsetted based on Ly6C and MHCII expression, in WT (blue) and CGD (red and purple) chimeras. MoMacs within the CGD chimeras were further separated based on Nox2 expression, either Nox2-sufficient (purple) or Nox2-deficient (red). (G) Immunofluorescence staining of omentum (left) and diaphragm (right) from WT (top) and CGD (bottom) mixed chimeras. All images were 10× original magnification; they were acquired by using an Olympus VS200 and analyzed by using VS200 ASW software. All data represent 8 to 10 mice per group over 2 to 3 independent experiments. Error bars indicate standard error of the mean. *P < .05, **P < .01, ***P < .001. DAPI, 4′,6-diamidino-2-phenylindole; DIC, differential interference contrast.
Second, we created mixed chimeras in which MoMacs were largely Nox2-deficient but other cells (e.g. neutrophils) were largely Nox2-sufficient. Ccr2–/– bone marrow was used in an 80:20 mixture with either CGD or WT bone marrow transferred into irradiated WT mice (hereafter CGD or WT chimeras, respectively) (supplemental Figure 7A). Naive chimeric mice displayed the expected ratios of bone marrow and blood leukocyte reconstitution. 96 hours post–zymosan injection, the neutrophilia characteristic of CGD mice was not seen in the CGD chimeras, and neutrophil numbers were very similar to those of WT chimeric mice (supplemental Figure 7C). In CGD chimeras, DsRed expression by CD45.2+ neutrophils confirmed that the majority were indeed Nox2-sufficient (mean, 66.3 ± 5.5%) (supplemental Figure 7B). Both CGD and WT chimeras had nearly identical total numbers of MoMacs present, and importantly, both showed identical MoMac maturation with respect to Ly6C and MHCII expression (Figure 7F). Within the CGD chimeras, peritoneal MoMacs were 74.1 ± 12.7% Nox2-deficient (CCR2+), and comparison of Nox2+ and Nox2– MoMacs within the same mouse showed only subtle differences in the proportions of Ly6C+MHCII– and Ly6C–MHCII+ cells. In addition, CGD chimeric mice had minimal weight loss similar to WT chimera control mice and WT nonchimeric mice (Figure 1A; supplemental Figure 7C), and they exhibited no evidence of granulomata formation at the diaphragm (Figure 7G).
In summary, these experiments showed that CGD MoMacs are capable of normal phenotypic maturation and behavior in an environment in which WT cells predominate among non-macrophages. Furthermore, in the presence of other Nox2-sufficient cells, CGD MoMacs, potentially providing their own proinflammatory contributions to the milieu, are insufficient to drive the hyperinflammatory responses characteristic of CGD mice, including neutrophilia, lack of MoMac phenotypic maturation, and granulomata formation. As such, we propose that the behavior of MoMacs arriving in the peritoneal cavity during inflammation is driven more by the preexisting external milieu therein, rather than a direct consequence of Nox2 activity within the MoMacs themselves.
Discussion
Neutrophil and monocyte trafficking into the zymosan-inflamed peritoneal cavity appears to be very similar between WT and CGD mice initially, but thereafter, resolution of inflammation fails in CGD mice. As such, the current model offers a unique window to investigate the events that lead to prolonged, nonresolving inflammation in CGD. Our focus was investigation of the programming and behavior of macrophages, specifically those derived from recruited blood monocytes (MoMacs), so as to better understand their contribution to exaggerated inflammation in CGD. Within hours of zymosan injection, the bulk of recruited WT MoMacs increased in size, lost Ly6C, and ultimately gained MHCII, similar to findings in other inflamed tissues (eg, liver, heart).33,48 Notably, this maturation largely fails in CGD MoMacs lavaged from the peritoneum as well as in those recovered from tissue digests of the omentum and diaphragm. RNA-sequencing analysis allowed more in-depth investigation: WT MoMacs transition from inflammatory to resolving macrophages capable of efferocytosis and other reparative functions required for resolution of inflammation.34,35,49 By contrast, CGD MoMacs at all time points were pro-inflammatory and migratory, as would be expected of monocytes newly recruited from the circulation into inflamed tissues.
PKH labeling of CGD MoMacs confirmed heightened turnover, with persistent recruitment of new monocytes and then disappearance of MoMacs from lavage continuing for at least 72 hours. This finding was in stark contrast to MoMacs of WT mice, in which >80% were recruited to the peritoneum by 18 hours post–zymosan injection, remained lavagable from the peritoneum, and matured at this site. The nearly identical numbers of MoMacs lavagable from the peritoneal cavities in both genotypes suggest some regulation of this cellular niche, although potential mechanism(s) remain unexplored.
Given the continuous accumulation of new CGD MoMacs into the peritoneum in the face of no overall increase in lavagable cells, their fates within the peritoneum were explored. Heightened cell death shown for blood monocytes lacking ROS production50 was not evident in the lavaged cells nor supported by shortened survival ex vivo. Tracking endogenous PKH-stained MoMacs or exogenous MoMacs after adoptive transfer showed that many appeared to accumulate at the diaphragm, an area known to develop rich lymphatic networks in chronic inflammation.51,52 However, we found no obvious migration of MoMacs within lymphatics or enhanced accumulation in draining lymph nodes in CGD (Figure 5B; supplemental Figure 6A-B). Instead, most MoMacs appeared to be caught within the fibrin(ogen)-rich mesh overlying the peritoneal surface of the diaphragm, encircling clusters of neutrophils forming nascent pyogranulomata characteristic of CGD. Based on the early arrival of neutrophils at this site, we hypothesize that they attract MoMacs, although their role in this and the signals underlying MoMac attraction have yet to be identified. In addition, we hypothesize that it is failure of MoMacs to clear neutrophils that likely underlies the pyogranulomata formation and persistence. This theory is supported by earlier studies indicating deficient efferocytic capability in CGD macrophages16,19 and our RNA-sequencing data showing poor representation of efferocytosis-related transcripts in CGD relative to WT MoMacs. Elegant studies by Bagaitkar et al53 have also shown that CGD MoMacs are inefficient in the digestion of apoptotic neutrophils and, similarly, a role for Nox2 has been shown in the events of LC-3–associated phagocytosis in macrophages.54 Interestingly, our RNA-sequencing data indicate that CGD MoMacs exhibit transcriptional differences related to lysosomal content and maturation compared with WT (not shown). These observations, together with previous investigations showing that CGD neutrophils, activated and apoptotic, present deficient “eat me” signals,55-58 support a model for newly forming pyogranuloma to be investigated in future studies.
Given the documented hyperresponsiveness of CGD MoMacs to various inflammatory stimuli, we expected that CGD MoMacs might be significant contributors to exacerbated inflammation. However, CGD MoMacs adoptively transferred to the WT inflamed peritonea exhibited enhanced immunophenotypic maturation, lavagability, and movement to the omentum, likely to the so-called milky spots.47,59 Furthermore, in mixed bone marrow chimeric mice in which MoMacs were largely Nox2-deficient but other cells (eg, neutrophils) were largely Nox2-sufficient, CGD MoMacs phenotypically matured similarly to their WT counterparts within the same mouse. These chimeric mice did not exhibit hyperinflammatory responses such as sustained neutrophilia and granulomata formation seen in CGD mice, suggesting that Nox2-deficient MoMacs are not sufficient to drive these responses. Together, these observations, along with the RNA-sequencing analysis of freshly recruited MoMacs, strongly suggest that the behavior of CGD MoMacs depends more on the inflammatory milieu and specifically on factors extrinsic to the MoMacs themselves. Which constituent(s) of the CGD milieu drive these abnormalities, whether an excess of pro-inflammatory mediators, a lack of anti-inflammatory signals, or both, and the leukocyte(s) responsible for their production, have yet to be defined and will be investigated in future studies. A thorough understanding of such mechanisms has implications for future gene therapies in which the promise of targeting specific cells and tuning the level of Nox2 reconstitution may be key to successful treatment.60,61
Acknowledgments
This work was supported by the National Institute of Allergy and Infectious Diseases (RAI141389, D.L.B., T32 AI740529, K.H.) and National Heart, Lung and Blood Institute (RHL149741A, P.M.H.).
Authorship
Contribution: S.L.G., K.C.H., H.N., S.C.F., and T.H.G. collected data; S.L.G., B.V., K.J.M., and T.D. analyzed the data; S.L.G., K.C.H., H.N., P.M.H., and D.L.B. interpreted data and wrote the manuscript. All authors helped design the research, with the original concept proposed by S.C.F. All authors edited the manuscript.
Conflict-of-interest disclosure: The authors declare no competing financial interests.
Correspondence: Sophie Gibbings, National Jewish Health, 1400 Jackson St, Denver, CO 80206; e-mail: Gibbingss@njhealth.org.
RNA-sequencing data are available at Gene Expression Omnibus (https://www.ncbi.nlm.nih.gov/geo/) under accession number GSE166542.
The online version of this article contains a data supplement.
There is a Blood Commentary on this article in this issue.
The publication costs of this article were defrayed in part by page charge payment. Therefore, and solely to indicate this fact, this article is hereby marked “advertisement” in accordance with 18 USC section 1734.

This feature is available to Subscribers Only
Sign In or Create an Account Close Modal