

Key Points
Risk factors for POD24 included male sex, poor performance status, high-risk FLIPI score, and elevated β2-microglobulin.
We validated POD24 as a significant prognostic marker among >5000 patients on 13 international clinical trials.

Abstract
Observational studies and stand-alone trials indicate that patients with follicular lymphoma (FL) who experience disease progression within 24 months of front-line chemoimmunotherapy (POD24), have poor outcomes. We performed a pooled analysis of 13 randomized clinical trials of patients with FL in the pre- and postrituximab eras to identify clinical factors that predict POD24. Logistic regression models evaluated the association between clinical factors and POD24. Cox regression evaluated the association between POD24 as a time-dependent factor and subsequent overall survival (OS). A landmark analysis evaluated the association of POD24 with OS for the subset of patients who were alive at 24 months after trial registration. Patients without progression at 24 months at baseline had favorable performance status (PS), limited-stage (I/II) disease, low-risk FL International Prognostic Index (FLIPI) score, normal baseline hemoglobin, and normal baseline β2 microglobulin (B2M) level. In a multivariable logistic regression model, male sex (odds ratio [OR], 1.30), PS ≥2 (OR, 1.63), B2M (≥3 mg/L; OR, 1.43), and high-risk FLIPI score (3-5; OR, 3.14) were associated with increased risk of progression before 24 months. In the time-dependent Cox model and the 24-month landmark analysis, POD24 was associated with poor subsequent OS (hazard ratio, 4.85 and 3.06, respectively). This is the largest pooled analysis of clinical trials data validating POD24 as a robust indicator of poor FL survival and identified clinical predictors of early death and progression that can aid in building comprehensive prognostic models incorporating clinical and molecular predictors of POD24.
Introduction
Follicular lymphoma (FL) is the most frequently occurring indolent non-Hodgkin lymphoma (NHL) and has generally favorable outcomes.1 However, subsets of patients have a clinically variable course and experience multiple relapses, transformation to a more aggressive histology, or early disease progression.2 Early FL relapse, defined as recurrence or progression of disease within 24 months of front-line treatment (POD24), has been noted to occur in ∼20% of patients who receive first-line chemoimmunotherapy and is associated with particularly poor outcomes. Five-year overall survival (OS) ranges from 34% to 50% at 5 years compared with 90% for those without early disease recurrence.3 Clinical and biologic predictors of POD24 are currently being studied, although there are no markers for uniform implementation at diagnosis for risk-adapted therapy.
Given these limitations, we chose to investigate whether clinical factors could be identified at the time of diagnosis that could assist the treating physician in identifying patients at high risk for poor future outcome. To this end, we performed a pooled analysis of 13 randomized clinical trials of patients in both the pre- and postrituximab eras using the Follicular Lymphoma Analysis of Surrogate Hypothesis (FLASH) data, which includes individual patient data from randomized controlled trials of first-line therapy in FL that involved treatments including rituximab only, rituximab+chemoimmunotherapy (R-chemo), and chemotherapy alone (chemo).
Patients and methods
We analyzed individual patient data from 5225 patients enrolled in 13 multicenter international randomized controlled trials of active treatment in previously untreated FL. Logistic regression models were used to evaluate the association between Follicular Lymphoma International Prognostic Index (FLIPI) risk category, sex, β2 microglobulin level (B2M), and performance status (PS) with POD24. Cox regression, with POD24 as a time-dependent covariate, was used to evaluate the association between POD24 and subsequent OS. Based on availability and input from investigators, baseline factors considered for inclusion in this model include sex, performance status, FLIPI risk category, and baseline B2M level. A landmark analysis was also conducted to evaluate the association of POD24 on overall survival (OS) for patients who were alive at 24 months after trial registration. B2M data were available for 9 of the 13 studies, enabling additional analyses including B2M, along with other baseline factors, to be conducted on this subset of patients. A sensitivity analysis was included to evaluate findings within the different induction treatment regimens (chemo, R-chemo, and rituximab), and an additional logistic regression model was used to evaluate the association between clinical factors (same as the POD24 model) and progression of disease or death within 24 months of front-line therapy (PFS24). The PFS24 model differed from the POD24 model by treating death within 24 months of treatment as an event, instead of excluding those patients from the model. To estimate the effect of maintenance treatment with rituximab on POD24 and subsequent OS on the subset of 3 trials that included maintenance randomization, a maintenance rituximab variable was added to the logistic regression and time-dependent Cox regression models. An α of .05 was used to classify effects as statistically significant. The proportional hazards assumption was evaluated for all variables included in the Cox model by using a time interaction test.
The studies included in FLASH were conducted in accordance with The Declaration of Helsinki.
Results
Patient characteristics
We analyzed data from 10 induction and 3 maintenance randomized trials. One hundred seventy-five patients were excluded from the trials because they were censored for clinical follow-up before 24 months, leaving 5225 evaluable patients (Table 1). Of those, 29.3% (n = 1531) progressed and 2.5% (n = 130) died within 24 months of trial registration. Most patients (62.5%) received anthracyclines and rituximab (53.2%). Table 1 summarizes patient-level baseline characteristics classified by POD24 status. Patients without progression at 24 months more commonly had favorable PS, limited stage, low-risk FLIPI score, and normal baseline hemoglobin and B2M levels.
Patient baseline characteristics by POD24 status
| Died | Progressed within 24 months | Alive and progression free | Total | |
|---|---|---|---|---|
| (n = 130) | (n = 1531) | (n = 3564) | (n = 5225) | |
| Age | ||||
| Mean (SD) | 60.4 (11.01) | 55.2 (11.14) | 55.0 (11.13) | 55.2 (11.16) |
| Median (range) | 62.0 (29.0-81.0) | 56.0 (17.0-84.0) | 56.0 (19.0-90.0) | 56.0 (17.0-90.0) |
| Sex, n (%) | ||||
| Female | 50 (38.5) | 697 (45.5) | 1811 (50.8) | 2558 (49.0) |
| Male | 80 (61.5) | 834 (54.5) | 1753 (49.2) | 2667 (51.0) |
| Performance status, n (%) | ||||
| 0-1 | 90 (76.3) | 1372 (91.5) | 3315 (95.5) | 4777 (93.9) |
| ≥2 | 28 (23.7) | 127 (8.5) | 158 (4.5) | 313 (6.1) |
| Data missing | 12 | 32 | 91 | 135 |
| Rituximab, n (%) | ||||
| No | 85 (68.5) | 896 (59.1) | 1450 (40.8) | 2431 (46.8) |
| Yes | 39 (31.5) | 619 (40.9) | 2106 (59.2) | 2764 (53.2) |
| Data missing | 6 | 16 | 8 | 30 |
| Anthracycline, n (%) | ||||
| No | 61 (49.2) | 689 (45.5) | 1196 (33.6) | 1946 (37.5) |
| Yes | 63 (50.8) | 826 (54.5) | 2360 (66.4) | 3249 (62.5) |
| Data missing | 6 | 16 | 8 | 30 |
| Treatment group, n (%) | ||||
| Chemotherapy | 87 (66.9) | 923 (60.3) | 1535 (43.1) | 2545 (48.7) |
| Rituximab+chemotherapy | 43 (33.1) | 486 (31.7) | 1881 (52.8) | 2410 (46.1) |
| Rituximab monotherapy | 0 (0.0) | 122 (8.0) | 148 (4.2) | 270 (5.2) |
| Months from diagnosis to treatment | ||||
| Mean (standard deviation) | 1.9 (4.76) | 3.6 (11.29) | 3.0 (8.26) | 3.1 (9.17) |
| Median (range) | 0.8 (0.0-36.5) | 0.9 (0.0-160.3) | 1.1 (0.0-142.2) | 1.0 (0.0-160.3) |
| Ann Arbor stage, n (%) | ||||
| Unknown | 2 (1.5) | 3 (0.2) | 17 (0.5) | 22 (0.4) |
| I/II | 7 (5.4) | 52 (3.4) | 242 (6.8) | 301 (5.8) |
| III/IV | 121 (93.1) | 1476 (96.4) | 3305 (92.7) | 4902 (93.8) |
| FLIPI risk category | ||||
| Low, n (%) | 12 (10.9) | 149 (10.3) | 694 (20.4) | 855 (17.2) |
| Intermediate, n (%) | 22 (20.0) | 457 (31.5) | 1344 (39.5) | 1823 (36.7) |
| High, n (%) | 76 (69.1) | 845 (58.2) | 1363 (40.1) | 2284 (46.0) |
| Data missing, n | 20 | 80 | 163 | 263 |
| Number of nodal sites | ||||
| 0-4, n (%) | 37 (44.6) | 306 (28.4) | 1084 (41.1) | 1427 (37.6) |
| >4, n (%) | 46 (55.4) | 772 (71.6) | 1553 (58.9) | 2371 (62.4) |
| Data missing, n | 47 | 453 | 927 | 1427 |
| HGB at baseline | ||||
| Normal, n (%) | 62 (59.6) | 839 (72.3) | 2471 (83.0) | 3372 (79.5) |
| Decreased, n (%) | 42 (40.4) | 322 (27.7) | 507 (17.0) | 871 (20.5) |
| Data missing, n | 26 | 370 | 586 | 982 |
| β2M level at baseline | ||||
| Normal, n (%) | 18 (37.5) | 520 (58.6) | 1667 (72.9) | 2205 (68.4) |
| Elevated, n (%) | 30 (62.5) | 368 (41.4) | 620 (27.1) | 1018 (31.6) |
| Data missing, n | 82 | 643 | 1277 | 2002 |
Logistic model for POD24
A multivariable logistic regression model (Table 2) indicated that being male (odds ratio [OR], 1.30; 95% confidence interval [CI], 1.14-1.47; P < .01), having PS ≥2 (OR, 1.63; 95% CI, 1.27-2.10; P < .01) and intermediate (FLIPI-2 risk score; OR, 1.58; 95% CI, 1.28-1.94; P < .01) or high-risk score (3-5; OR, 2.94; 955 CI, 2.41-3.59; P < .01), compared with a low-risk score (0 or 1), were associated with increased risk of progression before 24 months. An elevated baseline level of B2M (≥3 mg/L; OR, 1.43; 95% CI, 1.19-1.70; P < .01) was also associated with an increased risk of progression before 24 months in a subset of patients enrolled in 9 studies (n = 3046) that included Β2M levels at baseline.
Logistic models for POD24
| Induction treatment regimen | ||||||||||||
|---|---|---|---|---|---|---|---|---|---|---|---|---|
| All patients | Rituximab-chemotherapy | Rituximab | Chemotherapy | |||||||||
| Events/ total, n | OR (95% CI) | P | Events/ total, n | OR (95% CI) | P | Events/ total, n | OR (95% CI) | P | Events/ total, n | OR (95% CI) | P | |
| Tier 1 | 1423/4751 | 459/2222 | 121/265 | 843/2264 | ||||||||
| Sex | <.0001* | .0027* | .6005* | .0054* | ||||||||
| Female | 655/2346 | Reference | — | 206/1106 | Reference | — | 63/140 | Reference | — | 386/1100 | Reference | — |
| Male | 768/2405 | 1.30 (1.14-1.47) | <.0001† | 253/1116 | 1.38 (1.12-1.70) | .0027† | 58/125 | 1.14 (0.69-1.88) | .6005† | 457/1164 | 1.28 (1.08-1.53) | .0054† |
| Performance status | 0.0001* | 0.0119* | 0.6770* | 0.0144* | ||||||||
| 0-1 | 1301/4477 | Reference | — | 422/2111 | Reference | — | 117/258 | Reference | — | 762/2108 | Reference | — |
| ≥2 | 122/274 | 1.63 (1.27-2.10) | 0.0001† | 37/111 | 1.71 (1.13-2.59) | 0.0119† | 4/7 | 1.39 (0.29-6.56) | 0.6770† | 81/156 | 1.52 (1.09-2.12) | 0.0144† |
| FLIPI risk category | <.0001* | <.0001* | 0.0172* | <.0001* | ||||||||
| Low | 146/834 | Reference | — | 48/377 | Reference | — | 11/39 | Reference | — | 87/418 | Reference | — |
| Intermediate | 447/1772 | 1.58 (1.28-1.94) | <.0001† | 129/828 | 1.25 (0.87-1.79) | .2206† | 33/80 | 1.86 (0.80-4.29) | .1470† | 285/864 | 1.85 (1.40-2.44) | <.0001† |
| High | 830/2145 | 2.94 (2.41-3.59) | <.0001† | 282/1017 | 2.62 (1.87-3.66) | <.0001† | 77/146 | 2.90 (1.34-6.32) | .0072† | 471/982 | 3.45 (2.63-4.52) | <.0001† |
| Tier 2 | 856/3046 | 389/1852 | 104/233 | 363/961 | ||||||||
| Sex | .0061* | .0690* | .4929* | .0238* | ||||||||
| Female | 410/1545 | Reference | — | 183/931 | Reference | — | 55/126 | Reference | — | 172/488 | Reference | — |
| Male | 446/1501 | 1.26 (1.07-1.48) | .0061† | 206/921 | 1.24 (0.98-1.56) | .0690† | 49/107 | 1.21 (0.71-2.06) | .4929† | 191/473 | 1.37 (1.04-1.81) | .0238† |
| Performance status | .0268* | .1743* | .6284* | .1072* | ||||||||
| 0-1 | 789/2883 | Reference | — | 360/1762 | Reference | — | 102/228 | Reference | — | 327/893 | Reference | — |
| ≥2 | 67/163 | 1.46 (1.04-2.03) | .0268† | 29/90 | 1.39 (0.87-2.22) | .1743† | 2/5 | 0.63 (0.09-4.19) | .6284† | 36/68 | 1.53 (0.91-2.55) | .1072† |
| FLIPI risk category | <.0001* | <.0001* | .0175* | <.0001* | ||||||||
| Low | 73/511 | Reference | — | 45/334 | Reference | — | 8/34 | Reference | — | 20/143 | Reference | — |
| Intermediate | 256/1123 | 1.69 (1.27-2.25) | .0003† | 104/674 | 1.08 (0.74-1.58) | .6803† | 27/68 | 2.22 (0.87-5.67) | .0963† | 125/381 | 2.87 (1.70-4.83) | <.0001† |
| High | 527/1412 | 3.14 (2.37-4.15) | <.0001† | 240/844 | 2.01 (1.39-2.90) | .0002† | 69/131 | 3.43 (1.42-8.24) | .0060† | 218/437 | 5.74 (3.40-9.67) | <.0001† |
| Β2Μ level at baseline | <.0001* | <.0001* | .1509* | .3200* | ||||||||
| Normal | 504/2108 | Reference | — | 209/1278 | Reference | — | 75/182 | Reference | — | 220/648 | Reference | — |
| Elevated | 352/938 | 1.43 (1.19-1.70) | <.0001† | 180/574 | 1.81 (1.41-2.32) | <.0001† | 29/51 | 1.63 (0.84-3.16) | .1509† | 143/313 | 1.16 (0.86-1.56) | .3200† |
Type 3 Wald P-value.
Covariate Wald P-value.
Results within treatment regimen subsets remained mostly consistent, but the power to detect statistically significant effects was reduced because of the small sample size. For patients who received induction chemotherapy including rituximab (R-chemo; n = 2222), being male (OR, 1.38; 95% CI, 1.12-1.70; P < .01) and having PS ≥2 (OR, 1.71; 95% CI, 1.13-2.59; P < .01), high-risk FLIPI score (OR, 2.62; 95% CI, 1.87-3.66; P < .01), and elevated B2M level (OR, 1.81; 95% CI, 1.41-2.32; P < .01, in a subset of 1852 patients) were associated with increased risk of progression before 24 months. For patients who received rituximab therapy at induction without chemotherapy (n = 265), being male (OR, 1.14; 95% CI, 0.69-1.88; P = .60) and having PS ≥2 (OR, 1.39; 95% CI, 0.29-6.56; P = .68), a high-risk FLIPI score (OR, 2.90; 95% CI, 1.34-6.32; P < .01), and an elevated B2M level (OR, 1.63; 95% CI, 0.84-3.16; P = .15, in a subset of 233 patients) showed evidence of increased risk of progression before 24 months, but only the high-risk FLIPI score reached statistical significance. For patients who received chemotherapy at induction without rituximab (n = 2264), being male (OR, 1.28; 95% CI, 1.08-1.53; P < .01) and having PS ≥2 (OR, 1.52; 95% CI, 1.09-2.12; P = .01) and intermediate-risk (OR, 1.85; 95% CI, 1.40-2.44; P < .01) or high-risk (OR, 3.45; 95% CI, 2.63-4.52; P < .01) FLIPI score were associated with increased risk of progression before 24 months.
In the subset of 3 trials that included maintenance randomization (n = 1248), receiving maintenance rituximab treatment was associated with a decreased risk of progression before 24 months (OR, 0.39; 95% CI, 0.30-0.52; P < .01), whereas being male (OR, 1.23; 95% CI, 0.94-1.63; P = .14) and having a PS ≥2 (OR, 1.58; 95% CI, 0.79-3.14; P = .20) and a high-risk FLIPI score (OR, 1.94; 95% CI, 1.31-2.86; P < .01) showed evidence of increased risk of progression before 24 months, but only maintenance rituximab and high-risk FLIPI score reached statistical significance.
Results from the PFS24 model were consistent with results from the POD24 model and are reported in supplemental Table 2, available on the Blood Web site.
Time-dependent Cox model evaluating the association of POD24 on OS
There was an indication that the effect of PS and FLIPI on OS did not meet the proportional hazards assumption, and they were therefore included as stratification factors in the Cox model. In the time-dependent Cox model, adjusted for sex and stratified by PS and FLIPI, POD24 was associated with poor subsequent OS (hazard ratio [HR], 4.85; 95% CI, 4.32-5.45; P < .01).
Results remained consistent within treatment groups, with the strongest effect being in patients who received rituximab without chemotherapy. In the time-dependent Cox model, POD24 was associated with poor subsequent OS in patients who received induction chemotherapy with rituximab (n = 2252; HR, 5.39; 95% CI, 4.40-6.61; P < .01). The impact on poor outcome remained robust in those who received induction chemotherapy without rituximab (n = 2335; HR, 4.26; 95% CI, 3.68-4.93; P < .01) and in patients who received rituximab therapy at induction without chemotherapy (n = 265; HR, 6.57; 95% CI, 2.64-16.32; P < .01).
In the subset of 3 trials that included maintenance randomization (n = 1255), the time-dependent POD24 variable was associated with poor subsequent OS (HR, 4.68; 95% CI, 3.52-6.23; P < .01), whereas receiving maintenance rituximab treatment did not show a statistically significant effect on subsequent OS (HR, 1.18; 95% CI, 0.89-1.57; P = .24). No significant interaction was detected between POD24 and maintenance rituximab.
Landmark Cox model of OS in patients alive at 24 months
To further examine the effect of POD24 on OS, we used a 24-month landmark approach for Kaplan-Meier curves and Cox models. To reduce potential bias, time for all patients began at trial registration, patients were split into groups based on progression status at 24 months after registration, and any patient who died or was censored for OS before 24 months was excluded. This is in contrast to the original National LymphoCare Study (NLCS) report,3 in which staggered start times (time of progression for POD24 group and 24 months after registration for the no-POD24 group) were used, and only patients who died without prior disease progression before 24 months were excluded.
The Kaplan-Meier curve (Figure 1A) shows OS distribution in all patients by progressive disease status within 24 months after randomization. The 3- and 5-year (postregistration) survival probabilities of patients in whom the disease progressed within the first 24 months were 86.8% (95% CI, 84.8-88.8) and 71.2% (95% CI, 68.5-74.0), respectively. The 3- and 5-year survival probabilities of patients who were progression free at 24 months were 98.5% (95% CI, 98.0-98.9) and 93.6% (95% CI, 92.7-94.5), respectively. A multivariable Cox model adjusted for sex and stratified by PS and FLIPI showed that disease progression within 24 months of trial registration was associated with poorer subsequent OS (HR, 3.03; 95% CI, 2.65-3.47; P < .01).
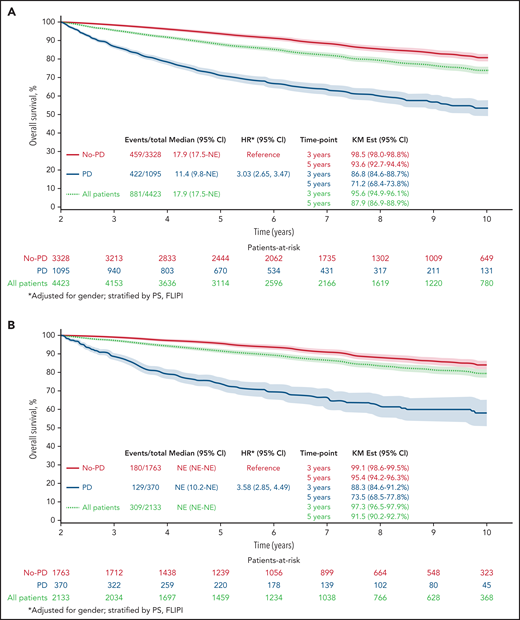
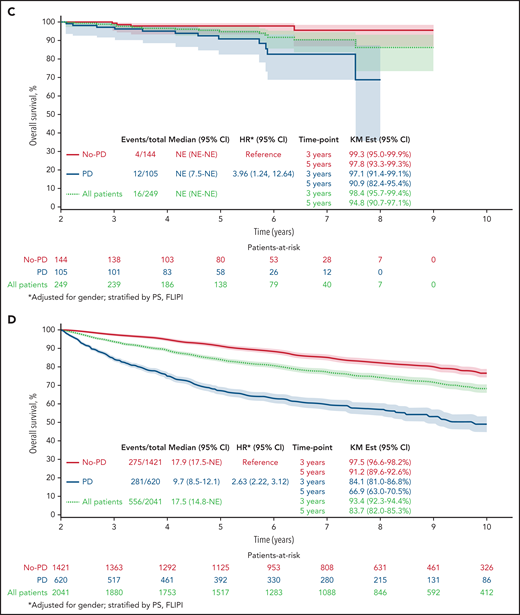
Twenty-four–month landmark Kaplan-Meier OS by POD status. All patients (A) and patients who received R-chemo (B), rituximab only (C), or chemotherapy only (D).
Twenty-four–month landmark Kaplan-Meier OS by POD status. All patients (A) and patients who received R-chemo (B), rituximab only (C), or chemotherapy only (D).
Results remained consistent within treatment groups, with the strongest effect again being in patients who received R-chemo. In the 24-month landmark Cox model, disease progression within 24 months of trial registration was associated with poor subsequent OS in patients who received induction chemotherapy with rituximab (Figure 1B; n = 2133; HR, 3.58; 95% CI, 2.85-4.49; P < .01), patients who received rituximab therapy at induction without chemotherapy (Figure 1C; n = 249; HR, 3.96; 95% CI, 1.24-12.64; P < .01), and patients who received induction chemotherapy without rituximab (Figure 1D; n = 2041; HR, 2.63; 95% CI, 2.22-3.12; P < .01).
Of the patients who were treated with induction chemotherapy-immunotherapy (R-chemo; n = 2133), 17.3% had disease progression within 24 months, and OS for those patients with early POD was 73.5 months (95% CI, 69.0-78.3). In the group of patients treated with rituximab only (n = 249), 42.2% had disease progression within 24 months, with OS for those patients with early POD of 90.9 months (95% CI: 85.0-97.3). In patients who were treated with induction chemotherapy without rituximab (chemo; n = 2041), 30.4% had disease progression within 24 months, and OS for those patients with early POD was 66.9 (63.3-70.7).
Discussion
This pooled analysis of >5000 patients with FL included in 13 prospective clinical trials is the largest cohort to date in which early progression was validated as a robust indicator of poor survival in patients with FL. We identified male sex, poor PS, high FLIPI score, and elevated baseline B2M level as predictors of early progression or death. Some factors predictive of POD24 in our data set are similar to those that predict histologic transformation, such as poor performance status and high-risk FLIPI; however, elevated B2M level and male sex add distinct value.
Our data demonstrate a similar frequency of disease progression observed in our previous work and other FL studies.3-6 Overall, in the cohort of 5225 evaluable patients, nearly one-third (29.3%) had disease progression by 24 months. For patients receiving rituximab only, 42.2% had disease progression by 24 months. In this smaller cohort, risk factors for early progression remained being male and having poor performance status and elevated B2M level, but the risk was not statistically significant, most likely because of small sample size. However, high-risk FLIPI score (OR, 2.90; 95% CI, 1.34-6.32; P < .01) conferred an increased likelihood of early progression in rituximab-only–treated patients. In patients receiving chemoimmunotherapy, 17.3% had disease progression by 24 months. All factors remained significant in this group and were associated with increased risk of progression before 24 months.
The association of POD24 on OS remains among the most important factors that affect the outcome of patients in FL. We have demonstrated differences in the degree of impact on survival on the basis of the type of induction therapy a patient receives. As mentioned, in the entire cohort, patients who progressed early but remained alive at 24 months after randomization had 3- and 5-year survival probabilities of 86.8% and 71.2%, respectively. However, clear differences in survival emerged after relapse, depending on the type of induction that the patient received. Early POD after rituximab had only a modest impact on subsequent OS, whereas POD after R-chemo consistently had the greatest influence on poor subsequent outcome, presumably because of low tumor burden and more favorable disease that did not require anthracyclines.
Given the differences in our statistical analysis using this landmark approach, survival after relapse cannot be compared directly to the 5-year OS of 50% observed in the original NLCS and other validation studies.3,4,7 When evaluating postprogression survival in our FLASH data, estimates approximated those observed in the NLCS (see the supplementary Appendix), with OS at 5 years of 57.5% for early POD after R-chemo compared with 90.7% in those without early recurrence, and 5 year OS of 75.7% for early POD after treatment with rituximab only (compared with 95.6% for patients without early POD after rituximab treatment). Estimates based on the original NLCS paper are in supplemental Table 3.
These observations may reflect the heterogeneously treated population in FLASH that included studies of patients who received immunotherapy only or chemotherapy only without rituximab. The latter data also suggest that patients who are treated with chemoimmunotherapy and subsequently relapse early are those who are truly the most vulnerable, having received the best therapy but experiencing an early disease-related event. This finding is similar to that which Maurer and colleagues observed in their analysis of Mayo/University of Iowa data showing that the impact of early recurrence is lessened in patients who receive rituximab or observation only.7
Although these results identify important clinical biomarkers, POD24 reflects aggressive disease histology with determinants that are most likely multifactorial. Investigators worldwide are developing numerous prognostic factors in FL to identify subsets of patients most vulnerable to poor outcomes. Pivotal historic gene expression profiling studies have identified that gene signatures from inflammatory cells within the FL tumor microenvironment directly affect survival of the malignant FL cell through critical interactions that cause dampening of the antitumoral immune response and a supportive protumoral phenotype.8 More recent studies have corroborated that the signature scores of 23 genes involved in DNA response pathways, immune regulation, cell cycle and cell migration pathways, and tumor microenvironmental components likewise play an important role in FL pathogenesis and are independent predictors of PFS24 status and POD24.9 Similarly, a clinicogenetic predictor (the m7-FLIPI) including the mutational status of 7 genes, poor performance status, and high-risk FLIPI has been proposed to improve the identification of patients with poor risk, and a high-risk m7-FLIPI is enriched in patients with POD24.10
Although promising, these and other prognostic models, including those using metabolic imaging11 and circulating tumor DNA,12 currently remain investigational and are not ready for widespread application. Limitations of these models include lack of harmonization, data volume, and a heterogeneously treated patient population that is cared for both in academic and nonacademic settings, where gene expression profiling and access to gene mutation assessment is not widely available. We are limited by the lack of biologic or molecular data to enhance our clinical predictors. Another main limitation is selection bias through the evaluation of patients sufficiently healthy to be enrolled in randomized clinical trials.
Understanding the optimal therapeutic sequence for these patients is also a continuous research initiative. Ongoing studies are testing novel therapies for patients with POD24 with conserved FL histology. The S1608 study (registered on www.clinicaltrials.gov as NCT03269669) is the only prospective randomized study to evaluate obinutuzumab in combination with umbralisib, lenalidomide, or CHOP (cyclophosphamide, doxorubicin, vincristine, and prednisone)/bendamustine in patients with POD24 and early treatment failure. Other studies have evaluated efficacy in subsets of patients with POD24, including the AUGMENT,13 MAGNIFY,14 and GALEN15 studies using lenalidomide with rituximab or the phosphoinositide 3-kinase inhibitors idelalisib, copanlisib, and duvelisib.16-18 Treatment with CD19-directed CAR T cells is encouraging and is under evaluation in patients with POD24.19 All of these demonstrate promising efficacy in this population, but no combination has yet emerged as a standard of care.
A combined observational study from the National LymphoCare Study and the Center for International Blood and Marrow Transplant Research demonstrated that early use of autologous transplant as a consolidation (defined as within 1 year of frontline induction failure) is associated with significantly reduced risk of death (HR, 0.63; 95% CI, 0.42-0.94; P = .02), suggesting a role for consolidation in certain fit, eligible patients.20 The benefit was also observed when comparing autologous transplant to allogeneic transplant in patients with early treatment failure. Autologous transplant had 5 year OS of 70% and lower nonrelapse mortality compared to matched sibling donor or matched unrelated donor allogeneic transplant.21 Although that study focused on patients with recurrent FL, it is possible that patients with histologic transformation were included.
The objective of our study was to identify and apply prognostic biomarkers at diagnosis for strategic and precise use of therapies. POD24 is a surrogate for poor biology, and some data suggest that histologic transformation is an early event that precipitates death in subsets of patients with POD24, but the precise mechanisms underlying early progression are still undefined.1,22 Bachy and colleagues created a simplified prognostic index using only Β2M and bone marrow involvement.23 In a uniformly treated cohort of patients receiving chemoimmunotherapy, with or without rituximab maintenance in the PRIMA study, the PRIMA prognostic index appeared to be a discriminatory of outcome as the FLIPI or FLIPI-2, also capturing a subset of POD24, but similarly requires testing across a broader scope of treatments.23
Our study represents an international, prospective, multicenter effort to identify predictors of POD24 among patients treated with a variety of treatment approaches. The data set is the largest ever published that validates POD24 as a robust marker of poor OS in FL in a widely heterogeneous group of patients and provides well-defined clinical factors for building comprehensive prognostic models that incorporate clinical and molecular predictors of POD24.
Acknowledgments
The authors thank all participating patients and their families, all study investigators, and Daniel Sargent.
This work was supported by Celgene and Roche.
Authorship
Contribution: C.C. and C.R.F. were the core investigators; J.G.D., J.L.-R. and Q.S. performed the statistical analyses; and E.H. H.S.H., W.H., R.M., E.K., M.H., C.S., E.G., K.F., T.N., U.V., G.A.S., and Q.S. contributed to the trial.
Conflict-of-interest disclosure: C.C. received research funding from Verastem and Gilead. E.H. received institutional research funding and personal travel expense from Roche. M.L. declares, in the past 5 years, consultancy, participation on advisory boards, invitation to scientific meetings, institutional research support, and contracts with AbbVie, Acerta, Amgen, Archigen, ADC Therapeutics, BeiGene, Celgene, Gilead, Johnson & Johnson, Jazz, Roche, Sandoz, and Takeda; nonfinancial interests including serving as principal or strategic investigator in studies supported by Celgene, Johnson and Johnson, and BeiGene; and leadership roles as a board member of Fondazione Italiana Linfomi, a member of the European Hematology Association (EHA) Guideline Committee; membership on the Euro-MRD Board and the ESMO (European Society for Medical Oncology) Guidelines Committee up to December 2018; and holding office as Vice President of the Associazione Italiana Leucemie (Alessandria section). W.H. has received honoraria and research support from Roche, Celgene, Bayer, and Janssen. E.K. has received grants and other support from Roche and Genentech, during the conduct of the study; personal fees from Bayer, and Genmab, personal Janssen, Gilead/Roche, and AbbVie; and nonfinancial support from MEI Pharma, outside the submitted work. T.N. is an executive committee member, and was employed by and held stock ownership in F. Hoffman La Roche. F.M. served on the advisory board of Celgene, Roche, Giead, Epizyme, and Verasteem and received honoraria for scientific lectures from Celgene, Roche, Janssen and AbbVie. U.V., S.G., Q.S., and C.R.F. are executive committee members. J.G.D., O.F.-S., H.S.H., R.M., and M.H. declare no competing financial interests.
A complete list of the members of the FLASH Group appears in the supplemental Appendix.
Correspondence: Carla Casulo, Wilmot Cancer Institute, University of Rochester, 601 Elmwood Ave, Box 704, Rochester, NY, 14642; e-mail: carla_casulo@urmc.rochester.edu.
Presented as an oral presentation at the 59th annual meeting of the American Society of Hematology Annual Meeting and Exposition, Atlanta, GA, 9-12 December 2017, (Blood. 2017;130 [suppl_1]:412).
Original data may be obtained by e-mail request to the corresponding author.
The online version of this article contains a data supplement.
There is a Blood Commentary on this article in this issue.
The publication costs of this article were defrayed in part by page charge payment. Therefore, and solely to indicate this fact, this article is hereby marked “advertisement” in accordance with 18 USC section 1734.

This feature is available to Subscribers Only
Sign In or Create an Account Close Modal