

Key Points
Increased blood microbial compounds drive elevated IL-1a/b production in the BM of older mice.
HSCs in older IL-1R1KO and germ-free mice are protected from and IL-1 antagonist or antibiotic treatment reverts HSC inflammaging.

Abstract
Aging is associated with impaired hematopoietic and immune function caused in part by decreased fitness in the hematopoietic stem cell (HSC) population and an increased myeloid differentiation bias. The reasons for this aging-associated HSC impairment are incompletely understood. Here we demonstrate that older specific pathogen free (SPF) wild-type (WT) mice in contrast to young SPF mice produce more interleukin-1a and interleukin-1b (IL-1a/b) in steady-state bone marrow (BM), with most of the IL-1a/b being derived from myeloid BM cells. Furthermore, blood from steady-state older SPF WT mice contains higher levels of microbe-associated molecular patterns, specifically TLR4 and TLR8 ligands. In addition, BM myeloid cells from older mice produce more IL-1b in vitro, and older mice show higher and more durable IL-1a/b responses upon stimulation with lipopolysaccharide in vivo. To test whether HSC aging is driven by IL-1a/b, we evaluated HSCs from IL-1 receptor 1 (IL-1R1) knockout (KO) mice. Indeed, older HSCs from IL-1R1KO mice show significantly mitigated aging-associated inflammatory signatures. Moreover, HSCs from older IL-1R1KO and from germ-free mice maintain unbiased lymphomyeloid hematopoietic differentiation upon transplantation, thus resembling this functionality of young HSCs. Importantly, in vivo antibiotic suppression of microbiota or pharmacologic blockade of IL-1 signaling in older WT mice was similarly sufficient to reverse myeloid-biased output of their HSC populations. Collectively, our data define the microbiome/IL-1/IL-1R1 axis as a key, self-sustaining and also therapeutically partially reversible driver of HSC inflammaging.
Introduction
Aging of the hematopoietic system is associated with functional impairment on both the mature and immature hematopoietic cell level (reviewed in Kovtonyuk et al1 and Geiger et al2). Hematopoietic stem cell (HSC) aging3-6 is characterized by reduced self-renewal capacity,4 increased numbers of myeloid-biased HSCs,4,7 accumulated DNA damage and proliferative stress marks,8,9 increased resistance to apoptosis,10 epigenetic and transcriptional alterations,11,12 loss of autophagy capacity,13 decreased homing capacity, and increased expression of adhesion molecules.3,14 Overall, aging is associated with chronic low-grade inflammation, which is often referred to as inflammaging (reviewed in Kovtonyuk et al,1 Fulop et al,15 and Ferrucci and Fabbri16). Several studies have demonstrated the roles of specific inflammatory cues in the aging of HSCs such as stromal cell–derived Rantes/Ccl5,17 bone marrow (BM) macrophage-derived interleukin-1 (IL-1),18 Wnt/Wnt5a switch during aging,19 and plasma cell–derived IL-1 and tumor necrosis factor α.20 All these factors drive increased myelopoiesis, a feature that is common during aging. Less is known about what acts upstream of these inflammatory factors in inflammaging. However, recent studies have demonstrated that the microbiome has an impact on the function of HSCs. Indeed, steady-state myelopoiesis in young mice is modulated by microbiome-derived compounds via Myd88/Ticam (Trif) and CXCR3+ mononuclear BM-resident cells.21,22 Moreover, beyond indirectly inducing the complex process of emergency granulopoieis via enhanced secretion of granulocyte colony-stimulating factor,23-25 lipopolysaccharide (LPS) can act directly on HSCs, promoting proliferation but impairing competitive fitness.26 Collectively, these studies suggest that microbiome-derived compounds might play a role in hematopoietic inflammaging. Here we investigated the most prominent features of BM environmental changes that occur during aging and evaluated how they drive aging-associated functional changes in HSCs on a population level.
Methods
Detailed information about mouse strains, fluorescence-activated cell sorting and analysis, RNA sequencing, in vivo transplantation studies, mouse analysis, protein measurements, and gene-chip analysis are provided in the Supplemental Materials file (available on the Blood Web site).
Mice
All mice were housed and handled according to the guidelines of the Swiss Federal Veterinary Office under specific-pathogen-free (SPF) conditions. Germ-free mice were maintained in a full-barrier facility in individually ventilated cages. All experiments were approved by the Veterinäramt Kanton Zurich (Zurich, Switzerland).
In vivo treatment with LPS, antibiotics, or anakinra
Mice were injected intraperitoneally with 35 μg LPS, corresponding to 35 EU (Escherichia coli 0111:B4, LPS-EB Ultrapure, InvivoGen) dissolved in 150 μL of phosphate-buffered saline (PBS). Control mice were injected with 150 μL PBS. Antibiotics were added to drinking water (1 mg/mL metronidazole [Sanofi], 1 mg/mL ampicillin [Sigma-Aldrich], 0.5 mg/mL neomycin trisulfate [Sigma-Aldrich], and 1 mg/mL vancomycin [Teva]. Then 37 μg anakinra per mouse was injected intraperitoneally.
In vivo HSC transplantation
All cells were transplanted IV in 200 μL of PBS per mouse. For functional tests of HSC engraftment and differentiation capacities, CD45.2+ long-term HSCs (LT-HSCs) were sorted in 100 μL of 1% fetal bovine serum and PBS. Then 3 × 10⁵ CD45.1+ whole bone marrow (WBM) nucleated cells per mouse were added and transplanted into lethally irradiated (9.5 cGy) CD45.1+ B6.SJL or CD45.1/2+ B6.SJL×C57BL/6 mice. Mice were kept on Borgal (24%) supplemented water (1.5ml in 250ml autoclaved water) for the duration of the experiment.
All statistical analyses were performed in either Excel or GraphPad Prism (v5 and v8). Data sets were compared by using paired, two-tailed Student t tests.
Results
IL-1 expression increases in older BM
To compare overall concentration of various proteins in BM of young (2-month-old) and older (2-year-old) mice, we analyzed whole femur BM lysates in semi-quantitative protein arrays. Older BM lysates showed an inflammatory profile, with 28 proteins being significantly upregulated and none being downregulated in comparison with those in young controls (Figure 1A; supplemental Table 1). We also compared gene transcription in young and older WBM cells by gene chip microarray (supplemental Table 2) and intersected those results with data from the protein arrays. This revealed 4 upregulated molecules: IL-1a, IL-1b, macrophage inflammatory protein 2 (MIP-2), and Rantes (Figure 1B). Increased levels of Rantes and CCL5 were previously described in the microenvironment of older HSCs, thus cross-confirming the validity of our results.17 MIP-2 and CXCL2 had low abundance and did not significantly change with aging when measured by using an enzyme-linked immunosorbent assay (ELISA) (data not shown). Given their role in inflammatory responses and their described short-term action on HSCs,27 we further focused on IL-1a and IL-1b, which act on the same receptors (IL-1R1 and IL-1R2) and are regulated via a complex activation and inactivation network.28-30
![IL-1 is upregulated in older BM. (A) Antibody-based protein array of whole BM lysates from 2-month-old (2mo 1-5, n = 5) and 2-year-old (2y 1-3, n = 3) WT SPF animals. Proteins that overlay with gene chip microarray analysis are indicated in bold. Heatmap represents significantly (P < .05) upregulated proteins in 2mo vs 2y BM. (B) Venn diagram illustrating the overlap of differentially regulated (2y, 2y vs 2mo, 2mo) proteins (protein array) and transcripts (gene chip microarray) in indicated WBM samples. (Protein array: 2mo, n = 5; 2y, n = 3; gene chip microarray: 2mo, n = 2; 2y, n = 2). (C) Relative expression of Il1 family genes (Il1a, Il1b, Il1r1, Il1r2, Il1ra) to glyceraldehyde-3-phosphate dehydrogenase (Gapdh) of 2mo (n = 4-11) and 2y (n = 3-7) BM populations. LT-HSCs (Lin−Sca1+c-Kit–(LSK) CD34–Flt3–CD48–CD150+; 2mo, n = 17; 2y, n = 20), common myeloid progenitor (CMP) cells (Lin−c-Kit–(LK) CD34+FcgRneg/low; 2mo, n = 2; 2y, n = 12), granulocyte macrophage progenitor (GMP) cells (LK CD34+FcgR+; 2mo, n = 2; 2y, n = 12), mesenchymal stromal cells (MSCs) (Ter119/CD45– CD31–Sca1+CD140b+; 2mo, n = 5; 2y, n = 3), CXCL12-abundant reticular (CAR) cells (Ter119/CD45– CD31–Sca1–CD140b+; 2mo, n = 5; 2y, n = 3), endothelial cells (ECs) (Ter119/CD45– CD31+Sca1+; 2mo, n = 5; 2y, n = 3), inflammatory monocytes (iMono) (CD11b+Gr1lowLy6Chigh; 2mo, n = 11; 2y, n = 3), granulocytes (Gran) (CD11b+Gr1high; 2mo, n = 11; 2y, n = 3), macrophages [Mφ] (CD11b+F4/80+; 2mo, n = 11; 2y, n = 2), NK cells (CD11b–Gr1–CD3e–CD19–B220–NK1.1+; 2mo, n = 11; 2y, n = 3), dendritic cells (DCs) (CD11c+MHCII+; 2mo, n = 5; 2y, n = 3), B cells (CD11b–Gr1–CD3e–CD19+B220+NK1.1–; 2mo, n = 11; 2y, n = 3), plasma cells (PCs) (CD11b–Ly6C–Gr1–B220–CD3–NK1.1–CD138+; 2mo, n = 4; 2y, n = 4), and T cells (CD11b–Gr1–CD3e+CD19–B220–NK1.1–; 2mo, n = 11; 2y, n = 3). Frequencies of the cellular populations in live WBM nucleated cells from 2mo and 2y mice are indicated in percentages. Error bars represent standard error of the mean (SEM). P values were calculated by using Student t test. *P < .05; **P < .01; ***P < .001. N.D., not determined.](https://ash.silverchair-cdn.com/ash/content_public/journal/blood/139/1/10.1182_blood.2021011570/4/m_bloodbld2021011570f1.png?Expires=1767738783&Signature=32tw45oEWbXCMn-SRaF6UNFeK5ZbRCF0aR3MaUGOc670NKXPmWy3NNZGdPIZ6U7B~phA~9f0UasWNiFdq9Tvr~JS~oXrANVNi5Ry362WbIJEYdBiGSJpI2jh5S0S0IsfuV9lpRPGZnV0USlBD4u0JfPJ4bkpE0hBbNKWu3G8nM3Ic-RXfEp5Lm2qZzXbpyTZ7F1i~wRe16bTfuvap1o6vrMNJ3Un~M66DURwLQ7lXlIx4okf2f4QLdFk8BXBlzeFDOF7ZNIr3m6T8yV0ZfuC4JAbqV5lVROtLBRSsltljXyji-Nb-nnpDySV1sXDTOWHeqkFl93BPPVMgr5ouhHZPg__&Key-Pair-Id=APKAIE5G5CRDK6RD3PGA)
IL-1 is upregulated in older BM. (A) Antibody-based protein array of whole BM lysates from 2-month-old (2mo 1-5, n = 5) and 2-year-old (2y 1-3, n = 3) WT SPF animals. Proteins that overlay with gene chip microarray analysis are indicated in bold. Heatmap represents significantly (P < .05) upregulated proteins in 2mo vs 2y BM. (B) Venn diagram illustrating the overlap of differentially regulated (2y, 2y vs 2mo, 2mo) proteins (protein array) and transcripts (gene chip microarray) in indicated WBM samples. (Protein array: 2mo, n = 5; 2y, n = 3; gene chip microarray: 2mo, n = 2; 2y, n = 2). (C) Relative expression of Il1 family genes (Il1a, Il1b, Il1r1, Il1r2, Il1ra) to glyceraldehyde-3-phosphate dehydrogenase (Gapdh) of 2mo (n = 4-11) and 2y (n = 3-7) BM populations. LT-HSCs (Lin−Sca1+c-Kit–(LSK) CD34–Flt3–CD48–CD150+; 2mo, n = 17; 2y, n = 20), common myeloid progenitor (CMP) cells (Lin−c-Kit–(LK) CD34+FcgRneg/low; 2mo, n = 2; 2y, n = 12), granulocyte macrophage progenitor (GMP) cells (LK CD34+FcgR+; 2mo, n = 2; 2y, n = 12), mesenchymal stromal cells (MSCs) (Ter119/CD45– CD31–Sca1+CD140b+; 2mo, n = 5; 2y, n = 3), CXCL12-abundant reticular (CAR) cells (Ter119/CD45– CD31–Sca1–CD140b+; 2mo, n = 5; 2y, n = 3), endothelial cells (ECs) (Ter119/CD45– CD31+Sca1+; 2mo, n = 5; 2y, n = 3), inflammatory monocytes (iMono) (CD11b+Gr1lowLy6Chigh; 2mo, n = 11; 2y, n = 3), granulocytes (Gran) (CD11b+Gr1high; 2mo, n = 11; 2y, n = 3), macrophages [Mφ] (CD11b+F4/80+; 2mo, n = 11; 2y, n = 2), NK cells (CD11b–Gr1–CD3e–CD19–B220–NK1.1+; 2mo, n = 11; 2y, n = 3), dendritic cells (DCs) (CD11c+MHCII+; 2mo, n = 5; 2y, n = 3), B cells (CD11b–Gr1–CD3e–CD19+B220+NK1.1–; 2mo, n = 11; 2y, n = 3), plasma cells (PCs) (CD11b–Ly6C–Gr1–B220–CD3–NK1.1–CD138+; 2mo, n = 4; 2y, n = 4), and T cells (CD11b–Gr1–CD3e+CD19–B220–NK1.1–; 2mo, n = 11; 2y, n = 3). Frequencies of the cellular populations in live WBM nucleated cells from 2mo and 2y mice are indicated in percentages. Error bars represent standard error of the mean (SEM). P values were calculated by using Student t test. *P < .05; **P < .01; ***P < .001. N.D., not determined.
IL-1 is upregulated in older BM. (A) Antibody-based protein array of whole BM lysates from 2-month-old (2mo 1-5, n = 5) and 2-year-old (2y 1-3, n = 3) WT SPF animals. Proteins that overlay with gene chip microarray analysis are indicated in bold. Heatmap represents significantly (P < .05) upregulated proteins in 2mo vs 2y BM. (B) Venn diagram illustrating the overlap of differentially regulated (2y, 2y vs 2mo, 2mo) proteins (protein array) and transcripts (gene chip microarray) in indicated WBM samples. (Protein array: 2mo, n = 5; 2y, n = 3; gene chip microarray: 2mo, n = 2; 2y, n = 2). (C) Relative expression of Il1 family genes (Il1a, Il1b, Il1r1, Il1r2, Il1ra) to glyceraldehyde-3-phosphate dehydrogenase (Gapdh) of 2mo (n = 4-11) and 2y (n = 3-7) BM populations. LT-HSCs (Lin−Sca1+c-Kit–(LSK) CD34–Flt3–CD48–CD150+; 2mo, n = 17; 2y, n = 20), common myeloid progenitor (CMP) cells (Lin−c-Kit–(LK) CD34+FcgRneg/low; 2mo, n = 2; 2y, n = 12), granulocyte macrophage progenitor (GMP) cells (LK CD34+FcgR+; 2mo, n = 2; 2y, n = 12), mesenchymal stromal cells (MSCs) (Ter119/CD45– CD31–Sca1+CD140b+; 2mo, n = 5; 2y, n = 3), CXCL12-abundant reticular (CAR) cells (Ter119/CD45– CD31–Sca1–CD140b+; 2mo, n = 5; 2y, n = 3), endothelial cells (ECs) (Ter119/CD45– CD31+Sca1+; 2mo, n = 5; 2y, n = 3), inflammatory monocytes (iMono) (CD11b+Gr1lowLy6Chigh; 2mo, n = 11; 2y, n = 3), granulocytes (Gran) (CD11b+Gr1high; 2mo, n = 11; 2y, n = 3), macrophages [Mφ] (CD11b+F4/80+; 2mo, n = 11; 2y, n = 2), NK cells (CD11b–Gr1–CD3e–CD19–B220–NK1.1+; 2mo, n = 11; 2y, n = 3), dendritic cells (DCs) (CD11c+MHCII+; 2mo, n = 5; 2y, n = 3), B cells (CD11b–Gr1–CD3e–CD19+B220+NK1.1–; 2mo, n = 11; 2y, n = 3), plasma cells (PCs) (CD11b–Ly6C–Gr1–B220–CD3–NK1.1–CD138+; 2mo, n = 4; 2y, n = 4), and T cells (CD11b–Gr1–CD3e+CD19–B220–NK1.1–; 2mo, n = 11; 2y, n = 3). Frequencies of the cellular populations in live WBM nucleated cells from 2mo and 2y mice are indicated in percentages. Error bars represent standard error of the mean (SEM). P values were calculated by using Student t test. *P < .05; **P < .01; ***P < .001. N.D., not determined.
To determine IL-1 cytokine and receptor expression in defined BM cell populations, we evaluated relative messenger RNA expression of Il1a, Il1b, Il1r1, Il1r2, and Il1ra on immature HSCs (LT-HSCs, common myeloid progenitor [CMP] cells, and granulocyte macrophage progenitor [GMP] cells), stromal cells (mesenchymal stromal cells [MSCs], CXCL12-abundant reticular [CAR] cells, and endothelial cells [ECs]), myeloid cells (inflammatory monocytes, granulocytes, and macrophages), lymphoid cells (natural killer [NK] cells), B cells, plasma cells (PCs), T cells, and dendritic cells (DCs) (gating strategies are shown in supplemental Figure 1). In parallel, we determined matched cell type frequencies in young and older BM (Figure 1C). BM inflammatory monocytes and granulocytes upregulate Il1a whereas NK cells, B cells, and inflammatory monocytes upregulate Il1b significantly with aging. These observations together with previously published data20,31 strongly suggest that aging-associated increase in IL-1 derives from multiple cell types, quantitatively mostly belonging to the myeloid lineage. Interestingly, older HSCs upregulate the active IL-1 receptor (Il1r1), but not the decoy receptor (Il1r2) (Figure 1C), confirming previously published data.32 To dissect the contribution of IL-1 signaling to the inflammatory profile of wild-type (WT) BM, we performed protein arrays on young and older BM lysates from IL-1R1 knockout (KO) mice. Strikingly, none of the 28 proteins upregulated in older WT mice (including IL-1a/b, MIP-2, and Rantes) were upregulated in IL-1R1KO older mice (supplemental Figure 2A-C), thus confirming IL-1/IL-1R1 signaling as an important mediator of BM inflammation during aging. Taken together, our results indicate that from a quantitative standpoint, myeloid cell–derived IL-1a and IL-1b are the key cytokines that are increased in older BM with the potential to act on the respective cytokine receptor–expressing HSC compartment.
Older HSC populations develop an IL-1–dependent inflammatory or immune transcriptional signature
To evaluate global IL-1–dependent alterations in the aging HSC compartment in BM, we next analyzed transcriptional signatures of 5000 fluorescence-activated cell sorted LT-HSCs from all 2-month-old and 2-year-old WT and IL-1R1KO mice, which were kept in SPF housing conditions within the same animal facility.
Principal component analysis of obtained transcriptomes revealed that 2-month-old and 2-year-old LT-HSCs separate into 2 main groups according to principle component 1 (PC1). Although 2-year-old LT-HSCs diverge further as 2 separate groups according to PC2, depending on their genotype (WT or IL-1R1KO, with WT clustering farther away), 2-month-old LT-HSCs form a single cluster independently of genotype (Figure 2A). This indicates that the presence of IL-1R1 is necessary to cause a divergent aging process in LT-HSCs at the transcriptome level. To further characterize this, we analyzed the differentially expressed genes (DEGs; fold change less than "-1.5" and more than "1.5"− 1.5 > fold change > 1.5; false discovery rate [FDR] < 0.01) between 2-month-old and 2-year-old LT-HSCs in both WT and IL-1R1KO genotypes. By intersecting the WT and IL-1R1KO aging DEGs, we obtained genes that are unique to WT LT-HSC aging, unique to IL-1R1KO aging, and shared by both genotypes upon aging (Figure 2B; supplemental Table 3). To gain insight into the functional, ontogenic, and molecular differences of the 2 genotype LT-HSC aging processes, we performed global gene ontology (GO) analysis on DEGs unique to older WT, unique to older IL-1R1KO, and shared between both genotypes (Figure 2C). The majority of biological processes (BPs) overrepresented in DEGs unique in aging WT LT-HSCs relate to inflammation, immune processes, and response to pathogens (Figure 2C, left panel UP; supplemental Table 4 contains a full list of BPs). In stark contrast, there were very few BPs related to inflammation, immune processes, or response to pathogens in DEGs that are unique to older IL-1R1KO LT-HSCs (supplemental Table 4). This suggests a reduced inflammatory signature in aging IL-1R1KO LT-HSCs. The difference in inflammatory gene expression upon LT-HSC aging is supported by comparing the expression of multiple genes implicated in responses to cytokines in the 2 genotypes (Figure 2D). Accordingly, there was a significant increase in the expression of a total of 20 genes implicated in cellular responses to cytokines (eg, Jak3, Stat1-3, Tgtp1-2) exclusively in WT older LT-HSCs. Interestingly, Relb, a major component of the NF-kB complex which is downstream of IL-1/IL-1R1 signaling, was also upregulated (although not significantly; FDR > 0.01) uniquely in WT older LT-HSCs.
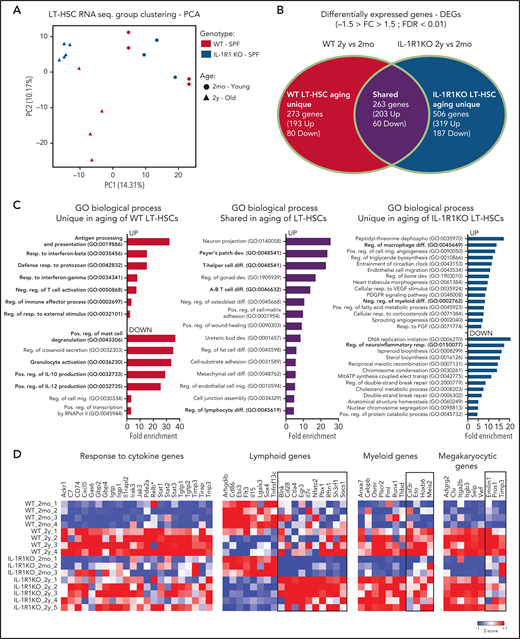
Older HSCs develop an IL-1–dependent immune-inflammatory transcriptional signature. (A) Principal component analysis (PCA) plot of LT-HSCs (LKS CD34–Flt3–CD48–CD150+) from 2mo, n = 4 WT; n = 3 IL-1R1KO) and 2y, n = 4 WT; n = 5 IL-1R1KO) WT SPF and IL-1R1KO SPF mice, based on RNA-sequencing (RNA-seq) expression values fragments per kilobase million. (B) Venn diagram depicting DEGs in HSCs from 2mo and 2y mice, which are unique to WT, unique to IL-1R1KO, or shared between the 2 groups. (C) Overrepresented GO terms (maximum of 15 terms) for upregulated (UP) and downregulated (DOWN) DEGs, unique to older WT LT-HSCs, unique to older IL-1R1KO LT-HSCs, or shared between the 2 groups. All displayed GO terms are significant (FDR < 0.05). GO terms related to hematopoiesis, immunity, or inflammation are indicated in bold. Abbreviations: dephospho, dephosphorylation; dev., development; diff., differentiation; elect., electron; mig., migration; mitATP, mitochondrial ATP; neg., negative; pos., positive; reg., regulatory; resp., response; transp., transport. (D) Heatmap showing expression of genes associated with GO terms. Response to cytokine (GO: 0034097) and genes which were previously described as being associated with lymphoid, myeloid, and megakaryocytic development. Column Z-scores are normalized. All genes displayed are significantly different in pairwise group comparison (WT_2mo_1-4, 2mo WT vs WT_2y_1-4, 2y SPF WT; IL-1R1KO_2mo_1-3, 2mo IL-1R1KO vs IL-1R1KO_2y_1-5, 2y IL-1R1KO) with FDR < 0.05. (*) not significant.
Older HSCs develop an IL-1–dependent immune-inflammatory transcriptional signature. (A) Principal component analysis (PCA) plot of LT-HSCs (LKS CD34–Flt3–CD48–CD150+) from 2mo, n = 4 WT; n = 3 IL-1R1KO) and 2y, n = 4 WT; n = 5 IL-1R1KO) WT SPF and IL-1R1KO SPF mice, based on RNA-sequencing (RNA-seq) expression values fragments per kilobase million. (B) Venn diagram depicting DEGs in HSCs from 2mo and 2y mice, which are unique to WT, unique to IL-1R1KO, or shared between the 2 groups. (C) Overrepresented GO terms (maximum of 15 terms) for upregulated (UP) and downregulated (DOWN) DEGs, unique to older WT LT-HSCs, unique to older IL-1R1KO LT-HSCs, or shared between the 2 groups. All displayed GO terms are significant (FDR < 0.05). GO terms related to hematopoiesis, immunity, or inflammation are indicated in bold. Abbreviations: dephospho, dephosphorylation; dev., development; diff., differentiation; elect., electron; mig., migration; mitATP, mitochondrial ATP; neg., negative; pos., positive; reg., regulatory; resp., response; transp., transport. (D) Heatmap showing expression of genes associated with GO terms. Response to cytokine (GO: 0034097) and genes which were previously described as being associated with lymphoid, myeloid, and megakaryocytic development. Column Z-scores are normalized. All genes displayed are significantly different in pairwise group comparison (WT_2mo_1-4, 2mo WT vs WT_2y_1-4, 2y SPF WT; IL-1R1KO_2mo_1-3, 2mo IL-1R1KO vs IL-1R1KO_2y_1-5, 2y IL-1R1KO) with FDR < 0.05. (*) not significant.
Multiple studies show that older HSCs produce a myeloid-biased output compared with young HSCs.3,4,6,33 To determine whether IL-1R1 signaling affects transcriptional signatures related to aging-associated skewing of HSC differentiation, we analyzed the expression of lymphoid, myeloid, and megakaryocytic differentiation-associated genes.5,34,35 Older LT-HSCs downregulated multiple lymphoid genes and upregulated multiple myeloid and megakaryocytic genes, independently of their genotype (Figure 2D, unboxed genes). Interestingly however, older IL-1R1KO LT-HSCs showed a significant relative upregulation of a unique group of lymphoid genes (Figure 2D, boxed lymphoid genes), including Il7r, the receptor for IL-7, a key lymphoid differentiating factor.36 In addition, older IL-1R1KO LT-HSCs, in contrast to WT LT-HSCs, failed to significantly upregulate a set of myeloid genes (Figure 2D, boxed myeloid genes) including Csf3r, the receptor of granulocyte colony-stimulating factor previously implicated in directing the commitment of hematopoietic stem and progenitor cells (HSPCs) to the myeloid lineage.37 This indicates that older IL-1R1KO LT-HSCs maintain a lympho-myeloid balanced transcriptional signature and do not fully acquire the myeloid differentiation bias gene signature observed in older WT LT-HSCs. This is further supported by significant enrichment of negative regulation of myeloid differentiation by BPs, regulation of T-cell differentiation, and regulation of B-cell proliferation uniquely in older IL-1R1KO LT-HSCs (Figure 2C, right panel; supplemental Table 4). Overall, analysis of WT and IL-1R1KO LT-HSC transcription shows that their aging signature is divergent with the exception of a few shared BPs that are mostly related to upregulation of adhesion molecules (positive regulation of cell-matrix adhesion, cell-substrate adhesion, and cell junction assembly; Figure 2C, central panel). Together, these data demonstrate that IL-1R1 expression is necessary for induction of inflammatory, immune, and pathogen defense as well as gene signatures related to myeloid differentiation bias in aging LT-HSC populations.
IL-1 is diminished in older WT germ-free mice, and WT germ-free and IL-1R1KO SPF mice develop a reduced aging-associated hematopoietic phenotype
The upregulation of IL-1 in older BM and the inflammatory defense transcriptional signatures in older WT HSCs suggest that these might be mediated extrinsically. We and others previously demonstrated that microbiome-derived compounds regulate steady-state levels of granulopoiesis.21,22 Aging has also been associated with increased translocation of bacterial compounds into the bloodstream as a result of decreased intestinal integrity.38 We thus hypothesized that microbiome-derived compounds might be driving the aging-associated hematopoietic phenotype. To test this, we measured levels of IL-1 in BM lysates, peripheral blood (PB) lysates, and PB serum (supplemental Figure 3A) of 2-month-old, 1-year-old, and 2-year-old WT (SPF) and IL-1R1KO (SPF) mice, as well as 2-month-old and 1-year-old WT germ-free (GF) mice (of note, GF mice have impaired survival beyond 1 year of age because they develop an enlarged cecum) (Figure 3A). Both IL-1a and IL-1b increased during aging in BM lysates of WT SPF mice and also in IL-1R1KO mice. Both cytokines are significantly upregulated in the PB lysates of 1-year-old and 2-year-old WT SPF mice but not in IL-1R1KO SPF mice (Figure 3A). In strong contrast, neither IL-1a nor IL-1b were upregulated in GF mice BM and PB lysates. Overall, microbiome components contribute to more (intracellular) IL-1 levels in older mice.
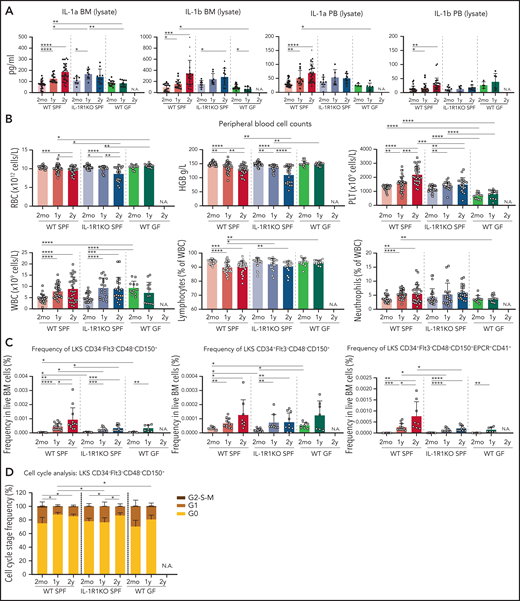
IL-1 is decreased in older WT GF mice, and WT GF and IL-1R1KO SPF mice show a reduced aging-associated increase of neutrophils, platelets, and phenotypic HSCs. (A) Concentration of IL-1a and IL-1b in BM and PB lysates in WT SPF, IL-1R1KO SPF, and WT GF animals. For 2mo mice, BM lysate: IL-1a, n = 32 WT, 8 IL-1R1KO, 17 GF; IL-1b, n = 16 WT, 8 IL-1R1KO, 20 GF; PB lysate: IL-1a, n = 34 WT, 9 IL-1R1KO, 4 GF; IL-1b, n = 26 WT, 9 IL-1R1KO, 4 GF. For 1y mice, BM lysate: IL-1a, n = 15 WT, 8 IL-1R1KO, 10 GF; IL-1b, n = 15 WT, 8 IL-1R1KO, 10 GF; PB lysate: IL-1a, n = 12 WT, 6 IL-1R1KO, 6 GF; IL-1b, n = 19 WT, 6 IL-1R1KO, 6 GF. For 2y mice, BM lysate: IL-1a, n = 35 WT, 10 IL-1R1KO; IL-1b, n = 22 WT, 11 IL-1R1KO; PB lysate: IL-1a, n = 30 WT, 10 IL-1R1KO; IL-1b, n = 29 WT, 10 IL-1R1KO. (B) PB cell counts in WT SPF, IL-1R1KO SPF, and WT GF mice. For 2mo mice, n = 26 WT, 26 IL-1R1KO, 12 GF; 1y mice, n = 36 WT, 19 IL-1R1KO, 13 GF; and for 2y mice, n = 30 WT, 22 IL-1R1KO. (C) Frequency of phenotypic LT-HSCs (LKS CD34–Flt3–CD48–CD150+), MPP1 (LKS CD34+Flt3–CD48–CD150+), and LT-HSC EPCR+CD41+ subpopulation (LKS CD34–Flt3–CD48–CD150+EPCR+CD41+) in BM of WT SPF, IL-1R1KO SPF, and WT GF mice. For 2mo mice, LT-HSCs: n = 12 WT, 12 IL-1R1KO, 8 GF; MPP1: n = 9 WT, 12 IL-1R1KO, 8 GF; LT-HSC EPCR+CD41+: n = 9 WT, 12 IL-1R1KO, 8 GF. For 1y mice, LT-HSCs: n = 17 WT, 9 IL-1R1KO, 7 GF; MPP1: n = 13 WT, 9 IL-1R1KO, 8 GF; LT-HSC EPCR+CD41+: n = 13 WT, 9 IL-1R1KO, 8 GF. For 2y mice, LT-HSCs: n = 12 WT, 10 IL-1R1KO; MPP1: n = 8 WT, 10 IL-1R1KO; LT-HSC EPCR+CD41+: n = 8 WT, 10 IL-1R1KO. (D) Cell cycle profiling of phenotypic LT-HSCs (LKS CD34–Flt3–CD48–CD150+) from WT SPF, IL-1R1KO SPF, and WT GF mice. For 2mo, n = 5 WT, 4 IL-1R1KO, 4 GF. For 1y mice, n = 5 WT, 4 IL-1R1KO, 6 GF. For 2y mice, n = 5 WT, 7 IL-1R1KO. Error bars represent standard deviation (SD) in all panels. P values were calculated using Student t test. *P < .05; **P < .01; ***P < .001; ****P < .0001. HGB, hemoglobin; N.A., not applicable; PLT, platelet; RBC, red blood cell; WBC, white blood cell.
IL-1 is decreased in older WT GF mice, and WT GF and IL-1R1KO SPF mice show a reduced aging-associated increase of neutrophils, platelets, and phenotypic HSCs. (A) Concentration of IL-1a and IL-1b in BM and PB lysates in WT SPF, IL-1R1KO SPF, and WT GF animals. For 2mo mice, BM lysate: IL-1a, n = 32 WT, 8 IL-1R1KO, 17 GF; IL-1b, n = 16 WT, 8 IL-1R1KO, 20 GF; PB lysate: IL-1a, n = 34 WT, 9 IL-1R1KO, 4 GF; IL-1b, n = 26 WT, 9 IL-1R1KO, 4 GF. For 1y mice, BM lysate: IL-1a, n = 15 WT, 8 IL-1R1KO, 10 GF; IL-1b, n = 15 WT, 8 IL-1R1KO, 10 GF; PB lysate: IL-1a, n = 12 WT, 6 IL-1R1KO, 6 GF; IL-1b, n = 19 WT, 6 IL-1R1KO, 6 GF. For 2y mice, BM lysate: IL-1a, n = 35 WT, 10 IL-1R1KO; IL-1b, n = 22 WT, 11 IL-1R1KO; PB lysate: IL-1a, n = 30 WT, 10 IL-1R1KO; IL-1b, n = 29 WT, 10 IL-1R1KO. (B) PB cell counts in WT SPF, IL-1R1KO SPF, and WT GF mice. For 2mo mice, n = 26 WT, 26 IL-1R1KO, 12 GF; 1y mice, n = 36 WT, 19 IL-1R1KO, 13 GF; and for 2y mice, n = 30 WT, 22 IL-1R1KO. (C) Frequency of phenotypic LT-HSCs (LKS CD34–Flt3–CD48–CD150+), MPP1 (LKS CD34+Flt3–CD48–CD150+), and LT-HSC EPCR+CD41+ subpopulation (LKS CD34–Flt3–CD48–CD150+EPCR+CD41+) in BM of WT SPF, IL-1R1KO SPF, and WT GF mice. For 2mo mice, LT-HSCs: n = 12 WT, 12 IL-1R1KO, 8 GF; MPP1: n = 9 WT, 12 IL-1R1KO, 8 GF; LT-HSC EPCR+CD41+: n = 9 WT, 12 IL-1R1KO, 8 GF. For 1y mice, LT-HSCs: n = 17 WT, 9 IL-1R1KO, 7 GF; MPP1: n = 13 WT, 9 IL-1R1KO, 8 GF; LT-HSC EPCR+CD41+: n = 13 WT, 9 IL-1R1KO, 8 GF. For 2y mice, LT-HSCs: n = 12 WT, 10 IL-1R1KO; MPP1: n = 8 WT, 10 IL-1R1KO; LT-HSC EPCR+CD41+: n = 8 WT, 10 IL-1R1KO. (D) Cell cycle profiling of phenotypic LT-HSCs (LKS CD34–Flt3–CD48–CD150+) from WT SPF, IL-1R1KO SPF, and WT GF mice. For 2mo, n = 5 WT, 4 IL-1R1KO, 4 GF. For 1y mice, n = 5 WT, 4 IL-1R1KO, 6 GF. For 2y mice, n = 5 WT, 7 IL-1R1KO. Error bars represent standard deviation (SD) in all panels. P values were calculated using Student t test. *P < .05; **P < .01; ***P < .001; ****P < .0001. HGB, hemoglobin; N.A., not applicable; PLT, platelet; RBC, red blood cell; WBC, white blood cell.
In WT mouse aging, the typical hematopoietic traits are anemia, increased platelets, reduced relative frequency of lymphocytes, and increased relative frequencies of neutrophils (Figure 3B; supplemental Figure 3B).1 All of these general traits were lacking in older GF mice and were partially rescued in IL-1R1KO (SPF) older mice (only neutrophil fraction and platelet numbers) as shown in group comparison in Figure 3B and correlation analysis per animal basis in supplemental Figure 3B. Furthermore, it was demonstrated that in older WT mice, BM HSC frequencies are phenotypically and functionally increased, even though these HSCs are impaired in their function.4,33,34,39 In line with that observation, we also observed significant increases in LT-HSCs, in the multipotent progenitor 1 (MPP1) population, and in the specific subtype of LT-HSC CD41+EPCR+ in 1-year-old and 2-year-old WT SPF mice. In contrast, frequencies of these populations were significantly less expanded in IL-1R1KO SPF and WT GF older mice compared with WT SPF older mice (Figure 3C; supplemental Figure 3C-D). Moreover, the fraction of cell cycle–quiescent LT-HSCs in GO state increased with age in both 1-year-old and 2-year-old WT SPF mice, whereas this increase was delayed to 2 years of age in IL-1R1KO SPF mice and was absent in 1-year-old WT GF mice compared with respective 2-month-old mice (Figure 3D). Altogether, these data demonstrate that both the microbiome and IL-1 significantly contribute to the typical hematopoietic phenotype in aging mice.
Microbially derived compounds are upregulated in blood of older mice, and older BM responds with increased and sustained IL-1 secretion upon stimulation with LPS
On the basis of previous knowledge38,40 and on our new data, we hypothesized that age-associated increased circulating microbial compounds might enhance IL-1 production and secretion from tissues, including BM cells. Toll-like receptors (TLRs) and nucleotide-binding and oligomerization domain (NOD) receptors are key sensors of microbially derived compounds such as LPS (TLR4 agonist), flagellin from Salmonella typhimurium (Fla-ST; TLR5 agonist), muramyl dipeptide (MDP; NOD2 agonist), imidazoquinoline (CL097; TLR7 and TLR8 agonist), and triacylated lipopeptide (Pam3CSK4; TLR2/1 and TLR2/6 agonist).41 We thus measured concentrations of bacterial compounds in blood of aging mice using human TLR (hTLR)/NOD HEK-Blue reporter cell lines. Indeed, both TLR4 and TLR8 ligands were significantly upregulated in heat-inactivated plasma samples from 2-year-old WT SPF mice compared with 2-month-old WT SPF mice (Figure 4A). A similar but nonsignificant trend was observed with other TLR and NOD2 ligands. Serum levels of bacterial compounds in older WT GF mice remained lower than those in older WT SPF mice (supplemental Figure 3A). LPS levels in heat-inactivated plasma were also higher in 2-year-old mice compared with 2-month-old mice as measured by ELISA. Interestingly, levels of LPS-binding protein were also higher in the serum of 2-year-old mice compared with 2-month-old mice (supplemental Figure 3B-C).
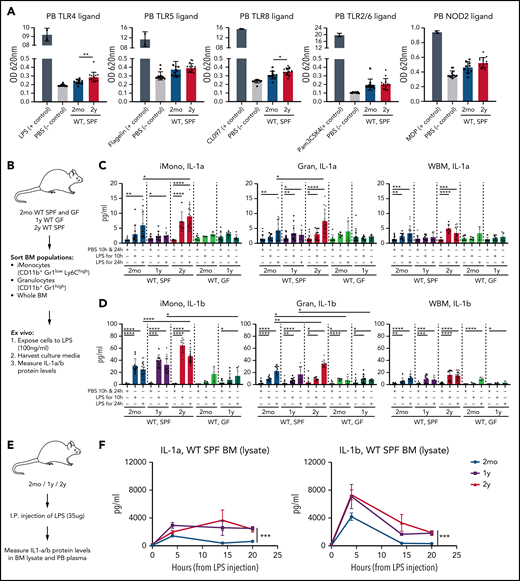
Microbially derived compounds are increased in blood of older mice, and older BM responds with increased and sustained IL-1 secretion upon LPS stimulation. (A) Relative levels of TLR and NOD2 ligands in heat-inactivated plasma samples from 2mo (n = 11) and 2y (n = 14) WT SPF mice measured by TLR/NOD HEK-Blue reporter cell lines. Selective ligands (n = 2) used as positive controls are indicated; unstimulated (PBS; n = 13) mice were used as negative controls. Measurements were taken from distinct animals, and distinct ligands were checked in the same plasma samples. (B) Experimental approach to test total BM and BM myeloid cell response to bacterial compounds in vitro. BM-resident iMono, CD11b+Gr1lowLy6Chigh; Gran, CD11b+Gr1high; and WBM nucleated cells were sorted from 2mo and 2y WT SPF and 2mo and 1y WT GF mice, seeded into 48-well plates (5 × 10⁵ cells per well), and stimulated with PBS or LPS (100 ng/mL). After 10 and 24 hours, supernatants were harvested and IL-1a and IL-1b concentrations were measured by enzyme-linked immunosorbent assay (ELISA). Measurements were taken from distinct samples. (C) IL-1a concentration in supernatants after PBS or LPS stimulation of indicated cell populations from WT SPF, IL-1R1KO SPF, and WT GF mice. For 2mo mice, iMono: n = 10 WT-PBS, 12 WT-LPS10h, 19 WT-LPS24h, 6 GF-PBS, 3 GF-LPS10h, 3 GF-LPS24h; Gran: n = 22 WT-PBS, 10 WT-LPS10h, 21 WT-LPS24h, 8 GF-PBS, 5 GF-LPS10h, 5 GF-LPS24h; WBM: n = 25 WT-PBS, 11 WT-LPS10h, 15 WT-LPS24h, 8 GF-PBS, 4 GF-LPS10h, 4 GF-LPS24h). For 1y mice, iMono: n = 15 WT-PBS, 9 WT-LPS10h, 9 WT-LPS24h, 9 GF-PBS, 7 GF-LPS10h, 6 GF-LPS24h; Gran: n = 24 WT-PBS, 12 WT-LPS10h, 9 WT-LPS24h, 18 GF-PBS, 9 GF-LPS10h, 9 GF-LPS24h; WBM: n = 14 WT-PBS, 8 WT-LPS10h, 6 WT-LPS24h, 11 GF-PBS, 7 GF-LPS10h, 5 GF-LPS24h. For 2y mice, iMono: n = 12 WT-PBS, 6 WT-LPS10h, 16 WT-LPS24h; Gran: n = 15 WT-PBS, 9 WT-LPS10h, 15 WT-LPS24h; WBM: n = 13 WT-PBS, 6 WT-LPS10h, 13 WT-LPS24h. (D). IL-1b concentration in supernatants after PBS or LPS stimulation of indicated cell populations from WT SPF, IL-1R1KO SPF, and WT GF mice. For 2mo, iMono: n = 14 WT-PBS, 10 WT-LPS10h, 19 WT-LPS24h, 3 GF-PBS, 4 GF-LPS10h, 3 GF-LPS24h; Gran: n = 17 WT-PBS, 11 WT-LPS10h, 16 WT-LPS24h, 8 GF-PBS, 4 GF-LPS10h, 5 GF-LPS24h; tBM: n = 19 WT-PBS, 8 WT-LPS10h, 12 WT-LPS24h, 7 GF-PBS, 4 GF-LPS10h, 3 GF-LPS24h. For 1y mice, iMono: n = 6 WT-PBS, 9 WT-LPS10h, 11 WT-LPS24h, 10 GF-PBS, 9 GF-LPS10h, 6 GF-LPS24h; Gran: n = 24 WT-PBS, 12 WT-LPS10h, 9 WT-LPS24h, 15 GF-PBS, 11 GF-LPS10h, 9 GF-LPS24h; tBM: n = 14 WT-PBS, 8 WT-LPS10h, 6 WT-LPS24h, 9 GF-PBS, 6 GF-LPS10h, 3 GF-LPS24h. For 2y mice, iMono: n = 13 WT-PBS, 6 WT-LPS10h, 17 WT-LPS24h; Gran: n = 14 WT-PBS, 6 WT-LPS10h, 10 WT-LPS24h; tBM: n = 21 WT-PBS, 9 WT-LPS10h, 18 WT-LPS24h. (E) Experimental approach to measure differences in LPS response between young and older mice in vivo. First, 2mo, 1y, and 2y mice were intraperitoneally injected with PBS or LPS (35 μg per mouse). PB and femur BM lysates were harvested 4, 14, or 20 hours later, and IL-1a and IL-1b concentrations were measured by ELISA. (F) IL-1a and IL-1b concentrations in BM lysates of 2mo, 1y, and 2y mice 4, 14, and 20 hours after injection with PBS or LPS. For 2mo mice, IL-1a: PBS0h, n = 11; LPS4h, n = 13; LPS14h, n = 4; LPS20h, n = 5. IL-1b: PBS0h, n = 9; LPS4h, n = 10; LPS14h, n = 5; LPS 20h, n = 5. For 1y mice, IL-1a: PBS0h, n = 7; LPS4h, n = 4; LPS14h, n = 5; LPS20h, n = 5; IL-1b: PBS0h, n = 5; LPS4h, n = 4; LPS14h, n = 5; LPS20h, n = 5. For 2y mice, IL-1a: PBS0h, n = 14; LPS4h, n = 10; LPS14h, n = 4; LPS20h, n = 5; IL-1b: PBS0h, n = 13; LPS4h, n = 11; LPS14h, n = 4; LPS20h, n = 5. Error bars represent SD in all panels. P values were calculated using Student t test. *P < .05; **P < .01; ***P < .001; ****P < .0001. OD, optical density; tBM, total BM.
Microbially derived compounds are increased in blood of older mice, and older BM responds with increased and sustained IL-1 secretion upon LPS stimulation. (A) Relative levels of TLR and NOD2 ligands in heat-inactivated plasma samples from 2mo (n = 11) and 2y (n = 14) WT SPF mice measured by TLR/NOD HEK-Blue reporter cell lines. Selective ligands (n = 2) used as positive controls are indicated; unstimulated (PBS; n = 13) mice were used as negative controls. Measurements were taken from distinct animals, and distinct ligands were checked in the same plasma samples. (B) Experimental approach to test total BM and BM myeloid cell response to bacterial compounds in vitro. BM-resident iMono, CD11b+Gr1lowLy6Chigh; Gran, CD11b+Gr1high; and WBM nucleated cells were sorted from 2mo and 2y WT SPF and 2mo and 1y WT GF mice, seeded into 48-well plates (5 × 10⁵ cells per well), and stimulated with PBS or LPS (100 ng/mL). After 10 and 24 hours, supernatants were harvested and IL-1a and IL-1b concentrations were measured by enzyme-linked immunosorbent assay (ELISA). Measurements were taken from distinct samples. (C) IL-1a concentration in supernatants after PBS or LPS stimulation of indicated cell populations from WT SPF, IL-1R1KO SPF, and WT GF mice. For 2mo mice, iMono: n = 10 WT-PBS, 12 WT-LPS10h, 19 WT-LPS24h, 6 GF-PBS, 3 GF-LPS10h, 3 GF-LPS24h; Gran: n = 22 WT-PBS, 10 WT-LPS10h, 21 WT-LPS24h, 8 GF-PBS, 5 GF-LPS10h, 5 GF-LPS24h; WBM: n = 25 WT-PBS, 11 WT-LPS10h, 15 WT-LPS24h, 8 GF-PBS, 4 GF-LPS10h, 4 GF-LPS24h). For 1y mice, iMono: n = 15 WT-PBS, 9 WT-LPS10h, 9 WT-LPS24h, 9 GF-PBS, 7 GF-LPS10h, 6 GF-LPS24h; Gran: n = 24 WT-PBS, 12 WT-LPS10h, 9 WT-LPS24h, 18 GF-PBS, 9 GF-LPS10h, 9 GF-LPS24h; WBM: n = 14 WT-PBS, 8 WT-LPS10h, 6 WT-LPS24h, 11 GF-PBS, 7 GF-LPS10h, 5 GF-LPS24h. For 2y mice, iMono: n = 12 WT-PBS, 6 WT-LPS10h, 16 WT-LPS24h; Gran: n = 15 WT-PBS, 9 WT-LPS10h, 15 WT-LPS24h; WBM: n = 13 WT-PBS, 6 WT-LPS10h, 13 WT-LPS24h. (D). IL-1b concentration in supernatants after PBS or LPS stimulation of indicated cell populations from WT SPF, IL-1R1KO SPF, and WT GF mice. For 2mo, iMono: n = 14 WT-PBS, 10 WT-LPS10h, 19 WT-LPS24h, 3 GF-PBS, 4 GF-LPS10h, 3 GF-LPS24h; Gran: n = 17 WT-PBS, 11 WT-LPS10h, 16 WT-LPS24h, 8 GF-PBS, 4 GF-LPS10h, 5 GF-LPS24h; tBM: n = 19 WT-PBS, 8 WT-LPS10h, 12 WT-LPS24h, 7 GF-PBS, 4 GF-LPS10h, 3 GF-LPS24h. For 1y mice, iMono: n = 6 WT-PBS, 9 WT-LPS10h, 11 WT-LPS24h, 10 GF-PBS, 9 GF-LPS10h, 6 GF-LPS24h; Gran: n = 24 WT-PBS, 12 WT-LPS10h, 9 WT-LPS24h, 15 GF-PBS, 11 GF-LPS10h, 9 GF-LPS24h; tBM: n = 14 WT-PBS, 8 WT-LPS10h, 6 WT-LPS24h, 9 GF-PBS, 6 GF-LPS10h, 3 GF-LPS24h. For 2y mice, iMono: n = 13 WT-PBS, 6 WT-LPS10h, 17 WT-LPS24h; Gran: n = 14 WT-PBS, 6 WT-LPS10h, 10 WT-LPS24h; tBM: n = 21 WT-PBS, 9 WT-LPS10h, 18 WT-LPS24h. (E) Experimental approach to measure differences in LPS response between young and older mice in vivo. First, 2mo, 1y, and 2y mice were intraperitoneally injected with PBS or LPS (35 μg per mouse). PB and femur BM lysates were harvested 4, 14, or 20 hours later, and IL-1a and IL-1b concentrations were measured by ELISA. (F) IL-1a and IL-1b concentrations in BM lysates of 2mo, 1y, and 2y mice 4, 14, and 20 hours after injection with PBS or LPS. For 2mo mice, IL-1a: PBS0h, n = 11; LPS4h, n = 13; LPS14h, n = 4; LPS20h, n = 5. IL-1b: PBS0h, n = 9; LPS4h, n = 10; LPS14h, n = 5; LPS 20h, n = 5. For 1y mice, IL-1a: PBS0h, n = 7; LPS4h, n = 4; LPS14h, n = 5; LPS20h, n = 5; IL-1b: PBS0h, n = 5; LPS4h, n = 4; LPS14h, n = 5; LPS20h, n = 5. For 2y mice, IL-1a: PBS0h, n = 14; LPS4h, n = 10; LPS14h, n = 4; LPS20h, n = 5; IL-1b: PBS0h, n = 13; LPS4h, n = 11; LPS14h, n = 4; LPS20h, n = 5. Error bars represent SD in all panels. P values were calculated using Student t test. *P < .05; **P < .01; ***P < .001; ****P < .0001. OD, optical density; tBM, total BM.
We next tested the IL-1 response of young and old BM-derived myeloid cells to LPS. First, we analyzed the LPS response of myeloid cells (inflammatory monocytes, granulocytes) from 2-month-old and 2-year-old WT SPF and 2-month-old and 1-year-old WT GF mice (Figure 4B). LPS stimulation resulted in higher levels release of IL-1a and IL-1b across all WT SPF–derived cells compared with PBS controls but not in all WT GF cells. Inflammatory monocytes and granulocytes from 2-year-old WT SPF mice produced higher amounts of IL-1a/b at 24 hours of stimulation (Figure 4C) compared with respective cells derived from 2-month-old mice, whereas WBM cells from young and older mice release similar levels of IL-1a/b upon stimulation with LPS. Notably, LPS stimulation of myeloid cells from GF young and old mice led to an approximately fivefold lower IL-1a/b response and, importantly, no difference was detectable between young and old GF mouse-derived myeloid cell IL-1a/b production (Figure 4D).
We then tested in vivo IL-1 induction by intraperitoneally injecting LPS (35 μg26) into 2-month-old, 1-year-old, and 2-year-old WT SPF mice (Figure 4E). IL-1a/b responses were higher in 1-year-old and 2-year-old BM lysates compared with 2-month-old BM at each time point (4, 14, and 20 hours) (Figure 4F). Similar trends were detectable in PB (supplemental Figure 4B-C). Other TLR and NOD ligands (muramyl dipeptide, flagellin Fla-ST, TLR7/8 agonist CL097, TLR2/6 agonist Pam3CSK4) did not induce IL-1 production as strongly as LPS 20 hours after a single intraperitoneal injection (Figure 4F; supplemental Figure 3C-F). Collectively, these data demonstrate elevated levels of microbiome-derived bacterial compounds in the blood of older mice and stronger and more sustained IL-1a/b responses upon LPS stimulation from older cellular compartments of WT mice in vitro and in vivo.
Older HSC populations from WT GF and IL-1R1KO mice do not generate myeloid-biased output upon transplantation
Several previous studies have reported myeloid-biased lineage output from older HSCs upon transplantation into lethally irradiated young mice.3,4,6,33,42 To test the effect of IL-1R1 expression or GF conditions on HSC functionality in aging, we transplanted 10 or 100 LT-HSCs derived from 2-month-old, 1-year-old, and 2-year-old WT SPF and IL-1R1KO SPF mice, as well as 2-month-old and 1-year-old WT GF mice into lethally irradiated 8- to 12-week-old mice together with rescue total BM cells (Figure 5A). HSCs from older WT SPF mice produced myeloid-biased output from both 1-year-old (significant P < .05 for 100 HSCs) and from 2-year-old donor mice (significant P < .05 for 10 HSCs; P < .001 for 100 HSCs; Student t test for myeloid cell percent), whereas respective HSCs from 2-month-old mice generated balanced lineage output, confirming previous data. In contrast, HSCs from older IL-1R1KO SPF and WT GF mice produced balanced or lymphoid-biased differentiation output, similar to their respective control HSCs from 2-month-old mice (Figure 5B). As expected, LT-HSCs from both 1-year-old and 2-year-old mice demonstrated low engraftment levels in the BM and PB (Figure 5B-C) compared with the HSCs from 2-month-old mice. This trait was not reversed in IL-1R1KO older HSCs. Moreover, HSCs from 2-month-old and 1-year-old WT GF mice displayed overall lower levels of engraftment.
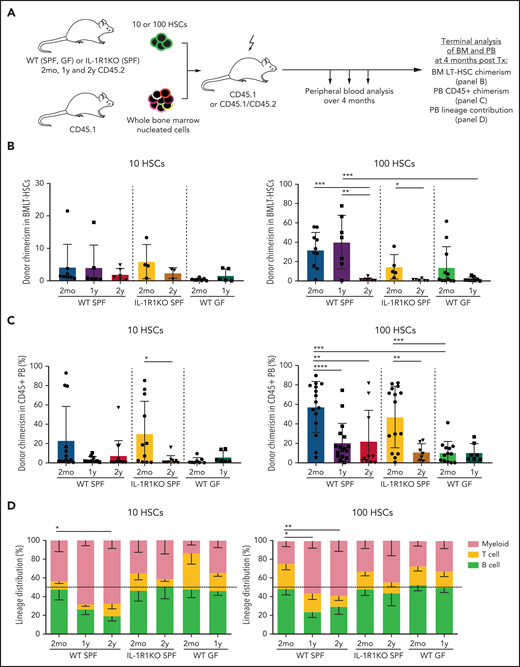
Older HSC populations from WT GF and IL-1R1KO SPF mice do not generate myeloid-biased output upon transplantation. (A) Schematic experimental approach to test self-renewal and differentiation capacity of 2mo, 1y, and 2y LT-HSCs from WT SPF, IL-1R1KO SPF, and WT GF mice. Phenotypic LT-HSCs (10 or 100 LKS CD34–Flt3–CD48–CD150+ cells) from CD45.2 mice were transplanted together with rescue total BM (300 000 cells from CD45.1 mice) into lethally irradiated mice (CD45.1+ or F1 CD45.1+/CD45.2+). Transplanted mice were bled once per month to follow donor engraftment and lineage repopulation capacities. BM LT-HSC donor chimerism, PB CD45+ donor chimerism, and PB lineage contribution of donor LT-HSCs was assessed 4 months after transplantation (Tx). (B) BM chimerism frequency analysis of donor (CD45.2+) LT-HSCs from 2mo, 1y, and 2y LT-HSCs from WT SPF, IL-1R1KO SPF, and WT GF donor mice 4 months after transplantation. WT SPF 2mo 10/100 cells, n = 8/10; WT SPF 1y 10/100 cells, n = 6/7; WT SPF 2y 10/100 cells, n = 6/7; IL-1R1KO SPF 2mo 10/100 cells, n = 4/5; IL-1R1KO SPF 2y 10/100 cells, n = 3/6; WT GF 2mo 10/100 cells, n = 8/11; WT GF 1y 10/100 cells, n = 5/9. In (B-D), “n” refers to recipient animals. For donors, a minimum of 3 biological replicas (1 biological replica is a pool of 2 mice) were used per condition. Engraftment levels of >0.1% were considered. (C) PB CD45+ chimerism contribution of 10 or 100 LT-HSCs from 2mo, 1y, and 2y LT-HSCs from WT SPF, IL-1R1KO SPF, and WT GF donor mice 4 months after transplantation. WT SPF 2mo 10/100 cells, n = 13/15; WT SPF 1y 10/100 cells, n = 10/17; WT SPF 2y 10/100 cells, n = 14/10; IL-1R1KO SPF 2mo 10/100 cells, n = 11/15; IL-1R1KO SPF 2y 10/100 cells, n = 10/7; WT GF 2mo 10/100 cells, n = 8/13; WT GF 1y 10/100 cells, n = 6/7. Engraftment levels of >0.1% were considered. (D) Lineage contribution of transplanted 10 or 100 LT-HSCs from 2mo, 1y, and 2y WT SPF, IL-1R1KO SPF, and WT GF mice 4 months after transplantation into WT SPF mice, respectively. Transplanted HSC contribution to myeloid cells (CD45.2+ CD11b+CD3e–CD19–) is indicated in red, to T cells (CD45.2+ CD3e+CD19–) in yellow, and to B cells (CD45.2+ CD3e–CD19+) in light green. WT SPF 2mo 10/100 cells, n = 11/12; WT SPF 1y 10/100 cells, n = 5/9; WT SPF 2y 10/100 cells, n = 9/11; IL-1R1KO SPF 2mo 10/100 cells, n = 11/15; IL-1R1KO SPF 2y 10/100 cells, n = 10/7; WT GF 2mo 10/100 cells, n = 8/13; WT GF 1y 10/100 cells, n = 6/7. Dashed line represents 50% cut off for biased lineage repopulation. Error bars represent SD in (B-C) and SEM in (D). P values were calculated using Student t test. *P < .05; **P < .01; ***P < .001; ****P < .0001.
Older HSC populations from WT GF and IL-1R1KO SPF mice do not generate myeloid-biased output upon transplantation. (A) Schematic experimental approach to test self-renewal and differentiation capacity of 2mo, 1y, and 2y LT-HSCs from WT SPF, IL-1R1KO SPF, and WT GF mice. Phenotypic LT-HSCs (10 or 100 LKS CD34–Flt3–CD48–CD150+ cells) from CD45.2 mice were transplanted together with rescue total BM (300 000 cells from CD45.1 mice) into lethally irradiated mice (CD45.1+ or F1 CD45.1+/CD45.2+). Transplanted mice were bled once per month to follow donor engraftment and lineage repopulation capacities. BM LT-HSC donor chimerism, PB CD45+ donor chimerism, and PB lineage contribution of donor LT-HSCs was assessed 4 months after transplantation (Tx). (B) BM chimerism frequency analysis of donor (CD45.2+) LT-HSCs from 2mo, 1y, and 2y LT-HSCs from WT SPF, IL-1R1KO SPF, and WT GF donor mice 4 months after transplantation. WT SPF 2mo 10/100 cells, n = 8/10; WT SPF 1y 10/100 cells, n = 6/7; WT SPF 2y 10/100 cells, n = 6/7; IL-1R1KO SPF 2mo 10/100 cells, n = 4/5; IL-1R1KO SPF 2y 10/100 cells, n = 3/6; WT GF 2mo 10/100 cells, n = 8/11; WT GF 1y 10/100 cells, n = 5/9. In (B-D), “n” refers to recipient animals. For donors, a minimum of 3 biological replicas (1 biological replica is a pool of 2 mice) were used per condition. Engraftment levels of >0.1% were considered. (C) PB CD45+ chimerism contribution of 10 or 100 LT-HSCs from 2mo, 1y, and 2y LT-HSCs from WT SPF, IL-1R1KO SPF, and WT GF donor mice 4 months after transplantation. WT SPF 2mo 10/100 cells, n = 13/15; WT SPF 1y 10/100 cells, n = 10/17; WT SPF 2y 10/100 cells, n = 14/10; IL-1R1KO SPF 2mo 10/100 cells, n = 11/15; IL-1R1KO SPF 2y 10/100 cells, n = 10/7; WT GF 2mo 10/100 cells, n = 8/13; WT GF 1y 10/100 cells, n = 6/7. Engraftment levels of >0.1% were considered. (D) Lineage contribution of transplanted 10 or 100 LT-HSCs from 2mo, 1y, and 2y WT SPF, IL-1R1KO SPF, and WT GF mice 4 months after transplantation into WT SPF mice, respectively. Transplanted HSC contribution to myeloid cells (CD45.2+ CD11b+CD3e–CD19–) is indicated in red, to T cells (CD45.2+ CD3e+CD19–) in yellow, and to B cells (CD45.2+ CD3e–CD19+) in light green. WT SPF 2mo 10/100 cells, n = 11/12; WT SPF 1y 10/100 cells, n = 5/9; WT SPF 2y 10/100 cells, n = 9/11; IL-1R1KO SPF 2mo 10/100 cells, n = 11/15; IL-1R1KO SPF 2y 10/100 cells, n = 10/7; WT GF 2mo 10/100 cells, n = 8/13; WT GF 1y 10/100 cells, n = 6/7. Dashed line represents 50% cut off for biased lineage repopulation. Error bars represent SD in (B-C) and SEM in (D). P values were calculated using Student t test. *P < .05; **P < .01; ***P < .001; ****P < .0001.
To determine whether the effect of IL-1 on LT-HSC functionality during aging is direct or indirect, we analyzed the BM and PB chimerism as well as lineage contribution of WT and IL-1R1KO LT-HSCs that were concomitantly older for 8 months in young lethally irradiated WT F1 recipient mice (supplemental Figure 5A). We observed that even in older mice in the same environment that have been exposed to the same inflammatory milieu, IL-1R1KO LT-HSCs maintain their multilineage-differentiation capacity (supplemental Figure 5E) despite their reduced BM and PB chimerism (supplemental Figure 5C-D). These data suggest that the development of a myeloid bias in older WT LT-HSCs is likely a result of direct sensing of environmental IL-1 by HSCs. Engraftment levels of both genotypes in the PB was not significantly changed, whereas BM analysis showed higher engraftment of WT experimentally older HSCs compared with IL-1R1KO older HSCs. Next, to further determine the role of the microbiome in inducing myeloid-biased differentiation of HSCs during aging, we used older mice that had low microbiome complexity (harboring 20 to 100 bacterial strains),21 were gnotobiotic (GB; colonized with 12 bacterial strains),43 or were oligocolonized for 1 year. Similar to 1-year-old WT SPF HSCs, HSCs from both 1-year-old mice with low microbiome complexity (nonsignificant) or 1-year-old GB mice (P < .05) demonstrated higher myeloid lineage output and lower engraftment levels in PB and BM compared with the 2-month-old WT HSCs, indicating that the presence of a few bacterial strains is enough to induce myeloid-biased lineage output. Together, these data demonstrate that the microbiome and the IL-1/IL-1R1 axis directly imprint an aging-associated myeloid differentiation readout on HSCs upon transplantation while not significantly affecting engraftment and repopulating capacities of HSCs during aging.
IL-1ra and antibiotic treatment rebalances lymphoid-myeloid readout of older HSC populations
Given the impact of the microbiota and IL-1a/b on aging of HSCs and that IL-1 signaling inhibition in the context of collagen-induced arthritis was shown to block myeloid cell expansion,44 we hypothesized that inhibiting signaling induced by IL-1 and/or quantitatively reducing the microbiome in mice might reverse the myeloid-biased readout of older HSC populations. We thus administered anakinra (hIL-1ra, 37 μg per mouse) once per day intraperitoneally over 3 weeks in 2-month-old and 2-year-old WT SPF mice. In another set of experiments, we applied antibiotics to drinking water for 8 weeks for 2-month-old and 2-year-old mice. We then transplanted populations of 200 (for anakinra treatment) or 100 (for antibiotic treatment) phenotypically defined and sorted LT-HSCs from treated mice into lethally irradiated recipient mice to test their engraftment and differentiation capacity (Figure 6A). Strikingly, both treatments led to the reduction of the myeloid bias and to a more balanced lineage output of 2-year-old HSCs compared with controls (Figure 6D,G), and it did not affect the engraftment capacity of LT-HSCs (Figure 6B-C,E-F). Moreover, antibiotic treatment significantly reduced the concentration of IL-1a in BM lysates in 2-year-old mice, further confirming microbiome-induced IL-1 production in older mice (supplemental Figure 7A). Neither anakinra treatment nor antibiotic treatment significantly affected the PB hematologic parameters (except for a mild decrease of platelets and white blood cells upon anakinra treatment) or BM HSPC counts (supplemental Figure 7B-E). Similarly, treatment with anakinra or antibiotics does not affect the cell cycle status of LT-HSCs (supplemental Figure 7D). These results demonstrate that the aging-associated acquired myeloid bias of HSC populations can be reversed, either by directly inhibiting IL-1 or by reducing the microbial load in vivo.
![IL-1 receptor antagonist or antibiotic treatment of WT SPF donor mice increases lymphoid differentiation of older HSC populations upon transplantation. (A) Experimental approach to test the effects of blocking IL-1 signaling and reducing bacterial load. First, 2mo and 2y WT SPF mice were given water containing antibiotics (ABx) (ampicillin 1 mg/mL, vancomycin 1 mg/mL, neomycin sulfate 0.5 mg/mL, metronidazole 1 mg/mL) for 8 weeks. Alternatively, mice were injected once per day with PBS or anakinra (hIL-1ra 37 μg per injection per mouse) for 3 weeks. CD45.2+ LT-HSCs (LKS CD34–Flt3–CD48–CD150+) were isolated from treated animals and 100 or 200 fluorescence-activated cell sorted cells were transplanted into lethally irradiated recipients. BM LT-HSC donor chimerism, PB CD45+ donor chimerism, and PB lineage contribution of donor LT-HSCs were assessed 4 months after transplantation. (B) BM chimerism frequency analysis of donor (CD45.2+) LT-HSCs from anakinra- or PBS-treated 2mo and 2y WT SPF donor mice 4 months after transplantation. PBS 2mo, n = 5; hIL-1ra 2mo, n = 5; PBS 2y, n = 5; hIL-1ra 2y, n = 6. In (B-D), “n” refers to recipient animals. For donors, 3 young PBS-, 3 young anakinra-, 3 older PBS-, and 3 older anakinra-treated animals were used. (C) PB chimerism frequency analysis of donor (CD45.2+) leukocytes from anakinra- or PBS-treated 2mo and 2y WT SPF donor mice 4 months after transplantation. PBS 2mo, n = 5; hIL-1ra 2mo, n = 5; PBS 2y, n = 5; hIL-1ra 2y, n = 6. Engraftment levels of >0.1% were considered. (D) Lineage contribution of LT-HSCs from 2mo and 2y WT SPF donor mice treated with anakinra or PBS 4 months after transplantation. Donor cell contribution in myeloid cells (CD45.2+ CD11b+CD3e–CD19–) is shown in red, T cells (CD45.2+ CD3e+CD19–) yellow, B cells (CD45.2+ CD3e–CD19+) green. PBS 2mo, n = 5; hIL-1ra 2mo, n = 5; PBS 2y, n = 5; hIL-1ra 2y, n = 6. (E) BM chimerism frequency analysis of donor (CD45.2+) LT-HSCs from 2mo and 2y WT SPF donor mice treated with antibiotics or normal drinking water (ie, untreated [Untr]) 4 months after transplantation. Untr 2mo, n = 7; ABx 2mo, n = 7; Untr 2y, n = 7; ABx 2y, n = 7. In (E-G), “n” refers to recipient animals. For donors, 3 young PBS-, 3 older PBS-, 5 young ABx-, and 5 older ABx-treated animals were used. (F) PB chimerism frequency analysis of donor (CD45.2+) leukocytes from 2mo and 2y WT SPF donor mice treated with antibiotics or normal drinking water 4 months after transplantation. Untr 2mo, n = 7; ABx 2mo, n = 7; Untr 2y, n = 7; ABx 2y, n = 7. (G) Lineage contribution of HSCs from young and old WT SPF donor mice treated with antibiotics or normal drinking water (untreated) 4 months after transplantation. Donor cell contributions in myeloid cells (CD45.2+ CD11b+CD3e–CD19–) are shown in red, in T cells (CD45.2+ CD3e+CD19–) yellow, and in B cells (CD45.2+ CD3e–CD19+) light green. Untr 2mo, n = 7; ABx 2mo, n = 7; Untr 2y, n = 7; ABx 2y, n = 7. Error bars represent SD in (B-C,E-F) and SEM in (D,G). P values were calculated using Student t test. *P < .05; **P < .01; ***P < .001; ****P < .0001.](https://ash.silverchair-cdn.com/ash/content_public/journal/blood/139/1/10.1182_blood.2021011570/4/m_bloodbld2021011570f6.png?Expires=1767738783&Signature=MKTbikL~cXI44JtQpoYA8m6TJveneXPmQDbWfC-2V--klGMY~N4MSDfBQtAfXpIRYQ1LPYD1-SuYXCe024ZJsscJKK1n0qdViXVAb5KXatp~CAwMMZgnPHDUXjZdmgzAb39qAyd17m0L7fa21AfHJ7wBTr3dqVqWGFeZTKymJFoPH-Tqxf0QVUHqXe7ffBQqUiyiac59wjGlmOc7YquMtD~BcSJGW8dsvj7b4BBXARg7wu9FL3DtmcqLpa-iPI8LK5GoLGaAGC~XRtx10lb-a6UyxEQpd472uQr5pFVKDbTze3zytEk321Ar6HX~4oAKsPmOlgYVU1mJRnqrAGJf0A__&Key-Pair-Id=APKAIE5G5CRDK6RD3PGA)
IL-1 receptor antagonist or antibiotic treatment of WT SPF donor mice increases lymphoid differentiation of older HSC populations upon transplantation. (A) Experimental approach to test the effects of blocking IL-1 signaling and reducing bacterial load. First, 2mo and 2y WT SPF mice were given water containing antibiotics (ABx) (ampicillin 1 mg/mL, vancomycin 1 mg/mL, neomycin sulfate 0.5 mg/mL, metronidazole 1 mg/mL) for 8 weeks. Alternatively, mice were injected once per day with PBS or anakinra (hIL-1ra 37 μg per injection per mouse) for 3 weeks. CD45.2+ LT-HSCs (LKS CD34–Flt3–CD48–CD150+) were isolated from treated animals and 100 or 200 fluorescence-activated cell sorted cells were transplanted into lethally irradiated recipients. BM LT-HSC donor chimerism, PB CD45+ donor chimerism, and PB lineage contribution of donor LT-HSCs were assessed 4 months after transplantation. (B) BM chimerism frequency analysis of donor (CD45.2+) LT-HSCs from anakinra- or PBS-treated 2mo and 2y WT SPF donor mice 4 months after transplantation. PBS 2mo, n = 5; hIL-1ra 2mo, n = 5; PBS 2y, n = 5; hIL-1ra 2y, n = 6. In (B-D), “n” refers to recipient animals. For donors, 3 young PBS-, 3 young anakinra-, 3 older PBS-, and 3 older anakinra-treated animals were used. (C) PB chimerism frequency analysis of donor (CD45.2+) leukocytes from anakinra- or PBS-treated 2mo and 2y WT SPF donor mice 4 months after transplantation. PBS 2mo, n = 5; hIL-1ra 2mo, n = 5; PBS 2y, n = 5; hIL-1ra 2y, n = 6. Engraftment levels of >0.1% were considered. (D) Lineage contribution of LT-HSCs from 2mo and 2y WT SPF donor mice treated with anakinra or PBS 4 months after transplantation. Donor cell contribution in myeloid cells (CD45.2+ CD11b+CD3e–CD19–) is shown in red, T cells (CD45.2+ CD3e+CD19–) yellow, B cells (CD45.2+ CD3e–CD19+) green. PBS 2mo, n = 5; hIL-1ra 2mo, n = 5; PBS 2y, n = 5; hIL-1ra 2y, n = 6. (E) BM chimerism frequency analysis of donor (CD45.2+) LT-HSCs from 2mo and 2y WT SPF donor mice treated with antibiotics or normal drinking water (ie, untreated [Untr]) 4 months after transplantation. Untr 2mo, n = 7; ABx 2mo, n = 7; Untr 2y, n = 7; ABx 2y, n = 7. In (E-G), “n” refers to recipient animals. For donors, 3 young PBS-, 3 older PBS-, 5 young ABx-, and 5 older ABx-treated animals were used. (F) PB chimerism frequency analysis of donor (CD45.2+) leukocytes from 2mo and 2y WT SPF donor mice treated with antibiotics or normal drinking water 4 months after transplantation. Untr 2mo, n = 7; ABx 2mo, n = 7; Untr 2y, n = 7; ABx 2y, n = 7. (G) Lineage contribution of HSCs from young and old WT SPF donor mice treated with antibiotics or normal drinking water (untreated) 4 months after transplantation. Donor cell contributions in myeloid cells (CD45.2+ CD11b+CD3e–CD19–) are shown in red, in T cells (CD45.2+ CD3e+CD19–) yellow, and in B cells (CD45.2+ CD3e–CD19+) light green. Untr 2mo, n = 7; ABx 2mo, n = 7; Untr 2y, n = 7; ABx 2y, n = 7. Error bars represent SD in (B-C,E-F) and SEM in (D,G). P values were calculated using Student t test. *P < .05; **P < .01; ***P < .001; ****P < .0001.
IL-1 receptor antagonist or antibiotic treatment of WT SPF donor mice increases lymphoid differentiation of older HSC populations upon transplantation. (A) Experimental approach to test the effects of blocking IL-1 signaling and reducing bacterial load. First, 2mo and 2y WT SPF mice were given water containing antibiotics (ABx) (ampicillin 1 mg/mL, vancomycin 1 mg/mL, neomycin sulfate 0.5 mg/mL, metronidazole 1 mg/mL) for 8 weeks. Alternatively, mice were injected once per day with PBS or anakinra (hIL-1ra 37 μg per injection per mouse) for 3 weeks. CD45.2+ LT-HSCs (LKS CD34–Flt3–CD48–CD150+) were isolated from treated animals and 100 or 200 fluorescence-activated cell sorted cells were transplanted into lethally irradiated recipients. BM LT-HSC donor chimerism, PB CD45+ donor chimerism, and PB lineage contribution of donor LT-HSCs were assessed 4 months after transplantation. (B) BM chimerism frequency analysis of donor (CD45.2+) LT-HSCs from anakinra- or PBS-treated 2mo and 2y WT SPF donor mice 4 months after transplantation. PBS 2mo, n = 5; hIL-1ra 2mo, n = 5; PBS 2y, n = 5; hIL-1ra 2y, n = 6. In (B-D), “n” refers to recipient animals. For donors, 3 young PBS-, 3 young anakinra-, 3 older PBS-, and 3 older anakinra-treated animals were used. (C) PB chimerism frequency analysis of donor (CD45.2+) leukocytes from anakinra- or PBS-treated 2mo and 2y WT SPF donor mice 4 months after transplantation. PBS 2mo, n = 5; hIL-1ra 2mo, n = 5; PBS 2y, n = 5; hIL-1ra 2y, n = 6. Engraftment levels of >0.1% were considered. (D) Lineage contribution of LT-HSCs from 2mo and 2y WT SPF donor mice treated with anakinra or PBS 4 months after transplantation. Donor cell contribution in myeloid cells (CD45.2+ CD11b+CD3e–CD19–) is shown in red, T cells (CD45.2+ CD3e+CD19–) yellow, B cells (CD45.2+ CD3e–CD19+) green. PBS 2mo, n = 5; hIL-1ra 2mo, n = 5; PBS 2y, n = 5; hIL-1ra 2y, n = 6. (E) BM chimerism frequency analysis of donor (CD45.2+) LT-HSCs from 2mo and 2y WT SPF donor mice treated with antibiotics or normal drinking water (ie, untreated [Untr]) 4 months after transplantation. Untr 2mo, n = 7; ABx 2mo, n = 7; Untr 2y, n = 7; ABx 2y, n = 7. In (E-G), “n” refers to recipient animals. For donors, 3 young PBS-, 3 older PBS-, 5 young ABx-, and 5 older ABx-treated animals were used. (F) PB chimerism frequency analysis of donor (CD45.2+) leukocytes from 2mo and 2y WT SPF donor mice treated with antibiotics or normal drinking water 4 months after transplantation. Untr 2mo, n = 7; ABx 2mo, n = 7; Untr 2y, n = 7; ABx 2y, n = 7. (G) Lineage contribution of HSCs from young and old WT SPF donor mice treated with antibiotics or normal drinking water (untreated) 4 months after transplantation. Donor cell contributions in myeloid cells (CD45.2+ CD11b+CD3e–CD19–) are shown in red, in T cells (CD45.2+ CD3e+CD19–) yellow, and in B cells (CD45.2+ CD3e–CD19+) light green. Untr 2mo, n = 7; ABx 2mo, n = 7; Untr 2y, n = 7; ABx 2y, n = 7. Error bars represent SD in (B-C,E-F) and SEM in (D,G). P values were calculated using Student t test. *P < .05; **P < .01; ***P < .001; ****P < .0001.
Discussion
In this study, we addressed the long-standing question of which extrinsic factors drive the process of HSC aging. We found that the protein levels of inflammatory cytokines and chemokines, including IL-1a and IL-1b (Figure 1A), are upregulated in WBM lysates of older WT SPF mice. IL-1a and IL-1b seem to be of particular relevance, not only because both are soluble factors transcriptionally upregulated within the BM (Figure 1B), indicating local production, but also because of their well-established capacity to recapitulate the aging-associated hematopoietic phenotype when exogenously administered to young mice.27 Accordingly, we demonstrated that IL-1 increases with age in WT SPF mice (Figure 3A) and is produced by multiple cell types including CAR cells,31 macrophages,18 inflammatory Ly-6Chigh cells, granulocytes, NK cells, and B cells (Figure 1C), with myeloid cells likely being the major contributors from a quantitative standpoint. Interestingly, increased IL-1 levels are paralleled by a gradual increase in platelets and in the relative ratio of circulating neutrophils compared with lymphocytes (Figure 3B) as well as accumulation of myeloid-biased HSCs.3,6,45,46 Indeed, we demonstrate that inflammatory cytokines are reduced in older IL-1R1KO mice, and this aging-associated phenotype is mitigated in IL-1R1KO mice, confirming the role of this pathway in hematopoietic function during aging. Moreover, IL-1R1 expression on HSC populations increases with age (Figure 1C),32 and thus, it can be speculated that this might render older HSCs more responsive to signaling mediated by IL-1R1 than young HSCs. However, lack of IL-1R1 on HSCs does not completely abrogate the aging-associated phenotype, indicating some redundancy in this process.
To assess the transcriptional consequences of IL-1R1 signaling in HSCs during aging, we performed RNA sequencing of young and old LT-HSC populations from SPF WT and IL-1R1KO animals. In line with our in vivo functional experiments (Figure 5B-D), older IL-1R1KO HSCs showed significantly higher expression of lymphoid genes (Blnk, Cd28, Ctla4, Egr3, Il7r, Nfatc2, Pbx1, Rftn1, Sh3rf1, Socs1) compared with WT older HSCs. We also identified a restricted subset of myeloid genes (Csf3r, Eto, Hoxb6, Meis2) that were expressed to a significantly lesser extent in older IL-1R1KO HSCs. Notably, the major transcriptional divergence between older WT and IL-1R1KO HSCs was the absence of GO terms related to inflammation and immune responses in IL-1R1KO compared with WT HSCs. These findings demonstrate that older HSCs directly receive tonic signaling through the IL-1R1 leading to profound transcriptional changes with an impact on HSC population differentiation capacity (Figure 5; supplemental Figure 5). Interestingly, it was recently reported47 that older HSCs exhibit higher levels of NF-κB activity (a known factor that acts downstream of IL-1r1 signaling as well as other inflammatory cytokine and pathogen-associated molecular pattern receptors) which is associated with increased myeloid differentiation bias. Whether tonic IL-1 signaling leads to a preferential expansion of myeloid-biased HSCs or drives myeloid differentiation bias in otherwise multilineage differentiation–competent cells remains to be determined.
Because aging is associated with increased intestinal permeability in both mice38 and humans,48 we hypothesized that microbiome-derived signals stimulate multiple cells in the BM to produce IL-1 and other inflammatory cytokines. Notably, it was demonstrated previously that even healthy individual myelopoiesis is sustained by continuous pro-inflammatory stimuli, partly because of microbial translocation from the intestinal lumen to the circulation.49 We previously demonstrated that circulating heat-resistant microbiome-derived compounds stimulate steady-state levels of granulopoiesis in young mice.21 Moreover, a recent study revealed that circulating microbiome-derived molecules are captured by CXCR3+ BM-resident mononuclear cells, thereby directly regulating myelopoiesis in young mice.22 Indeed, we found that TLR4 and TLR8 ligands are more abundant in heat-inactivated plasma samples from older compared with young mice. This finding in conjunction with our previous demonstration that the TLR4 ligand LPS, upon chronic stimulation, imprints loss of competitive fitness on HSCs,26 which strongly suggests that microbial compounds directly and indirectly regulate hematopoiesis via stimulation of IL-1 secretion. Importantly, we revealed here that older WT GF mice do not upregulate IL-1 in BM during aging, and concomitantly, do not develop aging-associated hematopoietic phenotypes. Moreover, older WT GF mice have fewer numbers of phenotypic LT-HSCs than age-matched WT SPF mice and do not exhibit myeloid-biased repopulation upon transplantation (Figures 3 and 5), similar to IL-1R1KO older mice. Surprisingly, the presence of few microbial strains in GB and low-complexity microbiome in 1-year-old mice is enough to induce myeloid-biased repopulation by LT-HSCs similar to that in 1-year-old WT SPF mice. We observed that older myeloid cells produce higher amounts of IL-1b upon in vitro stimulation with LPS compared with young controls (Figure 4B-D). Moreover, myeloid cells from older WT GF mice produce nearly fivefold less IL-1 in response to LPS than those of WT SPF mice in vitro. Older mice also exhibit stronger and more durable increases of IL-1 levels in BM, plasma, and PB lysates upon in vivo injection of LPS (Figure 4; supplemental Figure 4B-C), which is in line with the emerging concept of innate immune training.50-52 Altogether, our findings demonstrate the critical role of the microbiome in shaping the function of the hematopoietic system throughout life,53 and in particular, that the microbiome is a major driver of the aging-associated hematopoietic phenotype via stimulation of IL-1R1 signaling.
On the basis of published findings and our previous and current data, we propose an inflammaging model of hematopoiesis: during aging, an increasingly leaky gut permits translocation of microbial compounds from the intestine to circulation. Subsequently, microbial compounds such as LPS, ligate pattern recognition receptors on multiple cell types, including highly abundant BM myeloid cells. This causes the production of IL-1a/b, which imprints an HSC myeloid differentiation bias and generates more myeloid output. Myeloid cells are increasingly produced because of their exacerbated inflammatory responses, and they then further amplify the systemic response to microbial compounds. Over time, this self-sustaining inflammaging cycle induces a hematopoietic aging phenotype (Figure 7). Imprinted enhanced responsiveness to recurrent inflammatory stimuli in HSPCs and their progeny might provide a survival advantage and thus might have been selected for during evolution. Accordingly, HSC aging can be perceived as the result of the cumulative exposure of HSCs to inflammatory signaling. This starts at the fetal stages when these signals play an instructive role54,55 and continues to adult life when these signals are essential for the establishment of steady-state levels of myelopoiesis.22,56 However, such a mechanism comes at a cost, and thus, inflammaging is likely a passively developed byproduct of the selection of a fit immune system in younger reproductive-age mice rather than a selected feature in older post-reproductive populations.57 Because our observations are made in protected laboratory housing, we speculate that this effect might be even stronger in organisms fully exposed to the environment.

HSC inflammaging model. Aging is associated with increased microbial compounds in blood because of increased permeability of the intestinal barrier. Blood-derived microbial compounds stimulate pattern recognition receptors. Multiple BM cells stimulated via pattern recognition receptors release IL-1a and IL-1b. IL-1–induced signaling imprints myeloid bias on HSCs. Myeloid-biased HSCs accumulate with age and increase their myeloid cell output. Myeloid cells produce higher and more sustained IL-1a and IL-1b upon LPS stimulation, thus sustaining an HSC inflammaging process. Microbiota IL-1–dependent onset of a myeloid-differentiation bias in HSCs during physiological aging can be substantially reverted by treatment with antibiotics or IL-1 antagonists.
HSC inflammaging model. Aging is associated with increased microbial compounds in blood because of increased permeability of the intestinal barrier. Blood-derived microbial compounds stimulate pattern recognition receptors. Multiple BM cells stimulated via pattern recognition receptors release IL-1a and IL-1b. IL-1–induced signaling imprints myeloid bias on HSCs. Myeloid-biased HSCs accumulate with age and increase their myeloid cell output. Myeloid cells produce higher and more sustained IL-1a and IL-1b upon LPS stimulation, thus sustaining an HSC inflammaging process. Microbiota IL-1–dependent onset of a myeloid-differentiation bias in HSCs during physiological aging can be substantially reverted by treatment with antibiotics or IL-1 antagonists.
The relevance of our findings to human aging still needs to be determined. However, mechanisms and patterns of aging are largely shared in mammals.58 Interestingly, increased levels of pro-inflammatory cytokines, including IL-1,16 have been described in older human beings. Moreover, older human HSPCs exhibit phenotypes similar to those observed in mice,59-61 particularly increased pool size and decline in lineage reconstitution62,63 as well as increased myelo-megakaryocytic and decreased lymphoid gene expression.60,61 Assuming that there is a clinical value (not currently proven) in the rejuvenation of older HSCs, our data and model suggest several possible therapeutic paths for intervention. One path would be reduction of systemic microbial burden by restoring intestinal barrier function or by antibiotic treatment. Another path would be pharmaceutical inhibition of IL-1R1 signaling. In this proof-of-principle study, we demonstrated that both antibiotic and IL-1ra treatment of older WT SPF mice resulted in a striking reduction of HSC population myeloid output upon transplantation, reaching levels similar to those in young WT SPF mice, which indicated that a constant supply of IL-1a/b and/or microbial compounds is necessary for older HSCs to exhibit myeloid-biased repopulation. At the same time, however, neither of these treatments rescued the engraftment and repopulation capacity decline of older HSCs. This indicates that differentiation and self-renewal of older HSCs are influenced by non-overlapping mechanisms, which suggests that full rejuvenation of older HSCs might depend on a multi-layered approach. More studies are need to determine whether these interventions cause reprogramming of single, older, and myeloid-biased HSCs or whether they enable more effective lymphoid readout of balanced HSCs within a heterogeneous older HSC population.
Acknowledgments
The authors thank Veronika Lysenko, Kristin Fritsch, and Ramin Radpour for technical assistance with experiments and Martin Bachmann and Jan Sobzak for providing HEK-Blue TLR reporter cell lines.
This work was supported by research grants from the Swiss National Science Foundation (310030B_166673/1 [M.G.M.] and SNSF 310030_197562 [S.B.]), by the Instituto de Salud Carlos III (CNIO Bioinformatics Unit), and by a grant from Comunidad de Madrid (PEJD-2019-PRE/BMD-15732) (S.G.-M.).
Authorship
Contribution: L.V.K., H.T., and M.G.M. conceived the study; L.V.K., F.C., and M.G.M. curated the data; L.V.K., F.C., S.G.-M., P.H., and M.G.M formally analyzed the data; M.G.M. administered the project and acquired the funding; L.V.K., F.C., E.-M.M., and S.B. performed the investigation; L.V.K. and M.G.M determined the methodology; E.S. and M.G.M provided the resources; F.C., S.G.-M., P.H., and F.A.-S. provided the software; F.A.-S., E.S., C.N.-A., and M.G.M. supervised the study; L.V.K., F.C., and S.G.-M. visualized and validated the data; L.V.K., F.C., and M.G.M. wrote the original draft; and L.V.K., F.C., S.B., E.S., C.N.-A., and M.G.M. wrote, edited, and reviewed the manuscript.
Conflict-of-interest disclosure: The authors declare no competing financial interests.
Correspondence: Markus G. Manz, Department of Medical Oncology and Hematology, Comprehensive Cancer Center Zurich, University Hospital Zurich, University of Zurich, Raemistrasse 100, CH-8091 Zurich, Switzerland; email: markus.manz@usz.ch.
The accession number for the RNA sequencing data described in this publication is GEO ID: GSE163503.
The online version of this article contains a data supplement.
There is a Blood Commentary on this article in this issue.
The publication costs of this article were defrayed in part by page charge payment. Therefore, and solely to indicate this fact, this article is hereby marked “advertisement” in accordance with 18 USC section 1734.

This feature is available to Subscribers Only
Sign In or Create an Account Close Modal