

Key points
Relapse and clonal evolution with immunosuppression and EPAG were the same as with immunosuppression alone, but they occurred earlier.
High-risk evolution to myeloid malignancy was not increased with the addition of EPAG to immunosuppression.

Abstract
Patients with severe aplastic anemia (SAA) are either treated with bone marrow transplant (BMT) or immunosuppression (IST) depending on their age, comorbidities, and available donors. In 2017, our phase 2 trial reported improved hematologic responses with the addition of eltrombopag (EPAG) to standard IST for SAA when compared with a historical cohort treated with IST alone. However, the rates and characteristics of long-term complications, relapse, and clonal evolution, previously described in patients treated with IST alone, are not yet known with this new regimen, IST and EPAG. Patients were accrued from 2012 to 2020, with a total of 178 subjects included in this secondary endpoint analysis. With double the sample size and a much longer median follow-up (4 years) since the original publication in 2017, we report a cumulative relapse rate of 39% in responding patients who received cyclosporine (CSA) maintenance and clonal evolution of 15% in all treated patients at 4 years. Relapse occurred at distinct timepoints: after CSA dose reduction and EPAG discontinuation at 6 months, and after 2 years when CSA was discontinued. Most relapsed patients were retreated with therapeutic doses of CSA +/− EPAG, and two-thirds responded. Clonal evolution to a myeloid malignancy or chromosome 7 abnormality (high-risk) was noted in 5.7% of patients and conferred a poorer overall survival. Neither relapse nor high-risk evolution occurred at a higher rate than was observed in a historical comparator cohort, but the median time to both events was earlier in IST and EPAG treated patients. This trial was registered at www.clinicaltrials.gov as #NCT01623167.
Introduction
Immune aplastic anemia (AA) is caused by T-cell-mediated destruction of hematopoietic stem and progenitor cells (HSPC) and presents as severe pancytopenia and a hypocellular marrow.1 Bone marrow transplant (BMT) can be curative and is now more broadly available due to alternate donor options. However, for patients who are older, unfit, or lack a suitable donor, immunosuppressive treatment (IST) remains the standard of care. In 2017, we reported the primary endpoint results of a single-center phase 2 investigator-initiated trial in which newly diagnosed severe AA (SAA) patients were treated with a combination of IST, horse anti-thymocyte globulin (hATG), cyclosporine (CSA), and eltrombopag (EPAG). The majority of treated patients achieved an overall hematologic response rate (ORR) at 6 months, and most importantly, EPAG addition resulted in a more robust count recovery when compared with a historical cohort treated with IST alone.2 In that report, the median follow-up time was 2 years, which did not allow a complete assessment of long-term outcomes (relapse, clonal evolution, and survival).
Cumulative data from past trials in AA employing IST showed that about half of the patients have excellent long-term outcomes once a hematologic response is achieved. However, relapse or clonal evolution to a myeloid malignancy occurs in the other 50% of patients who had achieved an initial response to treatment.3 In our previous trials of IST, a relapse rate of 30% to 40% at 5 years had been consistently observed.3 The cumulative incidence of relapse could not be improved with additional IST,4,5 prolongation of CSA taper,6 addition of growth hormones,7-9 or with a more potent thymocyte globulin.10 Declining blood counts respond to reinitiation of IST in most cases, usually with CSA alone. While patients do still die as a result of refractory disease, relapse has not been associated with reduced overall survival.11
Secondary myeloid malignancy is another serious late complication and occurred in 10% to 15% of patients over a decade following initial IST.12 Cytogenetic abnormalities in chromosome 7, particularly aneuploidy, are the commonest karyotypes associated with transformation to a myeloid malignancy.1 Outcomes are generally poor in the absence of hematopoietic stem cell transplantation (HSCT) for these high-risk clonal evolvers.13 Other chromosomal aberrations, including deletion 13q, deletion 20q, trisomy 8, and trisomy 15, usually appear in isolation, without morphologic evidence of a myeloid malignancy.14 The clinical impact of these low-risk clonal evolutions is not entirely clear.
SAA, a historically fatal disease, now has a much-improved outcome due to recent advances in therapeutics and supportive care.2,15 However, all existing data on long-term outcomes are derived from patients who received only IST. With more patients being treated with IST and EPAG, the rates of late events such as relapse and clonal evolution to a myeloid malignancy and their outcomes are of interest, especially as high rates of clonal evolution (20%) were observed in patients treated with EPAG monotherapy for refractory SAA.16 In this report, we provide an update on long-term outcomes in patients treated with IST and EPAG on a prospective phase 2 trial, with the largest cohort and longest follow-up to date. Results were compared with a historical cohort treated with IST alone.
Methods
EPAG-IST group
In this prospective phase 2 study, we enrolled a total of 180 subjects whose SAA had not been definitively treated with ATG-based IST and who lacked a suitable matched sibling marrow donor or were not candidates for transplant due to patient choice, advanced age, or socioeconomic factors. Patients 2 years of age or older were enrolled from June 2012 to January 2020 and treated with hATG, CSA, and EPAG combination. All patients met clinical criteria for SAA (supplemental Table 1 available on the Blood Web site). Exclusion criteria were as previously reported.2 For subjects who met the criteria for very SAA (VSAA; absolute neutrophil count [ANC] ≤200 x 109/L), treatment was initiated based on morphologic confirmation while cytogenetic studies were pending. Two enrolled participants with VSAA were diagnosed with chromosome 7 abnormalities on pretreatment cytogenetics and were removed from the study to seek alternative therapy. A total of 178 subjects were included in the current long-term analysis (Figure 1).
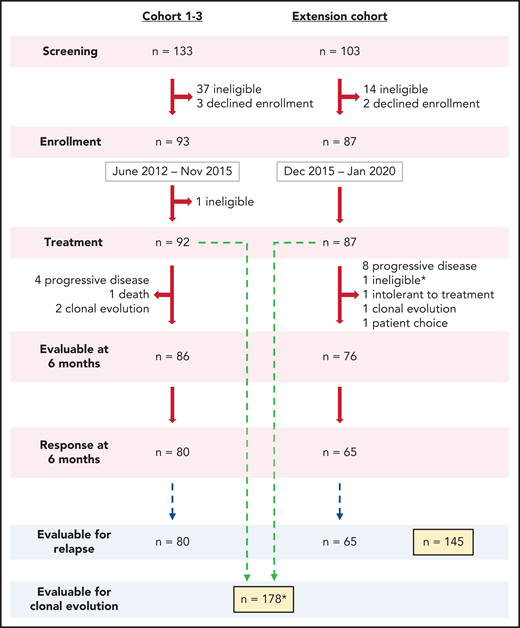
Enrollment flow diagram. A total of 236 patients were screened to enroll 180 in this phase 2 trial between 2012 and 2020. Most patients not enrolled in the study did not meet eligibility criteria or declined enrollment to pursue alternative therapy, primarily bone marrow transplantation. In Cohorts 1-3, one subject was found to have abnormal baseline cytogenetics, which precluded treatment on this protocol and therefore was taken off the study to pursue appropriate treatment. One patient enrolled on the extension cohort, who had ANC <200 x 109/L, was initiated on treatment prior to the results of pretreatment cytogenetics as allowed per protocol but was taken off the study to pursue appropriate treatment after chromosome 7 abnormalities were identified (marked by * in the diagram). Both patients were not included in the reported secondary analysis. A total of 178 patients were included for hematologic response at 6 months and clonal evolution analysis. A total of 145 patients who had achieved a response at 6 months were included for relapse analysis. Of note, the Clinical Center at NIH performs screening at multiple levels, making the application of a CONSORT analysis complicated.
Enrollment flow diagram. A total of 236 patients were screened to enroll 180 in this phase 2 trial between 2012 and 2020. Most patients not enrolled in the study did not meet eligibility criteria or declined enrollment to pursue alternative therapy, primarily bone marrow transplantation. In Cohorts 1-3, one subject was found to have abnormal baseline cytogenetics, which precluded treatment on this protocol and therefore was taken off the study to pursue appropriate treatment. One patient enrolled on the extension cohort, who had ANC <200 x 109/L, was initiated on treatment prior to the results of pretreatment cytogenetics as allowed per protocol but was taken off the study to pursue appropriate treatment after chromosome 7 abnormalities were identified (marked by * in the diagram). Both patients were not included in the reported secondary analysis. A total of 178 patients were included for hematologic response at 6 months and clonal evolution analysis. A total of 145 patients who had achieved a response at 6 months were included for relapse analysis. Of note, the Clinical Center at NIH performs screening at multiple levels, making the application of a CONSORT analysis complicated.
Treatment regimens differed among the 3 cohorts, as described previously.2 Cohort 1 received EPAG starting from day 15 to 6 months, cohort 2 from day 1 to 3 months, and cohort 3 from day 1 to 6 months. All cohorts received hATG from day 1 for 4 days and therapeutic dosing of CSA from day 1 for 6 months. Since our initial publication, 86 additional subjects were recruited on extension cohort. Because the best hematologic responses were achieved in cohort 3, these added subjects received the same regimen. Due to unexpectedly higher rates of relapse noted in the initial 44 subjects, the protocol was amended to administer CSA maintenance for 18 months after the initial 6 months of therapeutic CSA dosing (supplemental Figure 1).
The protocol was approved by the Institutional Review Board of the National Heart, Lung, and Blood Institute and monitored by an independent Data Safety and Monitoring Board. Informed consent was obtained in accordance with the Declaration of Helsinki. This trial was registered at www.clincialtrials.gov as #NCT01623267.
Historic IST group
A historic group comprised of SAA patients treated with only IST was used as a comparator. Patients on the control arms of 2 previous sequential SAA treatment protocols at the NIH treated with only hATG and CSA were included in this group (NCT00061360 and NCT00260689: the first, a randomized trial comparing hATG/CSA and hATG/CSA with sirolimus from 2003 to 2005; the second, a three-arm randomized trial of hATG/CSA, rabbit anti-thymocyte globulin (rATG)/CSA, and alemtuzumab from 2005 to 2010. A total of 102 subjects were included in the historic IST group (supplemental Figure 1).5,6,10
Treatment regimens
CSA and hATG administration were the same in the historic IST and EPAG-IST groups. The dose of hATG was 40 mg/kg over 4 days. CSA was dosed per weight and age to achieve and maintain serum levels of 200 to 400 ng/mL for the first 6 months. In the historic IST group, CSA taper occurred over 2 years or until relapse. Except for the first 44 patients in the EPAG-IST group, all received CSA maintenance at 2 mg/kg daily until 2 years or relapse. Subjects in EPAG-IST group received the approved SAA EPAG dose of 150 mg daily (dosing adjusted per label for age and ancestry). While cohorts 1 and 2 differed in the start day and duration of EPAG, as previously described,2 in cohort 3 and the extension cohort, all patients received EPAG for 6 months (supplemental Figure 1).
Endpoints
The primary efficacy endpoint, hematologic response at 6 months for the first 92 enrolled participants, was reported in our original publication in 2017.2 These subjects were included in this secondary endpoint analysis of long-term outcomes. Secondary endpoints of this study included: (1) rates of relapse in patients deemed responders at 6 months, (2) clonal evolution to a myeloid malignancy or new chromosomal abnormality, (3) overall survival (OS), (4) hematologic response of relapsed subjects that restarted treatment, and (5) effects of CSA maintenance from 6 to 24 months on the rates of relapse.
Relapse was defined as in our previous protocols: substantial or progressive decline in 1 or more blood counts, not explained by another clinical process, on at least 2 consecutive blood samples requiring reinitiation of treatment for aplastic anemia. Clonal evolution was categorized as low-risk or high-risk. High-risk evolution included meeting morphologic criteria for a myeloid malignancy or acquisition of a chromosome 7 aberration or complex cytogenetics even in absence of morphologic dysplasia or increased blasts. All other isolated chromosomal abnormalities absent morphologic evidence of myeloid neoplasm were classified based on the Revised International Prognostic Scoring System (R-IPSS) cytogenetic definitions; these patients were reassessed for blood count decline and for morphologic changes with more frequent bone marrow biopsies than mandated by protocol. Low-risk was defined as R-IPSS categories very good, good, and intermediate (excluding chromosome 7 aberrations, which we considered high-risk, consistent with our previous reporting).
All patients were assessed at 3, 6, and 12 months after treatment, then yearly thereafter. Bone marrow biopsy, aspirate, and cytogenetics were mandated at all landmark timepoint visits. Somatic mutation testing was performed in all patients using a Clinical Laboratory Improvement Amendments (CLIA)-certified next-generation sequencing panel before treatment, at 6 months, and at clonal evolution. For both the EPAG-IST and historic IST groups, data were censored from the date of last patient contact at data cutoff in September 2020.
Statistics
Summary statistics were used to describe patient characteristics, response, and laboratory parameters. The Fine-Gray competing risk regression model was used for time to relapse and clonal evolution (both high- and low-risk), with death and BMT as competing events. Cumulative incidence curves were generated to visualize the probability of relapse and clonal evolution. P values were computed using the pseudolikelihood ratio test.17 The Kaplan-Meier curves and the Cox Proportional Hazards (PH) model were used to compare the time-to-event distributions for OS among the EPAG-IST subgroups and with the historic IST group. P values for sub-group comparisons were computed using the student’s t-test for continuous variables and the Pearson’s χ-squared test for categorical variables. Differences in cumulative event curves were compared using the log-rank tests. Data were analyzed using R 4.0.3 and SAS 9.4.
Results
Baseline characteristics, including age, disease severity, and presence of a paroxysmal nocturnal hemoglobinuria (PNH) clone, were comparable between the EPAG-IST and historic IST groups. Including all EPAG-IST treated patients, the median time to follow-up was 4 years, which was shorter than the historic IST group (7 years). However, the first 2 cohorts in the EPAG-IST group (n = 61) had a longer median follow-up time of more than 5 years (Table 1).
Characteristics of aplastic anemia patients included in EPAG-IST group and historic IST group
| EPAG-IST group | Historic IST group (n = 102) | P* | ||||
|---|---|---|---|---|---|---|
| Cohort 1 (n = 30) | Cohort 2 (n = 31) | Cohort 3 + extension (n = 117) | All patients (n = 178) | |||
| Age distribution (y), n (%) | ||||||
| <18 | 5 (17) | 6 (19) | 33 (28) | 44 (25) | 23 (23) | .68 |
| 18-39 | 11 (37) | 13 (42) | 40 (34) | 64 (36) | 41 (40) | .49 |
| 40-60 | 8 (27) | 9 (29) | 22 (19) | 39 (22) | 22 (22) | .95 |
| >60 | 6 (20) | 3 (10) | 22 (19) | 31 (17) | 16 (16) | .71 |
| Disease severity, n (%) | ||||||
| VSAA | 13 (43) | 10 (32) | 53 (45) | 76 (43) | 35 (34) | .16 |
| SAA | 17 (57) | 21 (68) | 64 (55) | 102 (57) | 67 (66) | |
| Treatment, n (%) | ||||||
| 3 mo EPAG | — | 31 (100) | — | 31 (18) | — | |
| 6 mo EPAG | 30 (100) | — | 117 (100) | 147 (82) | — | |
| No CSA maintenance | 30 (100) | 14 (45) | — | 44 (25) | — | |
| CSA maintenance | — | 17 (55) | 117 (100) | 134 (75) | 102 (100) | <.001 |
| 6 mo response, n (%) | ||||||
| Overall response | 24 (80) | 27 (87) | 94 (80) | 145 (81) | 68 (67) | .008 |
| Complete response | 10 (33) | 8 (26) | 51 (44) | 69 (39) | 17 (17) | <.001 |
| Partial response | 14 (47) | 19 (61) | 43 (37) | 76 (43) | 51 (50) | .24 |
| No response | 3 (10) | 2 (6) | 11 (9) | 16 (9) | 30 (29) | <.001 |
| Off study | 3 (10) | 2 (6) | 12 (10) | 17 (10) | 4 (4) | .06 |
| Baseline GPI; deficient neutrophils, n (%) | ||||||
| <1% | 22 (73) | 19 (61) | 77 (66) | 118 (66) | 59 (58) | .17 |
| ≥1% | 8 (27) | 12 (39) | 40 (34) | 60 (34) | 43 (42) | |
| Baseline telomere length, n (%) | ||||||
| <10% | 8 (27) | 7 (23) | 13 (11) | 28 (16) | N/A | N/A |
| ≥10% | 22 (73) | 24 (77) | 100 (85) | 146 (82) | N/A | |
| Median time to follow up,† mo (range) | 73.5 (2.8-99.2) | 62.9 (5.6-74.1) | 36.5 (3.2-65.6) | 48.7 (2.8-99.2) | 87.8 (2.9–190.8) | <.001 |
EPAG-IST group is divided into Cohort 1, Cohort 2, and Cohort 3 + extension. All patients include combined characteristics of these 3 cohorts.
GPI, glycosylphosphatidylinositol.
P is calculated by comparison of all EPAG patients and historic IST cohort using t-test and
Wilcoxon rank-sum test.
Hematologic response
The overall response rate (ORR) at 6 months was assessed in all cohorts in the EPAG-IST group, including the initial 92 subjects in cohorts 1-3, whose responses were reported in 2017.2 The ORR was 81% at 6 months, significantly improved from 67% in the historic IST group (P = .008). A total of 117 patients (cohort 3 and extension cohort) were treated with the same duration and course of IST and EPAG. The complete response (CR) was 44%, and ORR was 80% in these patients (Table 1; supplemental Figure 2A). Of patients with a response at the 6-month time point, 64% in the EPAG-IST group, 69% in subgroup cohort 3 + extension, and 85% in the historic IST group continued to have stable blood counts at 12-month time point. In all 3 groups, about 50% remained in response without any events at last follow-up (supplemental Figure 2B).
Adverse events attributed to EPAG in all 178 patients treated with EPAG-IST were as previously reported, but the incidence of grade 3-4 alanine aminotransferase (ALT; 18%), aspartate aminotransferase (AST; 12%), total bilirubin (18%) elevation was higher than in our initial publication (supplemental Table 2). Grade 1 and 2 hyperbilirubinemia (indirect) was frequent from EPAG, for which no changes in dosage were made. The dose of EPAG was reduced for a cutaneous eruption in 1 subject, while in 3 cases, EPAG was discontinued for the same. Elevated liver function test improved with drug interruption in all subjects except 1 in whom EPAG was discontinued due to elevated bilirubin.
Relapse
Of the 178 enrolled subjects in the EPAG-IST group, 145 achieved an OR at 6 months, and of these, 61 relapsed. The cumulative incidence of relapse at 4 years (median follow-up time) was 43% (supplemental Figure 3). The original treatment duration for CSA was changed to include a maintenance CSA therapy (2 mg/kg daily) for 18 additional months after observing very high rates of relapse (56%) in the first 44 patients. There was a trend toward lower relapse rates with the addition of CSA maintenance in 109 responders at 6 months compared with the group (n = 36) who discontinued CSA at 6 months (39% vs 56% at 4 years, P = .07; Figure 2A). However, time to relapse was only prolonged by 66 days by CSA maintenance, much shorter than what we previously reported in patients treated with IST alone (prolonged by 1 year).6 Relapse occurred at 2 distinct time points: shortly after 6 months, when both the CSA dose was lowered and EPAG discontinued (denoted “early relapse”), and again after 2 years when CSA maintenance course was completed (“late relapse”). Two-thirds of the relapse occurred before 2 years; median time to relapse in all patients was 280 days (range 194 to 2703). All subjects in the historic IST group had received cyclosporine at full dose for 6 months and at reduced dose for next 18 months; there was no difference in relapse rates at 4 years when this group was compared with 109 responders in the EPAG-IST group who also underwent CSA maintenance for 18 months (33% vs 39%, P value 0.09; Figure 2B). However, the median time to relapse was shorter in the EPAG-IST group (324 days) compared with the historic IST group (774 days).
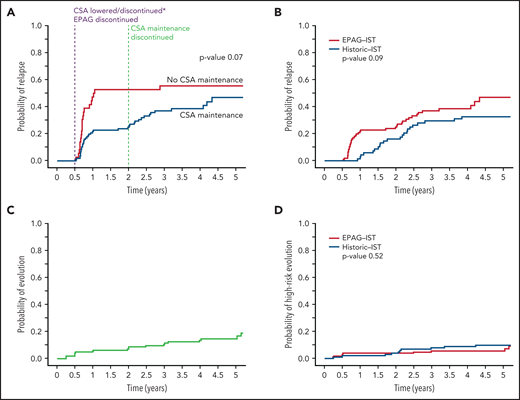
Relapse and clonal evolution in the EPAG-IST and historic IST groups. (A) Competing risk curves (death and BMT used as competing risks) depicting the time to relapse in subjects with a response at 6 months; blue line represents patients who received CSA maintenance (n = 109) and red line shows patients who did not receive CSA maintenance (n = 36). The purple dashed line indicates 6-month landmark timepoint when CSA was discontinued in the first 44 subjects and lowered in the rest and EPAG discontinued in all. The green dashed line indicates 2-year landmark timepoint when maintenance dose CSA was discontinued. Relapses were observed to occur shortly after these 2 distinct time points. (B) In the EPAG-IST group, 134 subjects were treated with 6 months of therapeutic CSA followed by 18 months of low-dose maintenance. Of these, 109 achieved a response at 6 months, and these were compared with a historic IST group who received a similar IST regimen with 24 months of CSA total. These competing risk curves (death and BMT used as competing risks) show no difference in the rates of relapse between subjects treated with IST plus EPAG versus historic IST alone (p = 0.09). (C) The cumulative incidence of clonal evolution was noted in 14.8% of all treated patients in EPAG-IST group. (D) No difference in high-risk evolution was observed in EPAG-IST and historic IST group as shown with completing risk analysis using Fine-Gray (death and BMT used as competing risks).
Relapse and clonal evolution in the EPAG-IST and historic IST groups. (A) Competing risk curves (death and BMT used as competing risks) depicting the time to relapse in subjects with a response at 6 months; blue line represents patients who received CSA maintenance (n = 109) and red line shows patients who did not receive CSA maintenance (n = 36). The purple dashed line indicates 6-month landmark timepoint when CSA was discontinued in the first 44 subjects and lowered in the rest and EPAG discontinued in all. The green dashed line indicates 2-year landmark timepoint when maintenance dose CSA was discontinued. Relapses were observed to occur shortly after these 2 distinct time points. (B) In the EPAG-IST group, 134 subjects were treated with 6 months of therapeutic CSA followed by 18 months of low-dose maintenance. Of these, 109 achieved a response at 6 months, and these were compared with a historic IST group who received a similar IST regimen with 24 months of CSA total. These competing risk curves (death and BMT used as competing risks) show no difference in the rates of relapse between subjects treated with IST plus EPAG versus historic IST alone (p = 0.09). (C) The cumulative incidence of clonal evolution was noted in 14.8% of all treated patients in EPAG-IST group. (D) No difference in high-risk evolution was observed in EPAG-IST and historic IST group as shown with completing risk analysis using Fine-Gray (death and BMT used as competing risks).
Thrombocytopenia was the most prominent feature of relapse, followed by neutropenia. At relapse, the median platelet count was 34 K/µL (range 3-116), hemoglobin 10.5 g/dL (range 6.1-15.3), and ANC 1.31 K/µL (range 0-4.8; supplemental Figure 4A). Because of the expected decrease in platelet counts with EPAG withdrawal and broad definition of relapse, we further examined 22 patients who had an early relapse (within 2 years of treatment) based on decline in platelet counts only. Eleven of these patients had received CSA maintenance while the other 11 did not. The median decline in platelet counts in patients without a relapse (calculated as counts at 1-year time point compared with counts at 6-month time point) was not statistically significant, but the decline was highly statistically significant for the 22 patients with relapse based on thrombocytopenia alone (calculated as counts at relapse -6 months, P < 1.0 x10⁻⁶; supplemental Figure 4B). Of these 22 patients, 10/10 achieved a response with reinitiation of CSA alone and 8/12 with CSA + EPAG. Of the 4 patients who had not achieved a response with reinitiation of oral therapy, 3 received alemtuzumab, all of whom responded, and the fourth patient pursued BMT. Additionally, the rate of relapse was not significantly higher in 27 responders in cohort 2 who received EPAG for 3 months when compared with the remaining patients who were treated for 6 months (P = .7; supplemental Figure 5A), and the relapse incidence for patients in cohort 3 and the extension arm only (n = 117) was the same as for the whole EPAG-IST group (n = 145), 37.5% (supplemental Figure 5B).
Older patients had a significantly higher risk of relapse (supplemental Table 3), but no other variables at baseline or 6 months were predictive of this event (telomere length, PNH clones, somatic mutations, and blood counts). Median ANC and platelet counts achieved at 6 months were lower in subjects who suffered “early relapse” compared with those who experienced “late relapse,” but at the time of relapse, there was no significant difference in blood counts between these 2 groups (supplemental Table 4).
Of the 61 relapsed patients, 27 were retreated with CSA alone, 31 received a combination of CSA and EPAG, 2 underwent HSCT, and 1 received alemtuzumab off study. Forty-three subjects (74%) achieved a hematologic response again with oral therapy. In 57 evaluable patients, blood counts recovered in 93% of patients (25/27) treated with CSA alone and in 60% of patients (18/30) treated with CSA and EPAG (Figure 3A). At last contact, 65% of the patients continued with a response either off drug or on a low dose/tapering schedule (Figure 3B; supplemental Table 5A-B).
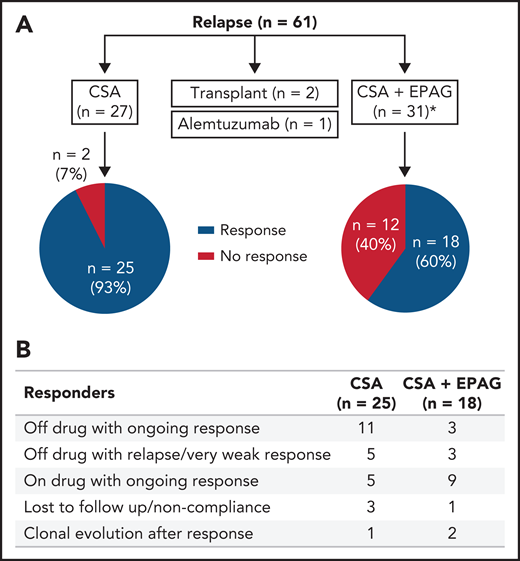
Treatment and responses in patients with relapse in the EPAG-IST group. (A) Approximately half of the relapsed patients were treated with CSA alone, and the other half were treated with CSA and EPAG combination. Responses in these 2 groups are shown in the pie diagram. *One patient in the CSA plus EPAG treated group was non-compliant, and therefore not assessable and not included in the pie diagram. (B) Of the 43 subjects who achieved a response with reinitiation of oral therapy, about 1/3 were able to discontinue drug with ongoing response while another 1/3 remained on drug (many on low dose or being tapered) with ongoing response.
Treatment and responses in patients with relapse in the EPAG-IST group. (A) Approximately half of the relapsed patients were treated with CSA alone, and the other half were treated with CSA and EPAG combination. Responses in these 2 groups are shown in the pie diagram. *One patient in the CSA plus EPAG treated group was non-compliant, and therefore not assessable and not included in the pie diagram. (B) Of the 43 subjects who achieved a response with reinitiation of oral therapy, about 1/3 were able to discontinue drug with ongoing response while another 1/3 remained on drug (many on low dose or being tapered) with ongoing response.
Clonal evolution
In the EPAG-IST group, clonal evolution was assessed in 178 patients; the cumulative incidence was 15% at 4 years, similar to the historic IST group (Figure 2C; supplemental Figure 6). Older patients (>40 years) had a significantly higher risk of clonal evolution compared with younger patients, while ANC <1.76 at 6 months was associated with a lower rate of clonal evolution (P value .03; supplemental Table 6). High-risk evolution was observed in 5.7% of the EPAG-IST group and 10.3% of the historic IST group at 4 years (P = .5; Figure 2D). Among subjects with clonal evolution, the median time to this event was much earlier in the EPAG-IST group in comparison with the historic IST group (186 days [range 88-1881] vs 777 days [range 92-2528]).
Among the 11 subjects with high-risk evolution in the EPAG-IST group, 9 had chromosomal 7 cytogenetic aberrations including monosomy (n = 6), partial deletion (n = 2), and inversion (n = 1). Most had associated morphologic changes in the marrow consistent with myelodysplastic syndrome (MDS) (Table 2). At evolution, 6 subjects were found with somatic genetic variants in ASXL1 (n = 2), RUNX1 (n = 3), DNMT3A (n = 2), U2AF1 (n = 1), and SETBP1 (n = 1). In 3 of them, these variants were also present at baseline at a lower frequency (supplemental Figure 7). Seven subjects underwent HSCT, and 4 received supportive care. Three of the 11 patients died (27%): 2 from transplant complications and 1 from progressive disease. In the historic IST group, 3 patients developed acute myeloid leukemia (AML), and the others had MDS; the commonest cytogenetic abnormality again was monosomy 7. The mortality was 58% in the patients who had high-risk clonal evolution in the historic IST group (Table 2).
Disease characteristics, treatment, and outcomes for patients with high-risk clonal evolution in both groups
| UPN | Age | Days to clonal evolution | Cytogenetics | WHO diagnosis | Treatment | Outcome |
|---|---|---|---|---|---|---|
| EPAG-IST Group | ||||||
| E4 | 41 | 1841 | Normal | MDS/MPN | Pursuing BMT* | Alive |
| E9 | 54 | 91 | t(3;3)(q21;q26),-7[3/17] | MDS-EB1 | BMT | Dead |
| E18 | 69 | 908 | −7[20/20] | MDS-MLD | Supportive | Dead |
| E35 | 59 | 1881 | -Y[7/10] | MDS-EB1 | BMT | Alive |
| E40 | 48 | 187 | del(7) (p13p15)[3/22] | Cyto only† | BMT | Alive |
| E65 | 60 | 182 | −7[7/23] | MDS-MLD | Supportive | Alive |
| E78 | 16 | 8 | −7 [6/20] | Cyto only† | BMT | Alive |
| E124 | 73 | 1091 | −7[3/20] | MDS-SLD | Supportive | Alive |
| E128 | 57 | 181 | del(7)(p13)[3/17] | Cyto only† | BMT | Alive |
| E147 | 26 | 186 | inv(7)(q21q31)[5/15] | Cyto only† | BMT | Alive |
| E174 | 8 | 105 | −7[12/20] | MDS-SLD | BMT | Dead |
| Historic IST Group | ||||||
| H4 | 67 | 1089 | −7[5/5] | MDS-EB1 | Supportive | Dead |
| H13 | 65 | 1224 | −7[6]/idem,t(3;21)(q26;q22)[14] | MDS-MLD | Azacytidine | Dead |
| H17 | 36 | 2338 | Normal | AML | BMT | Alive |
| H19 | 19 | 2528 | Normal | AML | BMT | Alive |
| H21 | 80 | 866 | del13q[14/20]/-7[5/20] | MDS-MLD | NA‡ | Dead |
| H29 | 75 | 685 | Complex | Cyto only† | NA‡ | Dead |
| H45 | 23 | 730 | t(12;13)(p12;q13)[4/16]/ idem,-7[7/16] | MDS-EB1 | Azacytidine | Dead |
| H46 | 44 | 1545 | −7[20/20] | MDS-MLD | BMT | Alive |
| H66 | 52 | 769 | −7[6/23] | MDS-MLD | NA‡ | Alive |
| H74 | 60 | 784 | −7[4/20] | MDS-EB1 | Supportive | Dead |
| H76 | 57 | 92 | Normal | AML | BMT | Dead |
| H87 | 27 | 756 | −7[9/20] | MDS-MLD | NA‡ | Alive |
UPN-H21 and UPN-H46 had low-risk clonal evolution with acquisition of deletion 13q prior to monosomy 7. UPN H45 had low-risk evolution with acquisition of t(12;13) and then progressed to monosomy 7.
Cyto only, met criteria for MDS based on MDS defining cytogenetic (monosomy 7); EB1, excess blast-1; MLD, multi-lineage dysplasia; MPN, myeloproliferative neoplasm; SLD, single lineage dysplasia; UPN, unique patient number; WHO, World Health Organization.
UPN-E4 was initially managed expectantly because of mild cytopenia, but 2 years after the initial MDS/MPN diagnosis, patient had worsening cytopenia and received treatment with azacytidine + venetoclax as a bridge to transplant.
Cyto only indicates MDS-U diagnosis based on qualifying cytogenetics without dysplasia or increased blast percentage.
Subjects did not have BMT after clonal evolution, but it is not known whether they had medical treatment.
Low-risk clonal evolution was diagnosed in 9.1% (n = 14) of patients at median time to follow-up of 4 years in all treated subjects in the EPAG-IST group on routine protocol-mandated bone marrow and cytogenetic evaluations. Of the 14 subjects, all cytogenetic abnormalities were classified as intermediate in R-IPSS except for 2, which were categorized as good (supplemental Table 7). Median time to clonal evolution in these 14 subjects was 545 days (range 91-1470), which was much longer than time to high-risk evolution. No patients had a significant decline in blood counts at the time of low-risk evolution, nor did marrow biopsies or aspirates show increased blasts or dysplasia. The principal abnormality observed was deletion 13q (n = 6) followed by trisomy 8 (n = 3) and deletion 5q (n = 2); two-thirds were transient and were not detected in later marrow examinations. Three of 14 patients had at least 1 somatic mutation identified at the time of clonal evolution; none had the same mutation at baseline (supplemental Table 7). Somatic variants were different from those observed in patients with high-risk evolution and included DNMT3A (variant allele fraction [VAF] 3.2%), TET2 (VAF 0.98%), CTNNB1 (VAF 1.43%), and BCOR (VAF 11.1% and 5.18%). At last follow-up, all patients were alive, and none had progressed to MDS/AML or required treatment of evolution. Six low-risk evolutions were observed in the historic IST group with similar characteristics as in the EPAG-IST group for karyotype and marrow findings, but 4/6 underwent HSCT, and all were alive at last follow-up.
Survival
OS at 4 years in the EPAG-IST and historic IST groups were 92.5% and 85%, respectively (P = .41; Figure 4A). In the EPAG-IST group, there were 16 deaths, but only 1 occurred while on study. The majority of deaths were due to infections with concurrent neutropenia. Six patients died after undergoing HSCT for either relapsed/refractory AA or clonal evolution, and 3 died of causes other than AA (supplemental Figure 8). Patients who relapsed had similar OS compared with those without relapse (Figure 4B). As expected, not having a response to treatment conferred a poorer prognosis, but to our surprise, survival was not different between patients with CR and partial response (PR) (Figure 4C). High-risk evolution conferred a poorer survival, while low-risk evolution did not impact the outcome when compared with patients without clonal evolution (Figure 4D).
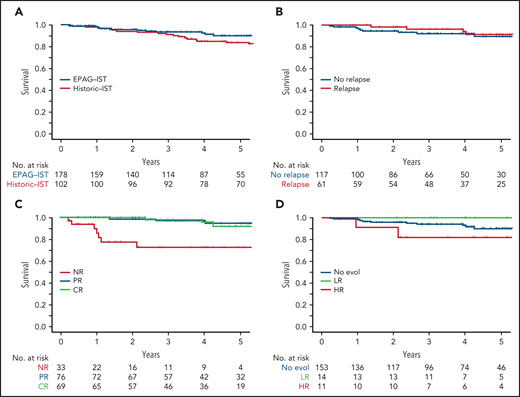
The impact of initial response and late events on survival in EPAG-IST group. (A) All-cause mortality was included. There was no statistical difference in overall survival in EPAG-IST and historic IST group. (B) Patients with relapse did not have a worse outcome when compared with the ones without a relapse (this group includes patients with clonal evolution). (C) High-risk clonal evolution resulted in lower survival when compared with patients with no evolution or low-risk evolution. (D) Patients who did not achieve the initial hematologic response (non-responders) had poorer overall survival when compared with the ones with the response; however, achieving a complete response did not further improve the survival when compared with the patients with incomplete recovery.
The impact of initial response and late events on survival in EPAG-IST group. (A) All-cause mortality was included. There was no statistical difference in overall survival in EPAG-IST and historic IST group. (B) Patients with relapse did not have a worse outcome when compared with the ones without a relapse (this group includes patients with clonal evolution). (C) High-risk clonal evolution resulted in lower survival when compared with patients with no evolution or low-risk evolution. (D) Patients who did not achieve the initial hematologic response (non-responders) had poorer overall survival when compared with the ones with the response; however, achieving a complete response did not further improve the survival when compared with the patients with incomplete recovery.
Discussion
With the addition of an extension cohort to patients originally reported in 2017, a total of 178 SAA patients were treated with IST and EPAG on this investigator-initiated phase 2 trial; likely the largest number of patients with the longest median follow-up (4 years) to have received this now FDA approved front-line therapy. The ORR and CR remained significantly higher in EPAG-IST group compared with the historic IST treated group. Since CR was defined by robust counts in all 3 lineages (Hb ≥ 10 g/dL, ANC ≥1000 x 109/L/μL, and platelets ≥100 x 109/L), the observed increase in CR in EPAG-IST group was likely the effect of thrombopoietin agonist (TPO) on HSPCs. Indeed, it has been shown that EPAG specifically expands marrow multipotent progenitor cells in patients with a response.18 Expansion of short-term HSPC by EPAG also may explain the decline in blood counts from CR to PR range in some patients after EPAG withdrawal at 6 months and earlier relapses than observed in the historic IST cohort. At last follow-up, in most patients who had durable responses, blood counts remained in the CR range (51/67).
High-risk clonal evolution was observed in 5.7% of all treated patients in the EPAG-IST group, not appreciably higher when compared with the historic IST group. In contrast to results of EPAG treatment in refractory SAA, our findings confirmed the safety of EPAG in a treatment-naïve SAA patient population.16 However, we observed earlier clonal evolution, especially high-risk, in patients treated with IST and EPAG: 7/11 subjects developed evolution by 6 months. Earlier appearance of this complication should allow faster implementation of BMT in patients who clearly require this intervention. The pattern of high-risk clonal evolution also emphasizes the importance of earlier, more frequent marrow evaluations with this treatment regimen. Conversely, high-risk clonal evolution was infrequent after 3 years; a similar observation of earlier clonal evolution events were made in refractory patients treated with EPAG.16 Late myeloid neoplasia in SAA typically does not have chromosome 7 abnormalities and hence may have a distinct pathophysiology.19
In contrast, low-risk evolutions were detected in more patients in the EPAG-IST group than the historic IST group but without statistical significance. With long follow-up, low-risk evolution was often transient and, when persistent, did not affect blood count stability. Our experience here and in previous studies suggest that isolated acquisition of non-chromosome 7 structural or numerical abnormalities should not lead to treatment changes, but close serial follow-up is indicated.14 On our protocol, when low-risk clonal evolution occurred during the administration of EPAG, the study drug was promptly discontinued. However, the necessity of this approach in low-risk evolution is unknown, especially as TPO mimetics are effective in lower-risk MDS.20-22 But the decision should be individualized based on blood counts, marrow morphology, and the specific cytogenetic abnormality, as long-term studies of EPAG use in lower-risk MDS are not available, and EPAG is not approved by the FDA for use in this disease. Furthermore, there are unresolved long-term safety concerns of TPO agonists use in higher-risk MDS.23
Relapse remains a major complication in SAA subjects treated with IST and EPAG, with a cumulative rate of 39%. Relapses occurred at 2 distinct time points, and most relapses occurred within 2 years of initial ATG administration. Reactivation of autoreactive lymphocytes remains the likely explanation for relapse because the rate was not increased in the EPAG treated group. Time to relapse may have been affected by the withdrawal of both CSA and EPAG at 6 months. Relapses occurred after a decrease of CSA at 6 months and its discontinuation at 2 years, and hematologic response was achieved again with reinstitution of CSA, with/without EPAG. Withdrawal of EPAG at 6 months appeared to result in earlier relapses; median time was <1 year in the EPAG-IST group and approximately 2 years in the historic IST group. Since decreased platelet counts may occur due to EPAG withdrawal, it is possible that some relapses were “non-immunologic” in pathophysiology. Time to relapse should inform future strategies for its prevention, particularly the introduction of potentially tolerogenic drugs like sirolimus (ClinicalTrials.gov: NCT02979873). Other than older age, we did not identify any biomarkers that were predictive of relapse. Thirty-one subjects received EPAG beyond 6 months for relapse; no unexpected toxicities were observed with longer use alone or with CSA.
OS remained excellent in the EPAG-IST group despite the long-term complications. As expected, non-responder status was a poor prognostic marker, but to our surprise, and in contrast to the earlier observations in IST-treated patients,11 more robust count recovery did not translate to better survival. Rates of relapse and clonal evolution in subjects with PR and CR were similar. Relapse did not impact survival, supporting the efficacy of subsequent therapies, including reinitiation of oral therapy with CSA and EPAG, a second round of immunosuppression, and transplantation. Unfortunately, high-risk clonal evolution continues to confer a poor prognosis even with transplantation (Table 2) and remains the most serious long-term complication in SAA. Identifying early predictors of evolution should alleviate adverse clinical outcomes and inform our understanding of the pathophysiology of AA. Dysregulated hematopoiesis, skewed toward myeloid differentiation, may explain the increased risk associated with higher ANC posttreatment and with older age. Potentially, mutated cells with a predilection for enhanced proliferation and less apoptosis likely are favored in the marrow failure environment of increased regenerative stress and specific cytokine and growth factor production.24
One major limitation of this study was the use of a previously treated historical comparator group rather than a randomized two-arm trial, which might bias our analysis. Long-term results from the phase 3 randomized trial, RACE (ClinicalTrials.gov: NCT02099747), comparing IST and IST + EPAG, will provide more definitive data relating to the incidence and course of these 2 complications. With no increase in the rates of clonal evolution, the combination of IST and EPAG should be used as first-line treatment in adult SAA patients who do not have safe transplant options. The durability of response remains inadequate in many treated patients, demanding a focus on optimizing therapies with longer-term benefits.
Acknowledgments
The authors extend their appreciation to the patients and families for their participation in these studies.
Resources and support for this trial were provided by the Intramural Research Program of the NHLBI. The study was funded by GlaxoSmithKline and Novartis, the manufacturers of EPAG, which supplied the study drug.
Authorship
B.A.P. provided clinical care, performed research, analyzed results, and wrote the paper; E.M.G. provided clinical care, performed research, and edited the paper; F.G.-R. created figures and edited the paper; O.R. and J.L. provided clinical care and assisted in data gathering; D.R.Q. assisted in data acquisition; R.S. and C.O.W. analyzed results and created figures; and N.S.Y. designed the study, performed research, provided clinical care, analyzed results, and edited the paper.
Conflict-of-interest disclosure: N.S.Y. has a cooperative research and development agreement (CRADA) with Novartis that provides research funding. The remaining authors declare no competing financial interests.
Correspondence: Bhavisha A. Patel, Building 10-CRC, Room 3E-5232, 10 Center Drive, Bethesda, MD 20892, e-mail: bhavisha.patel@nih.gov.
Deidentified data will be shared with other researchers upon reasonable request to the corresponding author (bhavisha.patel@nih.gov). The sharing will require a detailed proposal to the study investigators, and a data transfer agreement must be signed.
The online version of this article contains a data supplement.
There is a Blood Commentary on this article in this issue.
The publication costs of this article were defrayed in part by page charge payment. Therefore, and solely to indicate this fact, this article is hereby marked “advertisement” in accordance with 18 USC section 1734.

This feature is available to Subscribers Only
Sign In or Create an Account Close Modal