

Key Points
We report the MRD profile for 290 patients receiving rituximab plus continuous ibrutinib and associate it with progression-free survival.
Even though the rate of undetectable MRD is low, patients have prolonged progression-free survival while receiving ibrutinib.

Abstract
E1912 was a randomized phase 3 trial comparing indefinite ibrutinib plus 6 cycles of rituximab (IR) to 6 cycles of fludarabine, cyclophosphamide, and rituximab (FCR) in untreated younger patients with CLL. We describe measurable residual disease (MRD) levels in E1912 over time and correlate them with clinical outcome. Undetectable MRD rates (<1 CLL cell per 104 leukocytes) were 29.1%, 30.3%, 23.4%, and 8.6% at 3, 12, 24, and 36 months for FCR, and significantly lower at 7.9%, 4.2%, and 3.7% at 12, 24, and 36 months for IR, respectively. Undetectable MRD at 3, 12, 24, and 36 months was associated with longer progression-free survival (PFS) in the FCR arm, with hazard ratios (MRD detectable/MRD undetectable) of 4.29 (95% confidence interval [CI], 1.89-9.71), 3.91 (95% CI, 1.39-11.03), 14.12 (95% CI, 1.78-111.73), and not estimable (no events among those with undetectable MRD), respectively. In the IR arm, patients with detectable MRD did not have significantly worse PFS compared with those in whom MRD was undetectable; however, PFS was longer in those with MRD levels <10−1 than in those with MRD levels above this threshold. Our observations provide additional support for the use of MRD as a surrogate end point for PFS in patients receiving FCR. In patients on indefinite ibrutinib-based therapy, PFS did not differ significantly by undetectable MRD status, whereas those with MRD <10−1 tended to have longer PFS, although continuation of ibrutinib would very likely be necessary to maintain treatment efficacy.
Introduction
Measurable residual disease (MRD) status has been recognized as an important clinical end point for chronic lymphocytic leukemia (CLL)1 and remains relevant in the era of targeted therapies.2 An increasing numbers of clinical trials are now testing novel agent combinations in both untreated and relapsed/refractory CLL, along with MRD rates in treated patients.3-10 More specifically, undetectable MRD status has been shown to have prognostic value and to have the potential to act as a surrogate end point for progression-free survival (PFS) and overall survival (OS) in clinical trials of chemoimmunotherapy (CIT) agents.11-13 However, limited data on MRD have been reported for ibrutinib-based therapies,14,15 especially in phase 3 trials with continuous therapy where many patients may not achieve deep remissions with undetectable MRD status.
In a comprehensive review,16 trials with ibrutinib-containing therapies and MRD data had relatively small sample sizes. More recently, low undetectable MRD rates of 1% and 4% in the bone marrow after 9 cycles were reported for the ibrutinib-containing arms in a phase 3 trial of ibrutinib or ibrutinib plus rituximab (IR) vs bendamustine plus rituximab (BR) in untreated older patients with CLL.17 However, a detailed and sequential MRD analysis was not presented with the primary trial results. Similarly, in an initial report, we found undetectable MRD rates of ∼8% in the peripheral blood of patients with CLL after 12 cycles in the IR arm of a phase 3 trial comparing IR to fludarabine, cyclophosphamide, and rituximab (FCR) in untreated younger patients with CLL,18 but, in that report we did not provide detailed sequential MRD analysis of responding patients. In the iLLUMINATE trial,15 MRD was measured sequentially in the peripheral blood and in the bone marrow. An overall undetectable MRD rate of 35% was reported in the ibrutinib plus obinutuzumab arm, although results were not detailed by time point.
In this report, we describe an updated and more detailed MRD analysis from the recently reported phase 3 study E1912 which compared indefinite ibrutinib after 6 cycles of ibrutinib and rituximab to 6 cycles of FCR. Patients randomly assigned to receive IR were found to have significantly longer PFS and OS compared with those assigned to receive FCR.18 MRD assessments were planned for 12, 24, and 36 months after randomization for both arms, and additionally at 3 months for patients assigned to receive FCR.
Methods
Clinical trial
The E1912 trial18 (registered on clinicaltrials.gov as NCT02048813) was led by the Eastern Cooperative Oncology Group-American College of Radiology Imaging Network (ECOG-ACRIN) Cancer Research Group in collaboration with the other National Clinical Trials Network (NCTN) cooperative groups and accrued 529 patients from March 2014 through June 2016. A total of 354 patients were randomly assigned to receive IR and 175 patients to receive FCR. Fluorescence in situ hybridization was performed locally to identify individuals with deletion 17p13, who were not eligible for participation because of the poor outcome when they were treated with FCR therapy.19 Baseline IGHV mutation status was centrally determined successfully in 395 patients who provided samples for research purposes. Prognostic factors, such as percentages of CD19+CD5+ and ZAP70+ cells, were centrally assayed in 447 patients. Informed consent was obtained, in accordance with the Declaration of Helsinki.
Assessment of MRD and time points
MRD was measured in peripheral blood with 8-color flow cytometry, with a sensitivity of 1 CLL cell per 104 leukocytes.20 MRD was not assessed in the bone marrow. The flow cytometric experiments were performed in a clinical laboratory and met all required quality standards as per Clinical Laboratory Improvement Amendments (CLIA), College of American Pathologists (CAP), and New York State regulatory requirements. Samples with 20 or fewer monotypic events or an MRD level of <10−4 were considered to have undetectable MRD.21,22 Undetectable MRD was not confirmed in a second consecutive sample. For samples with detectable MRD, the level of residual disease was estimated by dividing the number of monotypic events by the total number of leukocytes, and patients were categorized as MRD <10−3 (0.1%), <10−2 (1%), <10−1 (10%), or ≥10−1 when analyzed as a categorical variable. Samples with undetectable MRD were assigned an MRD level of 0 when analyzed as a continuous variable. The planned MRD time points were 12, 24, and 36 months after randomization for both the IR and FCR arms, with the addition of a time point at 3 months for patients randomly assigned to the FCR arm. The 3-month time point included measurements between 2 and 4 months after randomization, whereas the 3 later time points at 12, 24, and 36 months allowed for a window of ±2 months around the original target time point. MRD was assessed regardless of clinical response in each arm.
Clinical end points
PFS was defined as in Shanafelt et al,18 which is time from randomization to documented CLL progression or death without documented progression. Patients alive without documented progression were censored at last disease assessment. Response evaluations were according to the 2008 International Workshop on CLL Working Group criteria,23,24 and the 12-month response determination included the central review of bone marrow biopsies, if available, and CT scans. Cutoff for the data analyzed for this study was 17 July 2019. Median follow-up was 45 and 43 months for the IR and the FCR arms, respectively. The 3-year PFS was 89% in the IR arm and 71% in the FCR arm. The 3-year OS was 99% in the IR arm and 93% in the FCR arm. Because of the low number of deaths (n = 23), we had limited ability to study the relationship between MRD and OS.
Statistical methods
Rates of undetectable MRD were calculated for all patients; patients without MRD data were considered to have detectable MRD. Median and mean MRD levels were estimated from patients with MRD data. Fisher’s exact test was used to compare categorical variables between groups. Wilcoxon test was used to compare continuous variables between groups. A multivariable logistic regression model for achieving undetectable MRD was developed by first checking for univariable association with each baseline characteristic separately. Variables with P < .1 were then included in the multivariable model and subjected to model selection by minimizing the Akaike information criteria.25 PFS distributions were estimated by using the Kaplan-Meier method and compared between groups by log-rank test. Hazard ratios (HRs) were estimated with the Cox proportional hazards model. When modeled as a continuous variable on the log scale, patients with undetectable MRD were assigned an MRD level of 10−5. The landmark method26 was used for the analysis of PFS by MRD time points, where patients with MRD data at the time point of interest who did not have a PFS event before that were included in the analysis. Multivariable Cox proportional hazards models were used to allow for time-varying covariates. In those models, MRD levels were assumed to be 10−1 or higher before the first MRD measurement. P values were 2-sided and were not corrected for multiple testing.
Results
Patient population studied for MRD levels and demographics
Samples for MRD analysis were collected from 413 patients among the 529 enrolled in E1912. Five specimens in this study were determined not to be interpretable because no viable lymphoid cells were present at the time of analysis. MRD was successfully measured for at least 1 time point in 412 patients, 290 from 354 patients randomly assigned to IR, and 122 from 175 patients assigned to FCR. For the IR patients, MRD measurements were obtained from 269, 227, and 143 patients at 12, 24, and 36 months after randomization, respectively. For the FCR patients, MRD measurements were obtained from 96, 81, 76, and 38 patients at 3, 12, 24, and 36 months after randomization, respectively. Supplemental Table 1 (available on the Blood Web site) details the number of patients included in different analyses.
The baseline characteristics of patients with and without MRD data were largely similar for both arms but did exhibit some notable demographic differences. For the IR arm (supplemental Table 2A), patients with MRD data were slightly younger (median of 57 years vs 61 years), less likely to have Rai stage III or IV disease (41.6% vs 55.6%), to have an ECOG performance status (PS) of 0 (62.2% vs 71.4%), or to have a positive Coombs test (6.0% vs13.8%). They were less likely to have palpable splenomegaly (37.8% vs 49.2%), higher platelet counts (median 152 × 103/μL vs 130 × 103/μL), and a different distribution in Döhner classification, represented by higher proportions of deletion 11q22 (23.4% vs 15.9%) and trisomy 12 (21.3% vs 12.7%).
In the FCR arm (supplemental Table 2B), patients with MRD data more often had IGHV mutations (41.3%) compared with those without MRD data (9.1%, 1 of 11 with IGHV data), and were less likely to have Rai stage III or IV disease (38.5% vs 47.2%) or ECOG PS of 0 (57.4% vs 73.6%).
MRD levels over time and in relation to response levels
Among all patients, a significantly higher proportion of patients randomly assigned to receive FCR had undetectable MRD, with rates of 29.1%, 30.3%, 23.4%, and 8.6% at 3, 12, 24, and 36 months, compared with those receiving IR with 7.9%, 4.2%, and 3.7% undetectable MRD rates at 12, 24, and 36 months (P < .001; Figure 1).
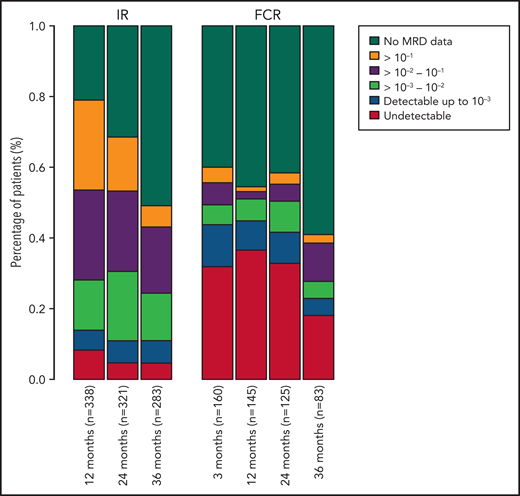
Percentage of patients in each MRD category over time. Also includes patients who have not progressed and are still in follow-up but do not have MRD data at each time point. MRD data after progression are not included. MRD levels are categorized into undetectable and detectable up to 10−3, 10−3-10−2, 10−2-10−1, and ≥10−1.
Percentage of patients in each MRD category over time. Also includes patients who have not progressed and are still in follow-up but do not have MRD data at each time point. MRD data after progression are not included. MRD levels are categorized into undetectable and detectable up to 10−3, 10−3-10−2, 10−2-10−1, and ≥10−1.
For patients assigned to IR, MRD levels decreased from 12 to 24 months and further decreased from 24 to 36 months. The median MRD levels were 3.5 × 10⁻², 1.6 × 10⁻², and 1.1 × 10⁻² at 12, 24, and 36 months, respectively, with corresponding mean MRD levels being 1.3 × 10⁻¹, 8.2 × 10⁻², and 5.1 × 10⁻². Decreasing MRD levels were observed in patients who had complete remission (CR) at 12-month response evaluation (median MRD levels, 7.1 × 10⁻³, 5.9 × 10⁻³, and 1.8 × 10⁻³ at 12, 24, and 36 months) and in those who did not (median MRD levels 4.9 × 10⁻², 2.9 × 10⁻², and 1.3 × 10⁻² at 12, 24, and 36 months). Patients in CR at 12 months had lower median MRD levels at all 3 time points than those who were not in CR at 12 months (Figure 2). Only 1 patient in CR had an MRD level >10−1 at 12 months, which decreased to <10−1 at 24 months and further decreased at 36 months.

MRD levels by time points and 12-month CR status. MRD data after progression are not included. MRD levels from the same patients are connected by lines. All IR-treated patients with MRD data (A); all FCR-treated patients with MRD data (B); IR-treated patients in CR at the 12-month response evaluation (C); FCR-treated patients in CR at the 12-month response evaluation (D); IR-treated patients not in CR at the 12-month response evaluation (E); and FCR-treated patients not in CR at the 12-month response evaluation (F). uMRD, undetectable MRD.
MRD levels by time points and 12-month CR status. MRD data after progression are not included. MRD levels from the same patients are connected by lines. All IR-treated patients with MRD data (A); all FCR-treated patients with MRD data (B); IR-treated patients in CR at the 12-month response evaluation (C); FCR-treated patients in CR at the 12-month response evaluation (D); IR-treated patients not in CR at the 12-month response evaluation (E); and FCR-treated patients not in CR at the 12-month response evaluation (F). uMRD, undetectable MRD.
In patients in the FCR arm, the median MRD levels were 0 at 3, 12, and 24 months and 4.0 × 10⁻⁴ at 36 months. The mean MRD levels at 3, 12, 24, and 36 months were 2.4 × 10⁻², 7.9 × 10⁻³, 1.3 × 10⁻², and 3.2 × 10⁻², respectively. In patients in CR at 12 months, the median MRD was 0 at all 4 time points, and the proportion known to achieve undetectable MRD at 3, 12, 24, and 36 months was 47.2%, 56.6%, 41.5%, and 15.1% among all patients in the FCR arm. For those not in CR at 12 months, median MRD levels decreased from 1.6 × 10⁻⁴ at 3 months to 0 at 12 months, and then increased to 2.0 × 10⁻⁴ at 24 months and further increased to 1.1 × 10⁻³ at 36 months (Figure 2).
Baseline characteristics associated with achieving undetectable MRD
A total of 290 patients randomly assigned to receive IR were tested for MRD successfully at 1 or more time points. Among them, 38 (13.1%) had undetectable MRD. Univariable associations with baseline patient characteristics are shown in Table 1. For patients in the FCR arm, a total of 122 were tested for MRD successfully at ≥1 points, and 83 (68.0%) had undetectable MRD. Univariable associations with baseline patient characteristics are shown in Table 2. In a multivariable logistic model of the IR arm data, we found that mutated IGHV, lower %CD19+CD5+, and higher %CD49d+ cell counts at baseline were associated with achieving undetectable MRD. A multivariable logistic model for the FCR arm showed that higher hemoglobin level, mutated IGHV, and higher %CD49d+ cell count were associated with achieving undetectable MRD (Table 3).
Baseline patient characteristics by MRD status of patients randomly assigned to IR and tested successfully for MRD
| Variable/category | MRD− | MRD+ | Total | P |
|---|---|---|---|---|
| Patients, n | 38 | 252 | 290 | – |
| Age | ||||
| Mean (SD) | 56.4 (7.0) | 56.3 (7.4) | 56.3 (7.3) | .879 |
| Median (Q1, Q3) | 57.5 (54.0, 60.8) | 57.0 (51.8, 62.0) | 57.0 (52.0, 62.0) | |
| [Min, max] | [35.0, 67.0] | [31.0, 70.0] | [31.0, 70.0] | |
| Freq. of missing | 0 | 0 | 0 | |
| Age, category | ||||
| <60 | 25 (65.8) | 157 (62.3) | 182 (62.8) | .723 |
| ≥60 | 13 (34.2) | 95 (37.7) | 108 (37.2) | |
| Unknown/missing | 0 | 0 | 0 | |
| Sex | ||||
| Female | 13 (34.2) | 83 (32.9) | 96 (33.1) | .855 |
| Male | 25 (65.8) | 169 (67.1) | 194 (66.9) | |
| Unknown/missing | 0 | 0 | 0 | |
| Rai stage | ||||
| Low, 0 | 2 (5.3) | 9 (3.6) | 11 (3.8) | .496 |
| Intermediate, I-II | 23 (60.5) | 136 (54.0) | 159 (54.8) | |
| High, III-IV | 13 (34.2) | 107 (42.5) | 120 (41.4) | |
| Unknown/missing | 0 | 0 | 0 | |
| ECOG PS | ||||
| 0 | 19 (50.0) | 162 (64.3) | 181 (62.4) | .234 |
| 1 | 18 (47.4) | 86 (34.1) | 104 (35.9) | |
| 2 | 1 (2.6) | 4 (1.6) | 5 (1.7) | |
| Unknown/missing | 0 | 0 | 0 | |
| Hemoglobin, g/dL | ||||
| Mean (SD) | 12.6 (2.5) | 12.2 (2.1) | 12.2 (2.2) | .180 |
| Median (Q1, Q3) | 12.8 (11.2, 14.5) | 12.3 (10.7, 13.8) | 12.4 (10.7, 14.0) | |
| [Min, max] | [6.5, 16.0] | [4.4, 17.5] | [4.4, 17.5] | |
| Freq. of missing | 0 | 2 | 2 | |
| Platelets, 103/μL | ||||
| Mean (SD) | 190.1 (85.7) | 157.8 (68.6) | 162.0 (71.7) | .051 |
| Median (Q1, Q3) | 170.5 (117.5, 246.2) | 152.0 (110.0, 197.5) | 152.5 (110.2, 201.0) | |
| [Min, max] | [68.0, 356.0] | [9.6, 508.0] | [9.6, 508.0] | |
| Freq. of missing | 0 | 0 | 0 | |
| WBC, 103/μL | ||||
| Mean (SD) | 88.4 (129.2) | 109.8 (114.7) | 107.0 (116.7) | .016 |
| Median (Q1, Q3) | 27.2 (8.4, 109.0) | 73.6 (23.7, 161.5) | 63.2 (20.1, 156.5) | |
| [Min, max] | [4.7, 617.5] | [1.6, 597.7] | [1.6, 617.5] | |
| Freq. of missing | 0 | 0 | 0 | |
| β2-Microglobulin, mg/L | ||||
| Mean (SD) | 3.8 (2.0) | 4.0 (2.0) | 3.9 (2.0) | .443 |
| Median (Q1, Q3) | 3.3 (2.4, 4.5) | 3.6 (2.5, 4.6) | 3.6 (2.5, 4.6) | |
| [Min, max] | [1.3, 10.7] | [1.4, 14.4] | [1.3, 14.4] | |
| Freq. of missing | 0 | 2 | 2 | |
| β2-Microglobulin, category* | ||||
| Elevated | 17 (44.7) | 131 (52.4) | 148 (51.4) | .390 |
| Normal | 21 (55.3) | 119 (47.6) | 140 (48.6) | |
| Unknown/missing | 0 | 2 | 2 | |
| Serum creatinine, mg/dL | ||||
| Mean (SD) | 96.5 (7.3) | 96.5 (6.5) | 96.5 (6.6) | .658 |
| Median (Q1, Q3) | 95.0 (92.0, 97.1) | 95.1 (92.2, 99.2) | 95.1 (92.2, 98.9) | |
| [Min, max] | [88.1, 123.0] | [86.2, 123.9] | [86.2, 123.9] | |
| Freq. of missing | 0 | 0 | 0 | |
| Coombs test† | ||||
| Negative | 36 (97.3) | 229 (93.5) | 265 (94.0) | .708 |
| Positive | 1 (2.7) | 16 (6.5) | 17 (6.0) | |
| Unknown/missing | 1 | 7 | 8 | |
| Splenomegaly | ||||
| No | 30 (78.9) | 151 (59.9) | 181 (62.4) | .030 |
| Yes | 8 (21.1) | 101 (40.1) | 109 (37.6) | |
| Unknown/missing | 0 | 0 | 0 | |
| Lymphadenopathy | ||||
| No | 14 (36.8) | 70 (27.8) | 84 (29.0) | .255 |
| Yes | 24 (63.2) | 182 (72.2) | 206 (71.0) | |
| Unknown/missing | 0 | 0 | 0 | |
| Del(11q22.3) | ||||
| Abnormal | 5 (13.2) | 62 (24.7) | 67 (23.2) | .149 |
| Normal | 33 (86.8) | 189 (75.3) | 222 (76.8) | |
| Unknown/missing | 0 | 1 | 1 | |
| Dohner classification‡ | ||||
| Del(17p) | 0 (0.0) | 0 (0.0) | 0 (0.0) | .033 |
| Del(11q22) | 5 (13.2) | 62 (24.6) | 67 (23.1) | |
| Trisomy 12 | 16 (42.1) | 46 (18.3) | 62 (21.4) | |
| Normal | 5 (13.2) | 49 (19.4) | 54 (18.6) | |
| Del(13q) | 10 (26.3) | 84 (33.3) | 94 (32.4) | |
| Other | 2 (5.3) | 11 (4.4) | 13 (4.5) | |
| Unknown/missing | 0 | 0 | 0 | |
| IGHV | ||||
| Mutated | 13 (39.4) | 49 (21.9) | 62 (24.1) | .047 |
| Unmutated | 20 (60.6) | 175 (78.1) | 195 (75.9) | |
| Unknown/missing | 5 | 28 | 33 | |
| Time up and go, s§ | ||||
| Mean (SD) | 8.1 (2.6) | 8.7 (2.4) | 8.6 (2.4) | .097 |
| Median (Q1, Q3) | 8.0 (6.0, 9.8) | 9.0 (7.0, 10.0) | 9.0 (7.0, 10.0) | |
| [Min, max] | [4.0, 17.0] | [2.0, 21.0] | [2.0, 21.0] | |
| Freq. of missing | 0 | 3 | 3 | |
| CIRS | ||||
| Mean (SD) | 2.2 (2.3) | 1.9 (2.2) | 2.0 (2.2) | .580 |
| Median (Q1, Q3) | 2.0 (1.0, 2.8) | 1.0 (0.0, 3.0) | 2.0 (0.0, 3.0) | |
| [Min, max] | [0.0, 10.0] | [0.0, 14.0] | [0.0, 14.0] | |
| Freq. of missing | 8 | 28 | 36 | |
| % CD19+CD5+ cells | ||||
| Mean (SD) | 59.6 (32.1) | 78.5 (22.0) | 76.0 (24.4) | <.001 |
| Median (Q1, Q3) | 70.2 (31.1, 87.6) | 87.8 (69.1, 95.3) | 85.2 (62.8, 94.9) | |
| [Min, max] | [1.3, 97.6] | [2.8, 99.3] | [1.3, 99.3] | |
| Freq. of missing | 0 | 6 | 6 | |
| % CD38+ cells | ||||
| Mean (SD) | 47.5 (37.3) | 35.4 (32.9) | 37.0 (33.7) | .084 |
| Median (Q1, Q3) | 47.2 (8.2, 83.5) | 25.4 (4.3, 61.8) | 27.6 (4.4, 67.3) | |
| [Min, max] | [0.2, 99.9] | [0.1, 99.7] | [0.1, 99.9] | |
| Freq. of missing | 0 | 6 | 6 | |
| %CD38+ cells, category | ||||
| High (>30%) | 23 (60.5) | 114 (46.3) | 137 (48.2) | .118 |
| Low (≤30%) | 15 (39.5) | 132 (53.7) | 147 (51.8) | |
| Unknown/missing | 0 | 6 | 6 | |
| % CD49d+ cells | ||||
| Mean (SD) | 74.5 (37.8) | 43.2 (41.8) | 47.4 (42.6) | <.001 |
| Median (Q1, Q3) | 98.0 (44.6, 99.9) | 35.5 (1.2, 88.7) | 44.7 (1.5, 96.5) | |
| [Min, max] | [0.1,100.0] | [0.1,100.0] | [0.1,100.0] | |
| Freq. of missing | 0 | 6 | 6 | |
| %CD49d+ cells, category | ||||
| High (>30%) | 31 (81.6) | 124 (50.4) | 155 (54.6) | <.001 |
| Low (≤30%) | 7 (18.4) | 122 (49.6) | 129 (45.4) | |
| Unknown/missing | 0 | 6 | 6 | |
| % ZAP-70+ cells | ||||
| Mean (SD) | 21.3 (22.7) | 21.4 (21.8) | 21.4 (21.9) | .785 |
| Median (Q1, Q3) | 14.9 (2.5, 31.9) | 13.0 (4.7, 32.0) | 13.1 (4.3, 32.2) | |
| [Min, max] | [0.1, 83.6] | [0.0, 93.3] | [0.0, 93.3] | |
| Freq. of missing | 0 | 7 | 7 | |
| %ZAP-70+ cells, category | ||||
| High (>20%) | 14 (36.8) | 94 (38.4) | 108 (38.2) | 1.000 |
| Low (≤20%) | 24 (63.2) | 151 (61.6) | 175 (61.8) | |
| Unknown/missing | 0 | 7 | 7 | |
| TK (U/L) | ||||
| Mean (SD) | 36.8 (47.3) | 33.0 (37.6) | 33.5 (38.9) | 0.937 |
| Median (Q1, Q3) | 21.0 (10.0, 34.0) | 21.5 (9.6, 44.4) | 21.5 (9.6, 44.1) | |
| [Min, max] | [0.0, 207.0] | [0.0, 348.0] | [0.0, 348.0] | |
| Freq. of missing | 0 | 8 | 8 |
Baseline patient characteristics by MRD status for patients randomly assigned to FCR and tested successfully for MRD
| Variable/category | MRD− | MRD+ | Total | P |
|---|---|---|---|---|
| Patients, n | 83 | 39 | 122 | – |
| Age | ||||
| Mean (SD) | 56.4 (7.3) | 56.6 (6.7) | 56.4 (7.1) | .895 |
| Median (Q1, Q3) | 57.0 (51.0, 62.0) | 57.0 (53.0, 60.0) | 57.0 (52.0, 61.8) | |
| [Min, max] | [32.0, 69.0] | [28.0, 68.0] | [28.0, 69.0] | |
| Freq. of missing | 0 | 0 | 0 | |
| Age, category | ||||
| <60 | 51 (61.4) | 24 (61.5) | 75 (61.5) | 1.000 |
| ≥60 | 32 (38.6) | 15 (38.5) | 47 (38.5) | |
| Unknown/missing | 0 | 0 | 0 | |
| Sex | ||||
| Female | 30 (36.1) | 10 (25.6) | 40 (32.8) | .304 |
| Male | 53 (63.9) | 29 (74.4) | 82 (67.2) | |
| Unknown/missing | 0 | 0 | 0 | |
| RAI stage | ||||
| Low, 0 | 8 (9.6) | 1 (2.6) | 9 (7.4) | .170 |
| Intermediate, I-II | 47 (56.6) | 19 (48.7) | 66 (54.1) | |
| High, III-IV | 28 (33.7) | 19 (48.7) | 47 (38.5) | |
| Unknown/missing | 0 | 0 | 0 | |
| ECOG performance status | ||||
| 0 | 50 (60.2) | 20 (51.3) | 70 (57.4) | .593 |
| 1 | 32 (38.6) | 18 (46.2) | 50 (41.0) | |
| 2 | 1 (1.2) | 1 (2.6) | 2 (1.6) | |
| Unknown/missing | 0 | 0 | 0 | |
| Hemoglobin, g/dL | ||||
| Mean (SD) | 12.6 (2.0) | 11.6 (1.8) | 12.2 (2.0) | .004 |
| Median (Q1, Q3) | 12.8 (11.5, 14.1) | 11.9 (10.6, 12.6) | 12.5 (11.2, 13.8) | |
| [Min, max] | [5.5, 17.6] | [6.9, 15.9] | [5.5, 17.6] | |
| Freq. of missing | 1 | 1 | 2 | |
| Platelets, 103/μL | ||||
| Mean (SD) | 163.9 (79.7) | 151.6 (84.1) | 159.9 (81.0) | .339 |
| Median (Q1, Q3) | 151.0 (105.0, 204.0) | 130.0 (98.5, 183.0) | 144.5 (103.5, 191.5) | |
| [Min, max] | [43.0, 485.0] | [13.0, 433.0] | [13.0, 485.0] | |
| Freq. of missing | 0 | 0 | 0 | |
| WBC, 103/μL | ||||
| Mean (SD) | 92.9 (95.8) | 129.9 (117.4) | 104.7 (104.1) | .017 |
| Median (Q1, Q3) | 53.5 (18.8, 151.5) | 95.4 (43.6, 165.6) | 72.4 (26.4, 160.8) | |
| [Min, max] | [3.1, 434.1] | [11.8, 638.9] | [3.1, 638.9] | |
| Freq. of missing | 0 | 0 | 0 | |
| β2-Microglobulin, mg/L | ||||
| Mean (SD) | 3.8 (1.8) | 4.4 (2.1) | 4.0 (1.9) | .065 |
| Median (Q1, Q3) | 3.4 (2.5, 4.5) | 3.8 (3.1, 5.3) | 3.4 (2.7, 4.8) | |
| [Min, max] | [1.3, 12.2] | [2.0, 11.1] | [1.3, 12.2] | |
| Freq. of missing | 0 | 0 | 0 | |
| β2-Microglobulin, category* | ||||
| Elevated | 38 (45.8) | 21 (53.8) | 59 (48.4) | .442 |
| Normal | 45 (54.2) | 18 (46.2) | 63 (51.6) | |
| Unknown/missing | 0 | 0 | 0 | |
| Serum creatinine, mg/dL | ||||
| Mean (SD) | 96.0 (5.6) | 96.1 (6.1) | 96.0 (5.7) | .943 |
| Median (Q1, Q3) | 95.1 (91.9, 99.6) | 94.5 (92.5, 97.4) | 94.7 (92.5, 98.5) | |
| [Min, max] | [86.8, 117.1] | [87.5, 117.9] | [86.8, 117.9] | |
| Freq. of missing | 0 | 0 | 0 | |
| Coombs test† | ||||
| Negative | 75 (92.6) | 38 (97.4) | 113 (94.2) | .425 |
| Positive | 6 (7.4) | 1 (2.6) | 7 (5.8) | |
| Unknown/missing | 2 | 0 | 2 | |
| Splenomegaly | ||||
| No | 52 (62.7) | 18 (46.2) | 70 (57.4) | .116 |
| Yes | 31 (37.3) | 21 (53.8) | 52 (42.6) | |
| Unknown/missing | 0 | 0 | 0 | |
| Lymphadenopathy | ||||
| No | 31 (37.3) | 9 (23.1) | 40 (32.8) | .149 |
| Yes | 52 (62.7) | 30 (76.9) | 82 (67.2) | |
| Unknown/missing | 0 | 0 | 0 | |
| Del(11q22.3) | ||||
| Abnormal | 15 (18.1) | 11 (28.2) | 26 (21.3) | .238 |
| Normal | 68 (81.9) | 28 (71.8) | 96 (78.7) | |
| Unknown/missing | 0 | 0 | 0 | |
| Dohner classification‡ | ||||
| Del(17p) | 0 (0.0) | 0 (0.0) | 0 (0.0) | .226 |
| Del(11q22) | 15 (18.1) | 11 (28.2) | 26 (21.3) | |
| Trisomy 12 | 15 (18.1) | 9 (23.1) | 24 (19.7) | |
| Normal | 19 (22.9) | 3 (7.7) | 22 (18.0) | |
| Del(13q) | 28 (33.7) | 12 (30.8) | 40 (32.8) | |
| Other | 6 (7.2) | 4 (10.3) | 10 (8.2) | |
| Unknown/missing | 0 | 0 | 0 | |
| IGHV | ||||
| Mutated | 34 (49.3) | 9 (25.7) | 43 (41.3) | .034 |
| Unmutated | 35 (50.7) | 26 (74.3) | 61 (58.7) | |
| Unknown/missing | 14 | 4 | 18 | |
| Time up and go, s§ | ||||
| Mean (SD) | 8.5 (2.1) | 9.8 (3.3) | 8.9 (2.6) | .053 |
| Median (Q1, Q3) | 8.0 (7.0, 10.0) | 9.0 (8.0, 10.0) | 9.0 (7.2, 10.0) | |
| [Min, max] | [2.0, 16.0] | [5.0, 20.0] | [2.0, 20.0] | |
| Freq. of missing | 0 | 0 | 0 | |
| CIRS | ||||
| Mean (SD) | 2.2 (1.9) | 2.5 (2.0) | 2.3 (2.0) | .360 |
| Median (Q1, Q3) | 2.0 (0.0, 3.5) | 2.0 (1.0, 4.0) | 2.0 (1.0, 4.0) | |
| [Min, max] | [0.0, 7.0] | [0.0, 7.0] | [0.0, 7.0] | |
| Freq. of missing | 8 | 9 | 17 | |
| % CD19+CD5+cells | ||||
| Mean (SD) | 69.5 (28.8) | 83.1 (17.8) | 73.8 (26.5) | .012 |
| Median (Q1, Q3) | 79.3 (53.0, 93.6) | 90.3 (72.6, 96.3) | 85.1 (61.4, 94.5) | |
| [Min, max] | [3.8, 99.2] | [33.6, 99.1] | [3.8, 99.2] | |
| Freq. of missing | 2 | 1 | 3 | |
| % CD38+ cells | ||||
| Mean (SD) | 35.1 (36.8) | 31.3 (34.5) | 33.9 (36.0) | .372 |
| Median (Q1, Q3) | 15.6 (2.0, 70.9) | 19.8 (1.0, 55.7) | 17.9 (1.5, 65.9) | |
| [Min, max] | [0.1, 99.7] | [0.2, 95.3] | [0.1, 99.7] | |
| Freq. of missing | 2 | 1 | 3 | |
| %CD38+ cells, category | ||||
| High (>30%) | 36 (44.4) | 15 (39.5) | 51 (42.9) | .693 |
| Low (≤30%) | 45 (55.6) | 23 (60.5) | 68 (57.1) | |
| Unknown/missing | 2 | 1 | 3 | |
| % CD49d+ cells | ||||
| Mean (SD) | 46.1 (44.3) | 25.4 (36.9) | 39.5 (43.0) | .009 |
| Median (Q1, Q3) | 22.4 (1.5, 98.0) | 7.8 (0.4, 35.8) | 13.9 (1.0, 97.0) | |
| [Min, max] | [0.2, 100.0] | [0.1, 100.0] | [0.1, 100.0] | |
| Freq. of missing | 2 | 1 | 3 | |
| %CD49d+ cells, category | ||||
| High (>30%) | 40 (49.4) | 11 (28.9) | 51 (42.9) | .047 |
| Low (≤30%) | 41 (50.6) | 27 (71.1) | 68 (57.1) | |
| Unknown/missing | 2 | 1 | 3 | |
| % ZAP-70+ cells | ||||
| Mean (SD) | 19.2 (19.7) | 19.7 (24.0) | 19.3 (21.1) | .713 |
| Median (Q1, Q3) | 9.6 (3.9, 31.6) | 12.9 (2.6, 23.7) | 9.6 (3.5, 30.6) | |
| [Min, max] | [0.1, 67.1] | [0.2, 82.7] | [0.1, 82.7] | |
| Freq. of missing | 2 | 1 | 3 | |
| %ZAP-70+ cells, category | ||||
| High (>20%) | 30 (37.0) | 12 (31.6) | 42 (35.3) | .682 |
| Low (≤20%) | 51 (63.0) | 26 (68.4) | 77 (64.7) | |
| Unknown/missing | 2 | 1 | 3 | |
| TK (U/L) | ||||
| Mean (SD) | 24.5 (28.6) | 43.2 (87.3) | 30.5 (55.0) | .091 |
| Median (Q1, Q3) | 15.0 (7.1, 34.7) | 26.3 (11.1, 42.5) | 17.7 (8.4, 37.4) | |
| [Min, max] | [0.0, 199.0] | [0.0, 547.0] | [0.0, 547.0] | |
| Freq. of missing | 2 | 1 | 3 |
Multivariable logistic regression to identify baseline characteristics associated with achieving undetectable MRD for the IR and FCR arms
| Estimated log odds ratio | Lower 95% CI | Upper 95% CI | P | |
|---|---|---|---|---|
| IR arm* | ||||
| Intercept | −1.144 | −3.146 | 0.829 | .257 |
| Platelets (103/μL) | 4.583 | −0.896 | 10.180 | .102 |
| Lymphadenopathy, yes (vs no) | −0.786 | −1.785 | 0.124 | .103 |
| IGHV, unmutated (vs mutated) | −1.577 | −2.513 | −0.665 | .001 |
| %CD19+CD5+ cells† | −0.018 | −0.033 | −0.003 | .020 |
| %CD49d+ cells‡ | 0.019 | 0.009 | 0.030 | .001 |
| FCR arm§ | ||||
| Intercept | 0.480 | −3.657 | 4.730 | .820 |
| Hemoglobin (g/dL) | 0.312 | 0.079 | 0.563 | .011 |
| IGHV, unmutated (vs mutated) | −1.388 | −2.488 | −0.386 | .009 |
| Time up and go (s) | −0.178 | −0.377 | −0.003 | .059 |
| %CD19+CD5+ cells† | −0.019 | −0.043 | 0.002 | .100 |
| %CD49d+ cells‡ | 0.013 | 0.001 | 0.026 | .042 |
The analysis included 284 patients. Six patients with missing %CD19+CD5+, %CD38+, and %CD49d+ data were excluded. Patients with missing IGHV data were coded as unknown and are not shown in the table. Positive estimated log ORs indicate a higher likelihood of achieving undetectable MRD as values increased for continuous variables and for the level under consideration, compared with the reference for categorical variables. This model suggests that it is more likely that undetectable MRD will be achieved in patients with mutated IGHV, lower %CD19+CD5+ cell counts, and higher %CD49d+ cell counts, while considering platelets and lymphadenopathy. The intercept gives the estimated baseline log odds.
Among lymphocytes.
Among CD19+ cells.
The analysis included 119 patients. Three patients with missing %CD49d+ data were excluded. Patients with missing IGHV data were coded as unknown and not shown in this table. Positive estimated log odds ratios indicate a higher likelihood of achieving undetectable MRD as values increase for continuous variables and for the level under consideration compared with the reference for categorical variables. The model suggests that undetectable MRD is more likely to be achieved in patients with higher hemoglobin level, mutated IGHV, and higher %CD49d+ cell counts, while considering time-up-and-go and %CD19+CD5+ cell counts. The intercept gives the estimated baseline log odds.
We also assessed the association between CLL International Prognostic Index27 and achieving undetectable MRD and found that the mean CLL International Prognostic Index score was higher in patients who did not achieve undetectable MRD in the FCR arm (3.9 vs 3.2; P = .03) or the IR arm (4.1 vs 3.5; P = .08).
MRD levels at each time point and PFS
Patients assigned to receive FCR who had undetectable MRD had significantly better PFS than those who had detectable MRD (Figure 3). This finding was true at 3, 12, and 24 months, with estimated HRs (detectable MRD/undetectable MRD) of 4.29 (95% confidence interval [CI], 1.89-9.71), 3.91 (95% CI, 1.39-11.03), and 14.12 (95% CI, 1.78-111.73), respectively. The HR was not estimable (no events among those with undetectable MRD) at 36 months. When patients with detectable MRD were further divided by MRD level according to cutoffs of 10−3, 10−2, and 10−1, those with MRD levels >10−1 had the worst PFS, followed by those with MRD levels between 10−2 and 10−1 and then by those with MRD levels <10−2. The relationship among patients with undetectable, <10−3, and <10−2 MRD remains unclear because of the low number of events in these groups. A similar pattern was observed when patients with detectable MRD were categorized into low MRD (10−4-10−2) and high MRD (≥10−2) (supplemental Figure 2).
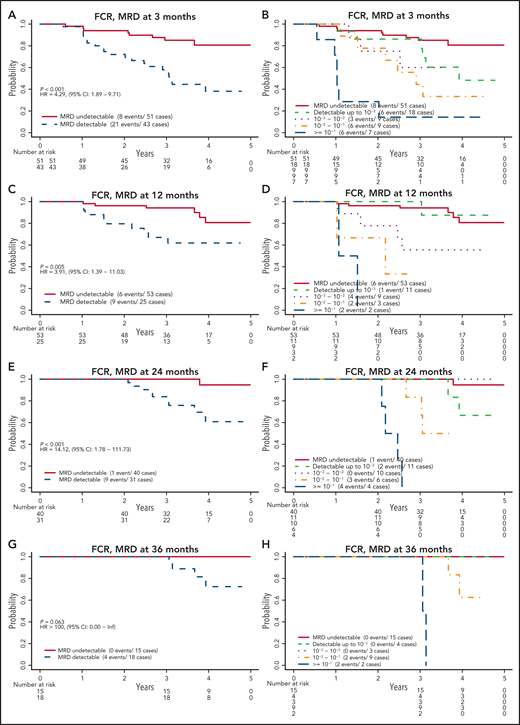
PFS by MRD levels at defined time points for patients randomly assigned to the FCR arm. MRD detectable or not at 3 months (A); cutoff levels of 10−3, 10−2, and 10−1 at 3 months (B); MRD detectable or not at 12 months (C); cutoff levels of 10−3, 10−2, and 10−1 at 12 months (D); MRD detectable or not at 24 months (E); cutoff levels of 10−3, 10−2, and 10−1 at 24 months (F); MRD detectable or not at 36 months (G); and cutoff levels of 10−3, 10−2, and 10−1 at 36 months (H).
PFS by MRD levels at defined time points for patients randomly assigned to the FCR arm. MRD detectable or not at 3 months (A); cutoff levels of 10−3, 10−2, and 10−1 at 3 months (B); MRD detectable or not at 12 months (C); cutoff levels of 10−3, 10−2, and 10−1 at 12 months (D); MRD detectable or not at 24 months (E); cutoff levels of 10−3, 10−2, and 10−1 at 24 months (F); MRD detectable or not at 36 months (G); and cutoff levels of 10−3, 10−2, and 10−1 at 36 months (H).
Patients in the FCR arm, who were in CR regardless of MRD status at the 12-month time point, had a PFS similar to that of patients who were not in CR at that time but had undetectable MRD, whereas those not in CR and with detectable MRD had significantly worse PFS (HR, 3.88; 95% CI, 1.40-10.73; supplemental Figure 3). When IGHV mutation status was considered, patients who had detectable MRD with an unmutated IGHV status had the worst PFS, especially at 12 months and thereafter (supplemental Figure 4).
In contrast, for the IR arm, there was no significant difference in PFS between patients with undetectable MRD and those with detectable MRD at any of the 3 time points studied for MRD (P = .14, .90, and .53 at 12, 24, and 36 months, respectively). When patients with detectable MRD were further divided using the same cutoffs of 10−3, 10−2, and 10−1, as for the FCR arm, there was no clear separation of the Kaplan-Meier PFS estimates, except for those with MRD of 10−1 or more at 12 months (Figure 4). The estimated HRs for those with MRD ≥10−1 vs those with MRD <10−1 were 2.03 (95% CI, 1.01-4.07), 1.53 (95% CI, 0.54-4.37), and 2.54 (95% CI, 0.48-13.44) at 12, 24, and 36 months, respectively. No clear separation was observed when detectable MRD levels were categorized into low MRD (10−4-10−2) and high MRD (≥ 10−2) (supplemental Figure 5). Patients in the IR arm who were not in CR at the 12-month time point and had detectable MRD had significantly worse PFS (HR, 3.73; 95% CI, 1.14-12.27; supplemental Figure 6) than patients who had CR or undetectable MRD. No clear response pattern emerged when IGHV status was considered (supplemental Figure 7). As a continuous variable on the log10 scale, patients with higher levels of MRD tended to have a shorter PFS, with HRs of 1.33 (95% CI, 0.98-1.80), 1.13 (95% CI, 0.72-1.78), and 2.08 (95% CI, 0.84-5.16) for each 10-fold increase in MRD level at 12, 24, and 36 months, respectively.

PFS by MRD levels at defined time points for patients assigned to the IR arm. Cutoff level of 10−1 at 12 months (A); cutoff levels of 10−3, 10−2, and 10−1 at 12 months (B); cutoff level of 10−1 at 24 months (C); cutoff levels of 10−3, 10−2, and 10−1 at 24 months (D); cutoff level of 10−1 at 36 months (E); and cutoff levels of 10−3, 10−2, and 10−1 at 36 months (F).
PFS by MRD levels at defined time points for patients assigned to the IR arm. Cutoff level of 10−1 at 12 months (A); cutoff levels of 10−3, 10−2, and 10−1 at 12 months (B); cutoff level of 10−1 at 24 months (C); cutoff levels of 10−3, 10−2, and 10−1 at 24 months (D); cutoff level of 10−1 at 36 months (E); and cutoff levels of 10−3, 10−2, and 10−1 at 36 months (F).
Risk of progression over time
Baseline IGHV mutation status was not found to be associated with PFS in the IR arm. In a multivariable Cox model (Table 4) that considered MRD levels (using 10−1 as the cutoff) over time and whether ibrutinib was discontinued early for reasons other than progression or death, we found that MRD levels of 10−1 or higher (HR, 6.50; 95% CI, 2.50-16.87) and discontinuing ibrutinib early (HR, 19.09; 95% CI, 7.50-48.58) were associated with a shorter PFS. Once ibrutinib was discontinued, the difference in PFS between those with an MRD level of 10−1 or more and those with <10−1 MRD was substantially reduced (HR, 1.96; 95% CI, 0.23-16.73). There was no association between not reaching 10−1 and early discontinuation of IR (odds ratio [OR], 1.30; P = .665).
Multivariable Cox model with MRD, early ibrutinib discontinuation, and their interaction as time-varying covariates in the IR arm and multivariable Cox model with baseline IGHV mutation status and MRD status as a time-varying covariate in the FCR arm
| Estimated HR | 95% CI | P | |
|---|---|---|---|
| IR arm* | |||
| MRD (reference: <10−1) ≥10−1 | 6.50 | 2.50-16.87 | <.001 |
| Early discontinuation (reference: continuing ibrutinib) | 19.09 | 7.50-48.58 | <.001 |
| Interaction (reference: <10−1 and continuing ibrutinib) ≥10−1 and off | 0.30 | 0.07-1.22 | .093 |
| FRC arm† | |||
| MRD detectable (reference: undetectable) | 3.82 | 1.70-8.58 | .0012 |
| IGHV unmutated (reference: mutated) | 1.72 | 0.76-3.90 | .196 |
MRD status (with 10−1 as cutoff) at all 3 time points were considered in the model.
MRD status (detectable or not) at all 4 time points were considered in the model.
Patients in the FCR arm with unmutated IGHV at baseline were found to have a significantly shorter PFS than those with mutated IGHV (HR, 2.27; 95% CI, 1.02-5.06, among patients with MRD data). When considered in the multivariable Cox model (Table 4) of MRD status (detectable or undetectable) over time, detectable MRD was found to be associated with shorter PFS (HR, 3.82; 95% CI, 1.70-8.58), whereas IGHV status was no longer statistically significant (HR, 1.72; 95% CI, 0.76-3.90; P = .196).
Discussion
MRD levels were studied for association with clinical outcomes for patients with CLL treated in an ECOG-ACRIN–led phase 3 trial testing the combination of IR vs FCR, the gold standard of CIT. For patients receiving indefinite ibrutinib-based therapy who do not reach undetectable MRD status, those with an MRD <10−1 tend to have longer PFS. The pattern of MRD in IR-treated patients was thus strikingly different from that in those treated with FCR and most likely other CIT combinations that may generate undetectable MRD, albeit at much lower levels. One such recent example of this includes CIT combinations such as BR combinations, where a level of 13.3% for undetectable MRD has been seen after BR completion.28 Importantly, even in BR combinations achieving undetectable MRD it does associate with enhanced PFS. Our data from the IR arm provide novel insights into the relationship of MRD with clinical outcome for ibrutinib-containing therapies that are continuously administered. As expected, MRD levels were highly predictive of outcome for the FCR-treated patients with CLL, confirming prior reports.11-13
We observed that most of the patients in the FCR arm had undetectable MRD status at 3, 12, and 24 months after randomization, and undetectable MRD was associated with significantly better PFS. The estimated HRs of 4.29 and 3.91 at 3 and 12 months, respectively, for detectable MRD vs undetectable MRD were very close to those observed in the randomized phase 3 trials of CLL829,30 and CLL1031 in which MRD was also assessed in peripheral blood. Baseline IGHV status was found to be associated with achieving undetectable MRD; hence, in a multivariable model with MRD status, baseline IGHV status, which is associated with PFS on its own merit,18 was no longer significantly associated with PFS (Table 4). These findings further confirm the potential utility of MRD as a surrogate end point in CLL trials with time-limited CIT therapies that achieve deep remission.11,12
In contrast to those in the FCR arm, only 13.1% of patients in the IR arm had undetectable MRD by 36 months. Although there was no clear association of MRD status with PFS on the IR arm at any time point, a multivariable model showed that MRD levels of >10−1 at any time were associated with a shorter PFS compared with lower MRD levels. Once ibrutinib was discontinued earlier than planned as per protocol (before progression or death, primarily caused by toxicity), the advantage of having <10−1 MRD was reduced. These observations demonstrate that additional information, such as early treatment discontinuation, may have to be considered when using MRD to monitor clinical response in trials with indefinite ibrutinib-based approaches.
The single use of either ibrutinib or acalabrutinib does not typically result in undetectable MRD. However, with the addition of either the anti-CD20 antibodies rituximab or obinutuzumab to a BTK inhibitor (BTKi) the incidence of undetectable MRD increases. One example of this is the recent Alliance-led intergroup phase 3 trial17 where the rate of undetectable MRD was 1% for the ibrutinib monotherapy arm and 4% for the ibrutinib plus rituximab arm. However, in the iLLUMINATE trial,15 a randomized phase 3 trial studying ibrutinib and obinutuzumab vs chlorambucil and obinutuzumab in previously untreated CLL, the ibrutinib/obinutuzumab arm had 20% undetectable MRD in the blood. The BTKi acalabrutinib was studied in combination with obinutuzumab vs acalabrutinib alone vs chlorambucil plus obinutuzumab in the ELEVATE-TN phase 3 trial.32 The undetectable MRD rates were higher in treatment with acalabrutinib combined with obinutuzumab (13%) compared with acalabrutinib alone (1%). Thus, it appears that BTKi, in combination with anti-CD20 monoclonal antibodies, has the potential to induce higher rates of undetectable MRD compared with a BTKi alone. These latter 2 trials with higher levels of undetectable MRD are maturing and will allow for estimates of PFS in relation to undetectable MRD which will be of interest.
One caveat to our study is that we measured MRD in the peripheral blood, whereas the response evaluation relied on bone marrow examination. Our method may have increased the possibility of false-negative MRD results, given the clearance in blood vs bone marrow for leukemic B cells. In fact, 42 patients did not achieve CR among the 81 patients with undetectable MRD at 12 months in the 2 arms (supplemental Figures 3 and 6). These patients most likely had a low disease burden, given that they had a better PFS than those not in CR and who also had detectable MRD. Despite the shortcoming of assessing MRD only in the blood, it is less invasive and has been routinely used in phase 3 trials (eg, in CLL8,29 CLL10,31 CLL11,33 and CLL14,9 among others).
Limitations of our study include the low event rate, notoriously afflicting CLL trials using novel agents, and the fact that MRD assessment was not available for all patients, especially at later time points. Thus, some of our analyses have limited power. Because of the small number of deaths (n = 23), association with OS was not determined in this report. It is reasonable to consider the refinement of the cutoff for MRD level, to classify patients treated with IR by their risk of progression. We believe that the results from independent ibrutinib-based clinical trials are still needed, to show the robustness and reproducibility of MRD levels and association with clinical outcome.
In summary, the results of this large North American Intergroup phase 3 clinical trial provided valuable confirmatory as well as novel data on the utility of MRD analysis of FCR vs IR treatment of de novo CLL. Importantly, for indefinite ibrutinib-based therapies that do not induce deep remissions, patients with consistently low MRD levels of <10−1 still have significantly longer PFS and are not likely to progress in the short term. Not surprisingly, the FCR arm of MRD data added more phase 3 trial support for the use of MRD as a surrogate end point for PFS in patients with CLL treated with CIT. In addition, continuation of ibrutinib is likely necessary to maintain treatment efficacy, especially in those patients who have detectable MRD. Given this observation, the protocol specified treatment length should be clearly noted in future reviews or meta-analyses in addition to the specific drugs for each treatment arm.
It is important to validate our findings in other studies, especially our observations in the IR arm with continuous administration of ibrutinib. The ibrutinib and IR arms of Alliance trial A04120217 are ideal for this purpose, where MRD was assessed at cycle 9 in the bone marrow by a flow-based assay with the same sensitivity as the E1912 assay. We plan to start this validation study in the near future.
Acknowledgments
This study was conducted by the ECOG-ACRIN Cancer Research Group (Peter J. O’Dwyer and Mitchell D. Schnall, Group Co-chairs) and supported by the National Cancer Institute of the National Institutes of Health under the following award numbers: U10CA180820, U10CA180794, U10CA180821, U10CA180888, UG1CA189821, UG1CA189859, UG1CA189863, UG1CA190140, UG1CA232760, UG1CA233180, UG1CA233230, UG1CA233253, UG1CA233290, and UG1CA233339; and by National Institutes of Health National Cancer Institute grant R01CA193541 (principal investigators Neil Kay and Tait Shanafelt).
The content is solely the responsibility of the authors and does not necessarily represent the official views of the National Institutes of Health. Mentions of trade names, commercial products, or organizations do not imply endorsement by the US government.
Authorship
Contribution: X.V.W., T.D.S., and N.E.K. designed the research; C.A.H., R.C.T., C.E.L., and E.B., performed the research; X.V.W., C.A.H., R.C.T., C.E.L., E.B., E.M.P., S.O., J.C.B., J.F.L., C.C.Z., S.E.C., P.M.B., A.F.C., A.R.M., A.K.S., M.P.M., H.E., R.S., M.R.L, M.S.T, T.D.S., and N.E.K analyzed and interpreted the data; X.V.W. performed the statistical analysis; and X.V.W. and N.E.K. wrote the manuscript.
Conflict-of-interest disclosure: R.S. reports grants and personal fees from AbbVie and Agios; grants from Arog; and personal fees from Actinium, Astellas, Argenx, AstraZeneca, Biolinerx, Daiichi-Sankyo, Elevate, Gemoab, Hoffman LaRoche, Janssen, Macrogenics, Novartis, Otsuka, Pfizer, Syndax, Syntrix, Syros, Takeda, and Trovagene outside the submitted work. E.B. reports consulting fees from DASA. S.E.C. has received institutional research funding from AbbVie, Acerta, Gilead, Janssen, Pharmacyclics, and Takeda; has served on the Data Safety Monitoring Committee (DSMC) for Beigene and the Clinical Trial Steering Committee for Acerta; has been a consultant for AbbVie, Adaptive, Astellas, AstraZeneca, Genentech, Gilead, Janssen, and Pharmacyclics; has received honoraria from Janssen, Pharmacyclics, (CME accredited) Imedex, and Medscape and travel expenses from AbbVie, Beigene, Genentech, Janssen, and Pharmacyclics; and has served as an expert witness for Genentech. P.M.B. has been a consultant for Pharmacyclics, AbbVie, Genentech, Gilead, AstraZeneca, Bayer, Merck, Celgene/BMS, Morphosys, TG Therapeutics, and Seattle Genetics. T.D.S. has received research support from Pharmacyclics, Genentech, and AbbVie. N.E.K. has served on the advisory boards of AbbVie, AstraZeneca, Cytomx Therapy, Dava Oncology, Juno Therapeutics, Oncotracker, Pharmacyclics, and Targeted Oncology and on the DSMCs of Agios Pharm, AstraZeneca, BMS-Celgene, Cytomx Therapeutics, Morpho-sys, and Rigel; and has received research funding from AbbVie, Acerta Pharma, Bristol Meyer Squib, Celgene, MEI Pharma, Pharmacyclics, Sunesis, TG Therapeutics, and Tolero Pharmaceuticals. A.R.M. has received research support from TG Therapeutics, Pharmacyclics, AbbVie, Johnson and Johnson, Acerta, AZ, Regeneron, DTRM Bio Pharma, Sunesis, Loxo Oncology Adaptive; and has served on advisory boards and the DSMCs and as a consultant for TG Therapeutics, Pharmacyclics, AbbVie, Johnson and Johnson, Acerta, AZ, DTRM Bio Pharma, Sunesis, and Adaptive. M.S.T. has received research funding from AbbVie, Cellerant, Orsenix, ADC Therapeutics, Biosight, Glycomimetics, Rafael Pharmaceuticals, and Amgen; has served on the advisory boards of AbbVie, BioLineRx, Daiichi-Sankyo, Orsenix, KAHR, Rigel, Nohla, Delta Fly Pharma, Tetraphase, Oncolyze, Jazz Pharma, Roche, Biosight, and Novartis; and has received royalties from UpToDate. H.E. has received research funding from AbbVie, Agios, Amgen, Daiichi Sankyo, Forma, Forty Seven/Gilead, Glycomimetics, ImmunoGen, Jazz, Macrogenics, and Novartis. S.O. has received research support from Kite, Regeneron, and Gilead; has received research support and served as a consultant for Gilead, Pharmacyclics, TG Therapeutics, Pfizer, and Sunesis; and has been a consultant to Amgen, Astellas, Celgene, GSK, Janssen Oncology, Aptose Biosciences Inc, Vaniam Group LLC, AbbVie, Alexion, Verstem, Eisai, Juno Therapeutics, Vida Ventures, Autolus, Johnson and Johnson, and Merck. J.C.B. has received research funding from Oncternal and Velosbio and has been a consultant to AbbVie, AstraZeneca, Pharmacyclics/AbbVie, and Kite/Gilead. X.V.W., C.A.H., R.C.T., M.R.L., A.K.S., A.F.C., E.M.P., C.E.L., R.C.T., M.P.M., J.F.L., and C.C.Z. declare no competing financial interests.
Correspondence: Neil E. Kay, Hematology and Internal Medicine, Mayo Clinic, 200 First St SW, Rochester, MN 55905; e-mail: kay.neil@mayo.edu.
Original data will be available from the National Clinical Trials Network/NCORP archive.
The online version of this article contains a data supplement.
There is a Blood Commentary on this article in this issue.
The publication costs of this article were defrayed in part by page charge payment. Therefore, and solely to indicate this fact, this article is hereby marked “advertisement” in accordance with 18 USC section 1734.

This feature is available to Subscribers Only
Sign In or Create an Account Close Modal