

Key Points
Class II human leukocyte antigen (HLA) loci in idiopathic BMF disorders are characterized by low structural divergence.
This immunogenetic pattern contributes to a decreased T-cell receptor repertoire diversity, favoring crossreactivity and autoimmunity.

Abstract
Idiopathic aplastic anemia (IAA) is a rare autoimmune bone marrow failure (BMF) disorder initiated by a human leukocyte antigen (HLA)-restricted T-cell response to unknown antigens. As in other autoimmune disorders, the predilection for certain HLA profiles seems to represent an etiologic factor; however, the structure-function patterns involved in the self-presentation in this disease remain unclear. Herein, we analyzed the molecular landscape of HLA complexes of a cohort of 300 IAA patients and almost 3000 healthy and disease controls by deeply dissecting their genotypic configurations, functional divergence, self-antigen binding capabilities, and T-cell receptor (TCR) repertoire specificities. Specifically, analysis of the evolutionary divergence of HLA genotypes (HED) showed that IAA patients carried class II HLA molecules whose antigen-binding sites were characterized by a high level of structural homology, only partially explained by specific risk allele profiles. This pattern implies reduced HLA binding capabilities, confirmed by binding analysis of hematopoietic stem cell (HSC)-derived self-peptides. IAA phenotype was associated with the enrichment in a few amino acids at specific positions within the peptide-binding groove of DRB1 molecules, affecting the interface HLA-antigen-TCR β and potentially constituting the basis of T-cell dysfunction and autoreactivity. When analyzing associations with clinical outcomes, low HED was associated with risk of malignant progression and worse survival, underlying reduced tumor surveillance in clearing potential neoantigens derived from mechanisms of clonal hematopoiesis. Our data shed light on the immunogenetic risk associated with IAA etiology and clonal evolution and on general pathophysiological mechanisms potentially involved in other autoimmune disorders.
Introduction
Among bone marrow failure (BMF) syndromes, idiopathic aplastic anemia (IAA) is a hematopoietic stem cell (HSC) disorder mediated by autoimmune T cells. Despite the progress in our understanding of basic disease mechanisms, the strongest evidence for the immune pathogenesis of this disease stems from the successes associated with immunosupressive therapies (IST).1 In addition, clinical observations such as evolution of paroxysmal nocturnal hemoglobinuria (PNH) clones escaping from autoimmune selection pressures, as well as somatic loss of human leukocyte antigen (HLA) alleles due to deletion or mutations, further support the immune nature of this disorder.2-6
From a pathophysiological point of view, the primum movens of bone marrow (BM) destruction is thought to be a class I HLA-restricted process, characterized by cytotoxic T lymphocytes (CTLs) recognition of still unknown HSCs antigens.7-10 Experimental data demonstrating activation of CTLs with oligoclonal expansion and skewing of CD8+ T-cell receptor (TCR) repertoire together with an interferon γ (IFN-y)–driven FAS-mediated apoptosis of HSCs support this hypothesis.8,11-15 Furthermore, the imbalance of CD4+ subsets with dysfunctional T helper 1 (Th1), Th2, and Th17 responses and consequential impairment of regulatory T-cells’ activities have been demonstrated as additional factors contributing to the aberrant autoreactivity.16-19 However, because the identity of the eliciting antigens has not been ascertained, the laboratory evidence for T cell–mediated pathogenesis, albeit compelling, remains only indirect.
In the context of cellular autoimmune reactions, the pivotal role of HLA molecules in mediating the CD8+ and CD4+ processes is generally established. Specifically, in IAA, a mechanistic involvement of HLA is supported by HLA allele predilection and the establishment of modes of immune escape via somatic reshuffles of HLA locus (eg, loss or uniparental disomy of chromosome 6p or somatic mutations in class I alleles).2,3,5,20-23
While external triggers seem essential, genetic disease susceptibility factors (eg, immunogenetic polymorphisms) appear to be operative. Unlike in other autoimmune disorders, the enrichment of some class I alleles in IAA remains limited to ethnicity-restricted series,2 whereas the impact of class II loci on disease susceptibility (eg, DRB1*15:01) has been historically well documented in multiple populations.24-37
Conceptually, the predilection of certain HLA alleles could be explained by their structural “suitability” to present specific immunodominant peptides. However, the relatively small contribution of individual risk alleles in defining the etiologic fraction of IAA scarcely adapts the structure/function relationships into a disease-specific autoantigenic profile.
Recent studies have shown that HLA evolutionary divergence (HED), a metric capturing the pairwise Grantham distance38 between the peptide binding sites of 2 homologous HLA molecules encoded by an individual’s genotype, correlates with the size of the immunopeptidomic spectrum.39-41 In this virtue, more structurally divergent alleles may confer a proclivity for more efficient T-cell responses. However, such a postulate, albeit well documented in the context of antitumor and anti-infectious immune surveillance,39,40,42,43 to date has not been explored in the context of an autoimmune disorder such as IAA. Perhaps a simplistic assumption would be that higher allelic divergence may increase the probability of self-antigenic presentation, eliciting autoreactive T-cell responses and explaining the association with autoimmune disease phenotypes. Nevertheless, other hypotheses can be as well contemplated: for instance, the enrichment in less divergent HLA structures may instead contribute to the presentation of less extended immune peptidomes accounting for a decreased TCR diversity potentially at the basis of crossreactivity and autoimmune phenomena.
Herein, we sought to understand the role of HLA functional variability in defining the predisposition and the phenotypic traits of IAA and related disorders. To that end, we performed a large case-control study in which we analyzed the structural divergence of HLA molecules, its association with risk allele profiles, and the presentation of HSC-related immunopeptidomic specificities. We first performed an allele frequency estimation that helped in the identification and confirmation of the alleles more likely associated with the disease. We then examined the impact of the global genotypic and molecular HLA diversity for both class I and II loci on either disease predisposition or characteristics at diagnosis and clinical outcomes. Finally, we studied how risk and divergent allelic profiles influenced the presentation of HSC immunopeptidome and the TCR repertoire characteristics.
Methods
Study population
We used for this study genotyping information from 263 IAA/PNH patients, 960 healthy subjects, 510 patients with myeloid neoplasia, and 1340 subjects with type 1 diabetes. An additional dataset of HLA genotypes for 37 IAA/PNH patients and 128 healthy controls from a Finnish (University of Helsinki) population was built for validation purposes. All patients gave their informed consent to participate in translational research protocols according to local institutional review boards. All procedures were carried out in accordance with guidelines set forth by the Declaration of Helsinki (see the supplemental Appendix, available on the Blood Web site, for details of patient cohorts).
HED computation
High-quality 4-digit HLA data in patient and control cohorts were used for the phenotypic association study and the risk allele analysis (see the supplemental Appendix).
HED scores were computed for all the subjects and genotypes in the study using the algorithm published by Pierini and Lenz, applying a customized Perl script (https://sourceforge.net/projects/granthamdist/) for the calculation of the amino acid sequence divergence at the antigen binding sites of HLA molecules.7,40 Briefly, starting from a dictionary including all the protein sequences of exons 2 and 3 for class I alleles and exon 2 for class II alleles, assembled from the IPD-IMGT/HLA database v.3.40,44 we calculated HED for 6 class I (A, B, C) and II HLA loci (DRB1, DQB1, DPB1).
Immunopeptidomic analysis
An HSC specific proteomic reference, as published by Henrich et al,45 was used to predict peptides binding to alleles enriched in the BMF cohort. Amino acid sequences based on this reference were selected from the human peptidome reference, downloaded from Ensembl46 (ftp://ftp.ensembl.org/pub/grch37/update/fasta/homo_sapiens/pep//Homo_sapiens.GRCh37.pep.all.fa). The resulting FASTA file was submitted to NetMHCIIpan 4.047 within a high performant computational environment. All peptides with a percentile rank of eluted ligand prediction score <2% for strong binders and <5% for weak binders were retained for the downstream analyses.
Crystallographic structures and molecular dynamics
Crystallographic structures of DR molecules were prepared with the PyMOL (www.pymol.org) program. Homology models of DRB1 molecules were constructed using the software I-TASSER.48,49 The protocol of molecular dynamic simulations was conducted according to a previous study.50 Details of modeling, simulation procedures, and structural motifs used in this study are reported in the supplemental Materials.
TCRβ chain sequencing and analysis
Immunosequencing of the CDR3 regions of human TCRβ chains was performed using the ImmunoSEQ Assay (Adaptive Biotechnologies, Seattle, WA), as previously described.51-53 ImmunoSeq Analizer 3.0 suite was used for sample export and preliminary statistics and quality control steps, while R bioconductor54 environment and Immunarch R55 suite were used for all the downstream analyses. The Immune Epitope Database (IEDB) analysis resources were used to analyze the patterns of crossreactivity and epitope similarities (see the supplemental Appendix).56
Statistical analysis
The statistical framework used for the HLA association study and the clinical correlations is described in the supplemental Appendix. All of the analyses and data visualization were performed using the statistical computing environment R (4.0.0 R Core Team, R Foundation for Statistical Computing, Vienna, Austria) and Excel Microsoft 365. Figures were created with or assembled with BioRender (BioRender.com).
Results
Association analysis and risk allele imputation
Out of a large cohort of adult patients with IAA and hemolytic PNH followed at our institution, 263 patients with completed outcomes and precisely asserted diagnosis had DNA for next-generation sequencing (NGS)-based HLA typing (Table 1; supplemental Table 1; Figure 1). For comparison, we built 2 different control cohorts: (1) 960 healthy subjects (HC) from a prevalently White North American population, and (2) 510 patients with myeloid neoplasms (MN), with known HLA genotypes (see supplemental Methods and the supplemental Appendix). For the analysis of HLA associations, the frequency of each allele was evaluated according to a dominant genetic model (see box of definitions in the supplemental Appendix), assessing the association strength with class assignment.57 Among 8 loci, 9 class I and II alleles were identified as differentially distributed between HC and IAA/PNH cohort (Figure 2A; supplemental Table S2), with 4 alleles significantly enriched in IAA/PNH patients, according to a dominant genetic model: DRB1*15:01 DQB1*06:02, B*07:02, and DQA1*01:02. Analysis of the additive effect confirmed a strong association with the disease phenotype (Figure 2B; supplemental Table 3). The distribution of the significant 4 risk alleles did not differ among IAA and hemolytic PNH groups (supplemental Figure 1A). To determine whether the presence of each IAA risk allele may influence the course of the disease, we performed a logistic regression univariate analysis, which did not reveal any association with malignant progression to MN and/or PNH evolution (supplemental Figure 1B-D). However, the presence of DQB1*06:02 showed lower odds in terms of response to IST (odds ratio [OR]: 0.48 [95% CI 0.26-0.90], P = .028) (supplemental Figure 1B). By comparison, none of the risk alleles in the study were enriched in patients with MN (supplemental Table 4 and supplemental Figure 1E). Of note is that those 4 alleles together with A*03:01 and C*07:02 belonged to the ancestral haplotype 7.1,58 which was equally distributed across patient and control groups (4% vs 5%, respectively, P = .753). Carriers of ≥1 risk allele were enriched in the IAA vs HC with 55% of the cases harboring ≥1 risk allele (vs 39% in HC, OR: 1.94 [95% CI 1.47-2.55], P < .0001) (Figure 2B). Furthermore, DRB1*15:01 was associated with DQB1*06:02 in 84% of cases (patients and HC) as a result of the strong linkage disequilibrium. The frequency of homozygous for class II risk alleles in IAA group was higher than in HC, underscoring the role of the “allelic dose” in disease predisposition (Figure 2C). Risk allele associations, assessed with binomial regression models, were stronger when considering subgroups of patients with increased autoimmune propensity, including (1) responders to immunosuppression, (2) age >20 years, (3) IAA with PNH clone, (4) all of the above characteristics (Figure 2D; supplemental Table 5).
Patient characteristics at diagnosis
| Category | n (%)/median (IQR) |
|---|---|
| All | 263 |
| Age, y | 44 (27-62) |
| Ethnicity | |
| White | 214 (84) |
| African American | 22 (8) |
| Asian | 9 (4) |
| Hispanic or Latino | 7 (3) |
| Other | 2 (2) |
| Unknown | 9 (3) |
| Sex | |
| Female | 132 (50.2) |
| Male | 131 (49.8) |
| Disease phenotype | |
| IAA +/– nonhemolytic PNH clone | 216 (82) |
| IAA + hemolytic PNH clone | 13 (5) |
| Primary hemolytic PNH | 34 (13) |
| PNH granulocytic clone size | 5.6 (1-37.2) |
| Severity IAA | |
| Severe | 166 (71) |
| Moderate | 66 (28) |
| Treatment characteristics | |
| First-line treatment (except allo-HCT)* | |
| ATG/CSA | 129 (53) |
| ATG/CSA/eltrombopag | 14 (6) |
| CSA | 22 (9) |
| CSA/eltrombopag | 8 (3) |
| CSA/other | 5 (2) |
| Androgens | 10 (4) |
| Anticomplement | 26 (11) |
| Eltrombopag | 3 (1) |
| None | 14 (6) |
| Other | 11 (5) |
| Allo-HCT (all lines) | 46 (17) |
| N° lines* | |
| 0 | 17 (8) |
| 1 | 17 (8) |
| 2 | 53 (25) |
| 3 | 26 (13) |
| 4 | 13 (6) |
| ≥5 | 3 (14) |
Data reported for the Cleveland Clinic cohort only.
Allo-HTC, allogeneic hematopoietic stem cell transplant; ATG, antithymocyte globuline; IQR, interquartile range.
Missing data.
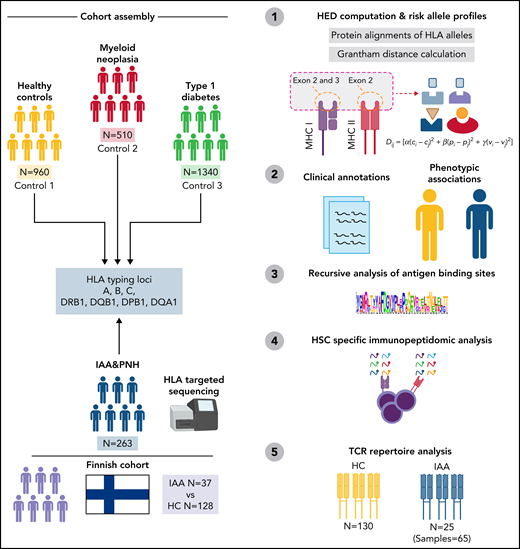
Study design. Sketch describing the design and the principal steps of the study.
Study design. Sketch describing the design and the principal steps of the study.
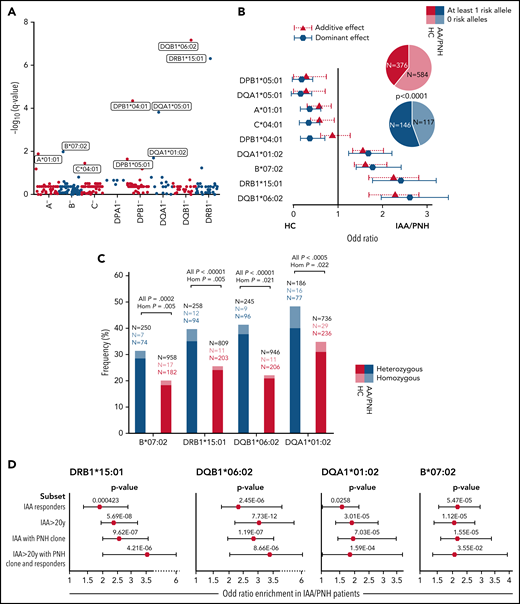
Risk allele profile analysis in idiopathic IAA and PNH patients. (A) Scatterplot representing the negative log10 of the adjusted P values (q value, Benjamini-Hochberg correction) resulting from the allele association analysis (see supplemental Methods). Alleles with significantly different genotypic distributions are labeled according to a dominant genetic model. (B) Forest plot reporting the OR defining the estimated effect size of alleles enriched in HC (protective) or in patients (risk). Blue markers describe OR resulting from the analysis of genotypic frequencies (dominant model); red triangles depict the OR deriving from analysis of allelic frequencies (additive model). The pie charts illustrate the distributions of subjects with ≥1 risk allele (darkest colors) or without any risk allele (brighter colors). (C) Barplot depicting the distribution of heterozygous (darkest) and homozygous (brightest) for the 4 risk alleles in controls and patients. Black numbers indicate the total of patients genotyped for the given locus. Colored numbers indicate the number of patients (blue) and controls (red) carriers of the risk alleles in heterozygous (darkest) or homozygous (brightest) configurations. A 2-sided Fisher test is applied to test the significance of associations with phenotype. (D) Forest plots showing the results of the binomial logistic regression analysis predicting the likelihood of each risk allele association with an IAA “immune-enriched” phenotype. HC cohort (n = 960) was used as a comparator group. All (n = 263); IAA responders (n = 141); IAA >20 years (n = 216); IAA with PNH clones (n = 135); IAA >20 years with PNH clone and responders (n = 59).
Risk allele profile analysis in idiopathic IAA and PNH patients. (A) Scatterplot representing the negative log10 of the adjusted P values (q value, Benjamini-Hochberg correction) resulting from the allele association analysis (see supplemental Methods). Alleles with significantly different genotypic distributions are labeled according to a dominant genetic model. (B) Forest plot reporting the OR defining the estimated effect size of alleles enriched in HC (protective) or in patients (risk). Blue markers describe OR resulting from the analysis of genotypic frequencies (dominant model); red triangles depict the OR deriving from analysis of allelic frequencies (additive model). The pie charts illustrate the distributions of subjects with ≥1 risk allele (darkest colors) or without any risk allele (brighter colors). (C) Barplot depicting the distribution of heterozygous (darkest) and homozygous (brightest) for the 4 risk alleles in controls and patients. Black numbers indicate the total of patients genotyped for the given locus. Colored numbers indicate the number of patients (blue) and controls (red) carriers of the risk alleles in heterozygous (darkest) or homozygous (brightest) configurations. A 2-sided Fisher test is applied to test the significance of associations with phenotype. (D) Forest plots showing the results of the binomial logistic regression analysis predicting the likelihood of each risk allele association with an IAA “immune-enriched” phenotype. HC cohort (n = 960) was used as a comparator group. All (n = 263); IAA responders (n = 141); IAA >20 years (n = 216); IAA with PNH clones (n = 135); IAA >20 years with PNH clone and responders (n = 59).
Outcome description
| Category | n (%)/median (IQR)/ probability (95% CI) |
|---|---|
| Response to IST*(first line) | |
| CR/PR | 141 (69) |
| NR | 62 (30) |
| Secondary PNH from IAA | 28 (10) |
| Time to secondary PNH, mo | 42.2 (23.4-80.4) |
| CIF of secondary PNH at 10 y | 12.3 (7.8-17.8) |
| Progression to AML/MDS | 32 (12) |
| CIF of progression to AML/MDS at 10 y | 14 (10.5-19.6) |
| Time to progression AML/MDS, mo | 44.6 (24.3-77.8) |
| Follow up, mo | 85 (40-15.3) |
Data reported for the Cleveland Clinic cohort only.
AML, acute myeloid leukemia; CI, confidence interval; CIF, cumulative incidence function; CR, complete response; IQR, interquartile range; IST, immunosuppressive treatment; MDS, myelodysplastic syndrome; NR, no response; PR, partial response.
Missing data.
Low class II HLA divergence as an immunogenetic determinant in IAA patients
We applied the HED concept to explore the immunogenetic configuration of IAA and PNH patients, taking into account the risk allele background and computing HED metrics for all classical I and II loci (A, B, C, DRB1, DQB1, DPB1). Based on the previously validated locus-specific HED metrics, for class II divergence computation, we accounted for β-chains only because of the greater variability of α-chains in terms of peptide-binding sites.40 Genotypic differences did not impact the class-related homozygosity configurations of the 3 cohorts, with subjects with ≥1 homozygous locus per class being equally distributed in the groups (supplemental Figure 2A,B). When we investigated the organization of global class I and II HED (mean of HED scores for each class) in patients and control groups, no differences were observed for class I (IAA vs HC, P = .411 or IAA vs MN, P = .189) (supplemental Figure 2C). Conversely, a lower mean class II HED was found in IAA/PNH cohort vs HC (P = .033) (supplemental Figure 2D), involving specifically DRB1 (adj P = .028) and DQB1 (adj P = .028) loci (supplemental Figure 2E-F). Associations with lower class II and locus-specific divergence were more evident when we applied generalized linear regression models to predict the risk of immune-enriched disease phenotypes (Figure 3A; supplemental Table 6). This pattern was also confirmed when considering only White subjects (supplemental Appendix; supplemental Table 7). No differences compared with controls were found when analyzing mean class I and class II HED metrics in MN cohort (of note is that MN were characterized by a higher HED in locus B compared with HC) (supplemental Figure 2C-D).

Binomial logistic regression analysis predicting the association between class II HED scores and IAA phenotypes. (A) Forest plots showing the results of the binomial logistic regression analysis predicting the likelihood for class II and locus-specific HED scores of being associated with an IAA “immune-enriched” phenotype. All (n = 263); IAA responders (n = 141); IAA >20 years (n = 216); IAA with PNH clones (n = 135); IAA >20 years with PNH clone and responders (n = 59). (B) Multivariable logistic regression analysis testing the independent effect of HED and risk alleles on idiopathic BMF phenotype. The length of the bars indicates the OR; the error bars show the 95% CI, the numbers on the bars depict the P values resulting from the likelihood ratio test. Two distinct models are built for DRB1 and DQB1 locus. (C) Violin plots representing the mean class II HED distribution across healthy controls and IAA patients not carrying DRB1*15:01. Wilcoxon signed-rank test was used to calculate the P value. (D) Violin plots representing the DRB1 HED distribution across HCs and IAA patients not carrying DRB1*15:01. Wilcoxon signed-rank test was used to calculate the P value. (E) Violin plots representing the mean class II HED distribution across HCs and IAA patients not carrying DQB1*06:02. Wilcoxon signed-rank test was used to calculate the P value. (F) Violin plots representing the DQB1 HED distribution across HCs and IAA patients not carrying DQB1*06:02. Wilcoxon signed-rank test was used to calculate the P value. Comment on Figure 3C-F: Here, our intention was to clarify whether the pattern of lower class II HED seen in IAA/PNH patients was related only to the enrichment in certain risk alleles (such as DRB1*15:01 or DQB1*06:02) or could instead uncover a broader immunogenetic aspect encompassing risk allele profiles. We therefore analyzed HED class II configurations in patients vs controls not carrying those risk alleles and showed that their scores were lower than controls, as a result of higher structural similarity between 2 DRB1 and DQB1 alleles in patients, regardless of the presence of risk genotypes.
Binomial logistic regression analysis predicting the association between class II HED scores and IAA phenotypes. (A) Forest plots showing the results of the binomial logistic regression analysis predicting the likelihood for class II and locus-specific HED scores of being associated with an IAA “immune-enriched” phenotype. All (n = 263); IAA responders (n = 141); IAA >20 years (n = 216); IAA with PNH clones (n = 135); IAA >20 years with PNH clone and responders (n = 59). (B) Multivariable logistic regression analysis testing the independent effect of HED and risk alleles on idiopathic BMF phenotype. The length of the bars indicates the OR; the error bars show the 95% CI, the numbers on the bars depict the P values resulting from the likelihood ratio test. Two distinct models are built for DRB1 and DQB1 locus. (C) Violin plots representing the mean class II HED distribution across healthy controls and IAA patients not carrying DRB1*15:01. Wilcoxon signed-rank test was used to calculate the P value. (D) Violin plots representing the DRB1 HED distribution across HCs and IAA patients not carrying DRB1*15:01. Wilcoxon signed-rank test was used to calculate the P value. (E) Violin plots representing the mean class II HED distribution across HCs and IAA patients not carrying DQB1*06:02. Wilcoxon signed-rank test was used to calculate the P value. (F) Violin plots representing the DQB1 HED distribution across HCs and IAA patients not carrying DQB1*06:02. Wilcoxon signed-rank test was used to calculate the P value. Comment on Figure 3C-F: Here, our intention was to clarify whether the pattern of lower class II HED seen in IAA/PNH patients was related only to the enrichment in certain risk alleles (such as DRB1*15:01 or DQB1*06:02) or could instead uncover a broader immunogenetic aspect encompassing risk allele profiles. We therefore analyzed HED class II configurations in patients vs controls not carrying those risk alleles and showed that their scores were lower than controls, as a result of higher structural similarity between 2 DRB1 and DQB1 alleles in patients, regardless of the presence of risk genotypes.
When the additive effect of the presence of risk alleles on class II HED configurations was analyzed, we observed that lower locus-specific HED was independently associated with IAA/PNH phenotype (Figure 3B). Interestingly, HC carrying DRB1*15:01 had lower class II and locus-specific HED compared with noncarriers (supplemental Figure 3A-B), whereas in IAA, both class II and DRB1 divergences were globally reduced either in presence or in absence of this risk allele (supplemental Figure 3C-D). Nevertheless, patients without DRB1*15:01 had a significantly lower mean class II (P = .0005) and DRB1 HED (P < .0001) compared with HC (Figure 3C-D). A similar pattern was seen in DQB1 HED among noncarriers of DQB1*06:02 (Figure 3D-F). When for comparison purposes we examined another autoimmune disease cohort (type 1 diabetes [T1D]), we also found a lower divergence in class II loci (P = .00058) and in DRB1 locus compared with HC (P = .00104) (supplemental Table 7; supplemental Figure 4A-C). Binomial regression analysis confirmed lower HED in DRB1 locus as a predictor of T1D (OR: 0.97 [95% CI 0.95-0.99], P = .00235) (supplemental Figure 4D). Indeed, it is noteworthy the established role of DRB1*15:01 as a protective allele in T1D (supplemental Figure 4D), as well as the different risk allele profile dominated by DRB1*03:01 and DRB1*04:01.59-61
To identify alleles structurally similar to those identified as risk alleles in class II, we simulated the range of HED scores between DRB1*15:01/DQB1*06:02 and the pool of alleles present in DRB1 and DQB1 loci in IAA/PNH patients and HC (Figure 4A-C). In DRB1 locus, a lower divergence with DRB1*15:01 was obtained for alleles within DRB1*15, DRB1*16, DRB1*04, and DRB1*01 supertypes (Figure 4A; supplemental Table 8). Combined genotypic frequencies of those DRB1*15:01-like alleles were higher in IAA/PNH population (OR: 1.89 [95% CI 1.38-2.61], P = 7.22e-05) and in cases with immune-related phenotypes compared with HC (Figure 4B). Analogous results were observed for DQB1 locus and DQB1*06 supertypes (Figure 4C-D; supplemental Table 9).
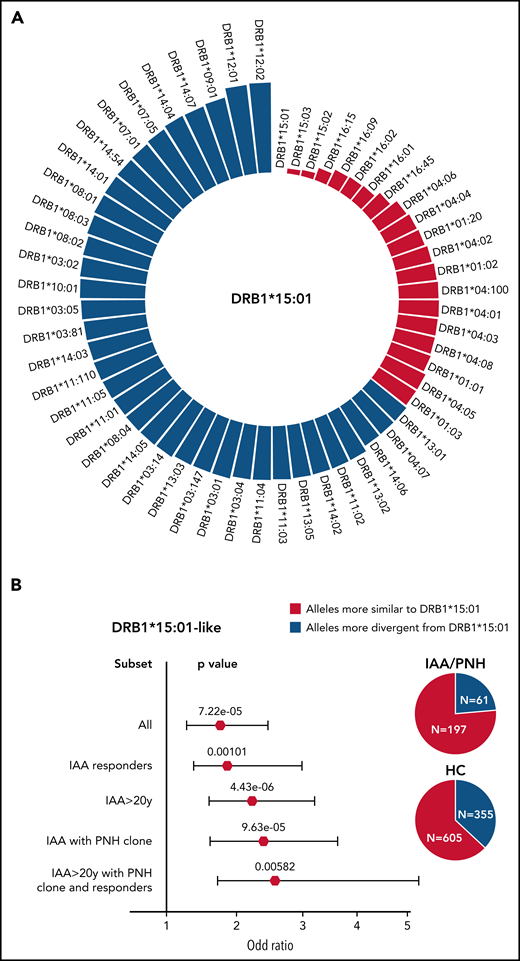
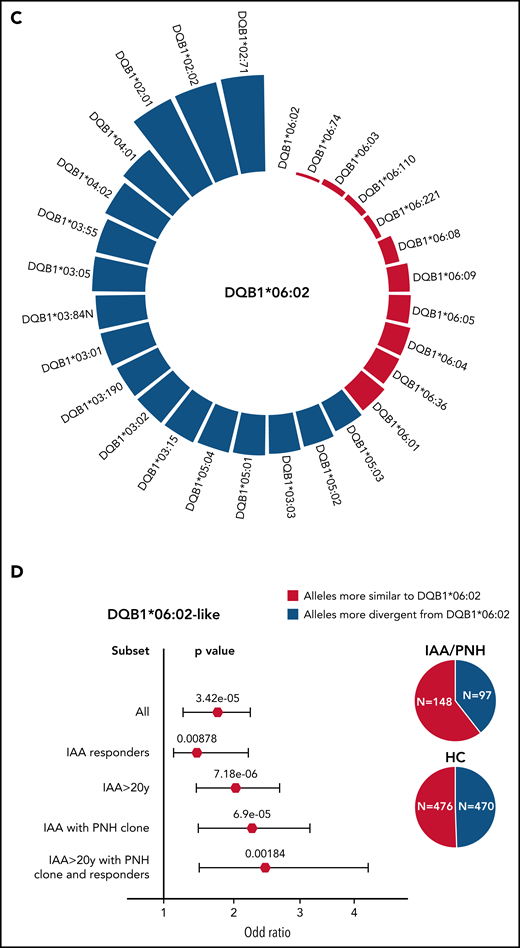
Simulated structural divergence between each class II risk allele and the pool of alleles present in DRB1 and DQB1 loci in patients and controls. (A) Circle graph representing the simulated divergences between DRB1*15:01 and each allele present in DRB1 locus of IAA/PNH patients and HC. Red bars illustrate the alleles more similar to DRB1*15:01 (divergent pairs located under the twenty-fifth percentile cutoff of the simulated distribution). (B) Forest plots showing the results of the binomial logistic regression analysis predicting the association between the presence of DRB1*15:01-like alleles and AA “immune-enriched” phenotypes. HCs (n = 960) were used as a comparator group. Pie charts describe the distribution of alleles more similar and more divergent from DRB1*15:01 in patients and controls. All (n = 263); IAA responders (n = 140); IAA >20 years (n = 216); IAA with PNH clones (n = 135); IAA >20 years with PNH clone and responders (n = 59). (C) Circle graph representing the simulated divergences between DQB1*06:02 and each allele present in DQB1 locus of IAA/PNH patients and HC. Red bars illustrate the alleles more similar to DQB1*06:02 (divergent pairs located under the twenty-fifth percentile cutoff of the simulated distribution). (D) Forest plots showing the results of the binomial logistic regression analysis predicting the association between the presence of DQB1*06:02-like alleles and an IAA “immune-enriched” phenotype. HCs (n = 960) were used as a comparator group. Pie charts describe the distribution of alleles more similar and more divergent from DQB1*06:02 in patients and controls.
Simulated structural divergence between each class II risk allele and the pool of alleles present in DRB1 and DQB1 loci in patients and controls. (A) Circle graph representing the simulated divergences between DRB1*15:01 and each allele present in DRB1 locus of IAA/PNH patients and HC. Red bars illustrate the alleles more similar to DRB1*15:01 (divergent pairs located under the twenty-fifth percentile cutoff of the simulated distribution). (B) Forest plots showing the results of the binomial logistic regression analysis predicting the association between the presence of DRB1*15:01-like alleles and AA “immune-enriched” phenotypes. HCs (n = 960) were used as a comparator group. Pie charts describe the distribution of alleles more similar and more divergent from DRB1*15:01 in patients and controls. All (n = 263); IAA responders (n = 140); IAA >20 years (n = 216); IAA with PNH clones (n = 135); IAA >20 years with PNH clone and responders (n = 59). (C) Circle graph representing the simulated divergences between DQB1*06:02 and each allele present in DQB1 locus of IAA/PNH patients and HC. Red bars illustrate the alleles more similar to DQB1*06:02 (divergent pairs located under the twenty-fifth percentile cutoff of the simulated distribution). (D) Forest plots showing the results of the binomial logistic regression analysis predicting the association between the presence of DQB1*06:02-like alleles and an IAA “immune-enriched” phenotype. HCs (n = 960) were used as a comparator group. Pie charts describe the distribution of alleles more similar and more divergent from DQB1*06:02 in patients and controls.
When we studied whether HLA functional divergence may influence characteristics and outcomes of IAA/PNH patients (Table 2), we found that class II HED scores correlated directly with the size of PNH clone at diagnosis (P = .00286, r2 = 0.036) (supplemental Figure 5A-B) and indirectly with age at disease onset (P = .0013, r2 = 0.021) (supplemental Figure 5C-D). Univariable cox regression models (based on binomial categorization of mean class I and II HED according to the fiftieth percentile in HC) (supplemental Figure 5E-K) demonstrated a lower probability of survival (P = .011), higher risk of progression to MDS/AML (P = .043), and a lower probability of PNH evolution (P = .0004) (supplemental Figure 5H,J,L) in patients with lower mean class II HED, while no impact was seen for class I HED (supplemental Figure 5G,I,K).
Recursive analysis of the antigen-binding site in DRB1 and DQB1 loci
To investigate whether low divergent patterns could rely on a specific amino acid composition of the peptide-binding site of class II HLA molecules, we analyzed the amino acid structure in the antigen-binding site (encoded by exon 2) of DRB1 and DQB1 loci. In DRB1 peptide-binding groove, 30 out of 89 amino acid positions were variable. By applying a recursive approach, we found 7 amino acids strongly correlated with the IAA/PNH phenotype (Figure 5A-B; supplemental Table 10), enriched in the DRB1*15 group and in all the alleles structurally similar to this supertype. Of note is that most of those residues were nonpolar, possibly affecting the physicochemical configuration of the antigen-binding site of DRB1*15-like complexes. When the same analysis was performed on DQB1 locus (supplemental Figure 6A-B; supplemental Table 11), the majority of variable amino acids in exon 2 were enriched in HC, with the exception of 2 residues of phenylalanine (Phe/F), both belonging to the DQB1*06 supertype and significantly overrepresented in IAA (supplemental Figure 6A-B). Interestingly, none of the antigen-binding sites extrapolated from classical class l loci presented specific amino acid signatures enriched in the IAA/PNH cohort (supplemental Table 12).
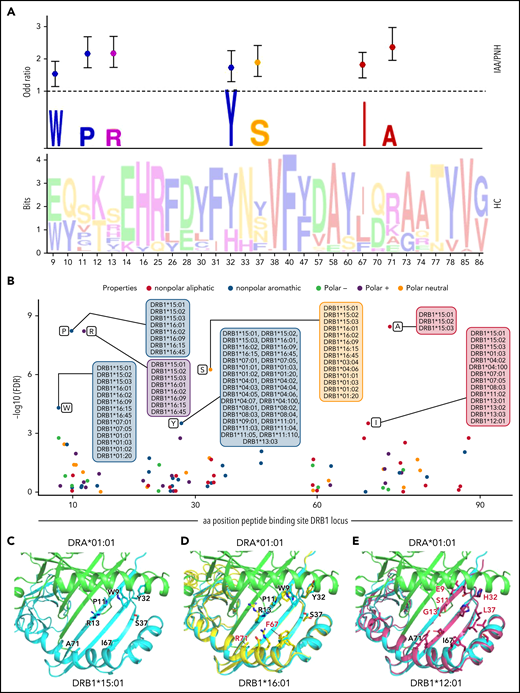
Recursive analysis of the amino acid sequence within the peptide-binding site of DRB1 locus. (A) Lower panel: WebLogo visualization representing the contribution of single amino acids within the variable portion of the peptide-binding site of DRB1 locus. The x-axis indicates each variable position (as per IPD-IMGT-HLA reference). Letters represent each possible amino acid at each given position. Letter height illustrates the frequency of each amino acid in a healthy control population. Colors indicate the chemico-physical properties as per legend in panel B. Upper panel: stylized visualization of amino acids differentially distributed between HC and IAA/PNH cohorts. Letter height illustrates the frequency of each amino acid in the disease population. Markers indicate the OR resulting from the logistic regression analysis studying each amino acidic contribution in determining the phenotype (see supplemental Methods and supplemental Table 10). (B) Scatterplot showing the significance level of each variable amino acid in the peptide-binding site of DRB1 locus found enriched in IAA/PNH population compared with HC. Each dot represents the negative log10 for the adjusted P value (q value) referring to each amino acid. The position on the x-axis indicates the position within the peptide-binding site according to IPD-IMGT-HLA reference. Only the amino acids presenting a q value <10-e4 are considered significant for this analysis and labeled in the figure. Alleles presenting the indicated amino acid at the given position are indicated in the boxes. Colors represent the chemico-physical properties as per legend. (C) Crystallographic structure showing the position of the 7 amino acids significantly enriched in the peptide-binding groove of DR molecules of IAA/PNH patients. This 3D structure has been visualized with the PyMOL program based on the structure of DRB1*15:01-DRA*01:01-myelin binding protein (PDB:1BX2) and HLA sequences retrieved from IPD-IMGT/HLA database v.3.40. Only the 7 amino acids identified in the previous analysis have been highlighted. (D) Binding site of DRB1*16:01-DRA*01:01 based on the homology model of DRB1*16:01. The structure of DRB1*16:01 has been superimposed to DRB1*15:01. Residues differing from the risk pattern seen in DRB1*15:01 are colored in red. (E) Binding site of DRB1*12:01-DRA*01:01 based on the homology model of DRB1*12:01. The structure of DRB1*12:01 has been superimposed to the structure of DRB1*15:01. Residues differing from the risk pattern seen in DRB1*15:01 are colored in red. aa, amino acid; HC, healthy control.
Recursive analysis of the amino acid sequence within the peptide-binding site of DRB1 locus. (A) Lower panel: WebLogo visualization representing the contribution of single amino acids within the variable portion of the peptide-binding site of DRB1 locus. The x-axis indicates each variable position (as per IPD-IMGT-HLA reference). Letters represent each possible amino acid at each given position. Letter height illustrates the frequency of each amino acid in a healthy control population. Colors indicate the chemico-physical properties as per legend in panel B. Upper panel: stylized visualization of amino acids differentially distributed between HC and IAA/PNH cohorts. Letter height illustrates the frequency of each amino acid in the disease population. Markers indicate the OR resulting from the logistic regression analysis studying each amino acidic contribution in determining the phenotype (see supplemental Methods and supplemental Table 10). (B) Scatterplot showing the significance level of each variable amino acid in the peptide-binding site of DRB1 locus found enriched in IAA/PNH population compared with HC. Each dot represents the negative log10 for the adjusted P value (q value) referring to each amino acid. The position on the x-axis indicates the position within the peptide-binding site according to IPD-IMGT-HLA reference. Only the amino acids presenting a q value <10-e4 are considered significant for this analysis and labeled in the figure. Alleles presenting the indicated amino acid at the given position are indicated in the boxes. Colors represent the chemico-physical properties as per legend. (C) Crystallographic structure showing the position of the 7 amino acids significantly enriched in the peptide-binding groove of DR molecules of IAA/PNH patients. This 3D structure has been visualized with the PyMOL program based on the structure of DRB1*15:01-DRA*01:01-myelin binding protein (PDB:1BX2) and HLA sequences retrieved from IPD-IMGT/HLA database v.3.40. Only the 7 amino acids identified in the previous analysis have been highlighted. (D) Binding site of DRB1*16:01-DRA*01:01 based on the homology model of DRB1*16:01. The structure of DRB1*16:01 has been superimposed to DRB1*15:01. Residues differing from the risk pattern seen in DRB1*15:01 are colored in red. (E) Binding site of DRB1*12:01-DRA*01:01 based on the homology model of DRB1*12:01. The structure of DRB1*12:01 has been superimposed to the structure of DRB1*15:01. Residues differing from the risk pattern seen in DRB1*15:01 are colored in red. aa, amino acid; HC, healthy control.
Because of this lower contribution of DQB1 and class I binding sites variability in conferring disease phenotype, our next analysis was focused on modeling antigen interactions within DRB1 locus. When we analyzed the crystallographic structure of the complex DRB1*15:01/DRA*01:01 (PDB: 1BX2), the identified amino acids were clustered within the right part of the antigen-binding pocket (Figure 5C). Only 2 of 7 amino acids were different in DRB1*16:01 (indicating higher structural similarity to DRB1*15:01) (Figure 5D), while 5 out of 7 residues differed in DRB1*12:01 (more structurally divergent from DRB1*15:01) (Figure 5E). We also aligned the crystal structures of DRB1*15:01/DRA*01:01 with 3 peptides known to have an affinity for DRB1 molecules (EBV DNA polymerase, vimentin, and myelin binding protein [MBP]) (supplemental Methods) and found 2 different patterns of interaction within the binding groove: while the peptide portions binding in the left part of the groove tended to assume the same backbone conformation (underlying conservation of the physicochemical characteristics among the structures at this interface), peptide portions allocated within the right side of the HLA groove assumed more variable conformations (Figure 6A). To investigate how this structural configuration could affect the TCR binding, we then constructed a model structure of TCR α and β chains, DRA*01:01-DRB1*15:01 and CD4 on the reported ternary crystal structure of HLA-peptide-TCR-CD4 (PDB: 3T0E).63 Based on the alignment of these 3 antigenic models, we found that the variable peptide segments (right portion) interacted mainly with the TCR Vβ chain (Figure 6B-C). These findings provided a proof-of-concept for the importance of this consensus structure in accommodating the interactions with antigen and T-cell specificities within DRB1 locus.
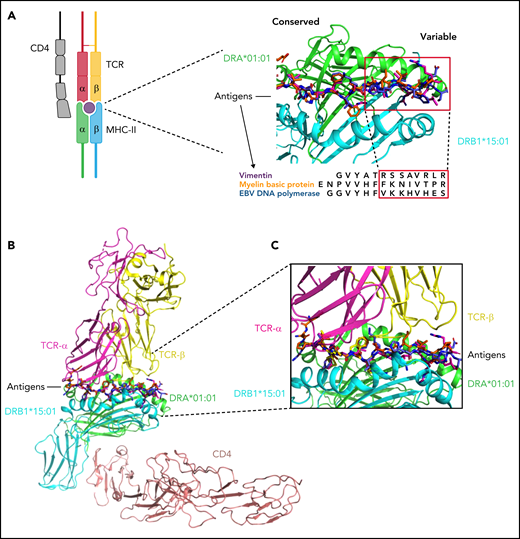
Structural insight into DRB1-antigen-TCR interactions. (A) Peptides of vimentin (UniProt: P08670, VIME_HUMAN, 59-71), EBV DNA polymerase (UniProt: P03198, DPOL_EBVB9, 628-641), MBP (UniProt: P02686, MBP_HUMAN, 217-231) at the HLA binding site based on the alignment of crystal structures of DRB1*15:01-DRA*01:01/MBP (217-231) (PDB: 1BX2), DRB1*14:02-DRA*01:01/vimentin (amino acid positions: 59-71, PDB:1H15), and DRB5*01:01-DRA*01:01/EBV DNA polymerase (628-641) (PDB:6ATF). The red squares indicate the peptide portions presenting with more conformational variability (in interaction with the right site of the HLA binding groove). This 3D structure has been prepared with PyMOL using the crystal structure of DRB1*15:01-DRA*01:01/MBP (PDB: 1BX2). (B) Modeled ternary structure of HLA-Antigen-TCR-CD4. (C) Detail of the interaction interface in HLA-antigen-TCR. The 3 antigenic structures are aligned as shown above. The risk amino acid pattern within the right side of the binding groove interacts with a more variable antigenic portion that contacts directly with the TCR β chain (software PyMOL). EBV, Epstein-Barr virus; MHC, major histocompatibility complex.
Structural insight into DRB1-antigen-TCR interactions. (A) Peptides of vimentin (UniProt: P08670, VIME_HUMAN, 59-71), EBV DNA polymerase (UniProt: P03198, DPOL_EBVB9, 628-641), MBP (UniProt: P02686, MBP_HUMAN, 217-231) at the HLA binding site based on the alignment of crystal structures of DRB1*15:01-DRA*01:01/MBP (217-231) (PDB: 1BX2), DRB1*14:02-DRA*01:01/vimentin (amino acid positions: 59-71, PDB:1H15), and DRB5*01:01-DRA*01:01/EBV DNA polymerase (628-641) (PDB:6ATF). The red squares indicate the peptide portions presenting with more conformational variability (in interaction with the right site of the HLA binding groove). This 3D structure has been prepared with PyMOL using the crystal structure of DRB1*15:01-DRA*01:01/MBP (PDB: 1BX2). (B) Modeled ternary structure of HLA-Antigen-TCR-CD4. (C) Detail of the interaction interface in HLA-antigen-TCR. The 3 antigenic structures are aligned as shown above. The risk amino acid pattern within the right side of the binding groove interacts with a more variable antigenic portion that contacts directly with the TCR β chain (software PyMOL). EBV, Epstein-Barr virus; MHC, major histocompatibility complex.
Quantitative thresholds for self-antigenic presentation
To explore the binding capacity of self-generated peptides possibly involved in IAA pathogenesis, we built an in silico HSC-specific proteomic reference, and we analyzed all the different DRB1 and DQB1 molecules present in IAA and HC cohorts. We generated 15-mer peptides from 40 614 transcripts assembled from 7724 previously identified HSC proteins.45 For each sequence, the mean number of strong and weak binders (see supplemental Methods) was determined across all the DRB1 alleles, along with their gene source (supplemental Table 13). Overall, about 10% of this proteomic reference was found capable of generating self-peptides suitable for the binding of DRB1 or DQB1 molecules (all peptides with a percentile rank of eluted ligand prediction score <5%, corresponding to strong and weak binders, were considered for this analysis) (supplemental Figure 7A-B). HLA molecules belonging to the same locus had a similar origin of derived binders. However, quantitative differences in the number of predicted binders were observed across all the alleles (supplemental Tables 13 and 14). In particular, DRB1*15:01 along with other alleles was identified as structurally similar to the DRB1*15 supertype and was characterized by lower binding capacities compared with other alleles (supplemental Figure 7B-C). Analysis of the distribution of the number of binders in HC and IAA/PNH groups showed significantly lower binding capacities in DRB1 locus in patients vs controls (supplemental Figure 7D). This pattern was also observed in the subgroup of homozygous individuals (HED score 0) (supplemental Figure 7E). For DQB1 locus immune-peptidomic analysis, we accounted for the genotypic associations with DQA1 locus, and thus we considered only individuals with known DQA1 allele. DQB1*06:02-DQA1*01:02 was predicted as one of the haplotypes with the lowest binding capacities (supplemental Figure 8A-D), and its propensity to bind HSC self-peptides was decreased compared with other DQB1*06:02/DQA1 combinations (supplemental Figure 8B).
To determine whether the findings described above were reproducible across different ethnic groups and populations with unique HLA distributions, we investigated the genotypic and the structural patterns of the DRB1 locus in IAA patients (n = 37, among which n = 30 genotyped at 4-digit level) and healthy controls (n = 128) from a Finnish cohort. Consistent with our results, DRB1*15:01 was significantly associated with BMF phenotype (OR: 5.18; P = .0001) (supplemental Figure 9A-B), and divergence in DRB1 locus was lower for IAA patients compared with controls (this configuration was found both for the whole cohort and for noncarriers of DRB1*15:01) (supplemental Figure 9C-D). Importantly, as for the main cohort, also in the Finnish one, DRB1 allele distribution was characterized by lower binding capacities in patients vs corresponding HC.
Insights in TCR repertoires
To investigate how risk allele profiles and HED configurations may dictate the patterns of T-cell responses, we performed deep TCR Vβ complementary determining region (CDR3) sequencing for 25 patients with IAA through a multiple sampling (supplemental Table 15a). Patients’ Vβ CDR3 spectra were compared with those of 122 HC included in our study (supplemental Table 15b). After a down-sampling procedure (see supplemental Methods), TCR diversity metrics were calculated. As expected, TCR repertoires were characterized by lower diversity compared with HC (IAA vs HC: P = 5.4e-08; number of unique clonotypes: P = .012; mean size clonal expansion: P = .512) (Figure 7A-C) in both DRB1*15:01 carriers and noncarriers (Figure 7D-E). No correlation was found between Vβ TCR diversity metrics and class I or II mean HED (Figure 7F-J). To evaluate how HED could impact the autoreactive disease-associated spectra, we first built a comprehensive compendium of all CDR3 sequences with known specificity identified in literature (see supplemental Methods) and blasted the CDR3 sequences identified in our cohorts against this dictionary. Overall, within the identified clonotypic portion of the repertoire (<2% of the total), the mean proportion of identifiable autoreactive clonotypes was 14% in IAA vs 6% in HC (Figure 7L), while their mean frequency was respectively 0.016% and 0.001% (P < 2e-16) (Figure 7M). In IAA patients, but not in HC, the productive frequency of those clones inversely correlated with mean class II HED (P = 1.332e-19; r2 = 0.041) (Figure 7N), underscoring the clonal expansion of those specificities in patients with lower class II HLA divergence. Almost all of the autoimmunity-associated clonotypic groups were found hyperexpanded in IAA compared with HC (Figure 7O). When analyzing the specificity of potential autoreactive clonotypes toward known epitopes, we were able to identify (at a mean productive frequency comprised between 0.0005% and 0.09%) CDR3 sequences reactive against autoantigens recognized in other autoimmune diseases (supplemental Tables 16 and 17). These sequences were explored for their similarity with pathogen-associated TCRs, and about 16% of them were predicted to be able to bind infectious epitopes (supplemental Table 16). This feature emphasizes the idea that a background of crossreactivity, potentially imprinted by HLA, immunepeptidome and TCR interactions may exist in patients with IAA and potentially explain a generalized mechanism of autoreactivity.
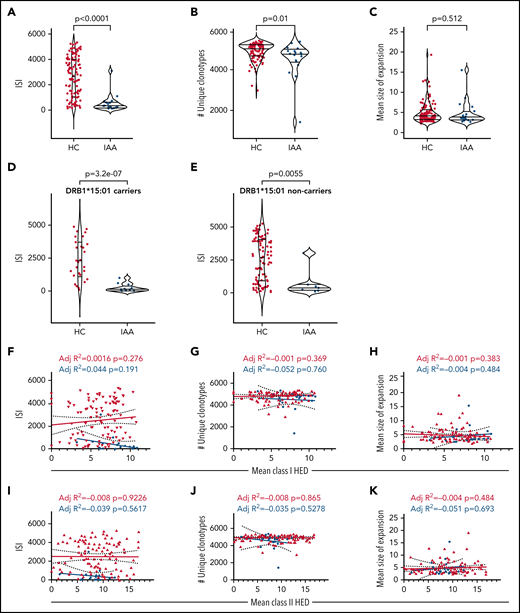

T-cell receptor analysis in IAA patients. (A) ISI distribution in HC and IAA patients (downsampled dataset). Violin plots showing median and interquartile ranges. Wilcoxon signed-rank test. (B) Number of unique clonotypes in HC and IAA patients (downsampled dataset). Violin plots showing median and interquartile ranges. Wilcoxon signed-rank test. (C) Mean size of expansion of each clonotype of size ≥2 templates in HC and IAA patients (down-sampled dataset). Violin plots showing median and interquartile ranges. Wilcoxon signed-rank test. (D) ISI distribution in HC and IAA patients in DRB1*15:01 carriers (downsampled dataset). Violin plots showing median and interquartile ranges. Wilcoxon signed-rank test. (E) ISI distribution in HC and IAA patients in non-DRB1*15:01 carriers (downsampled dataset). Violin plots showing median and interquartile ranges. Wilcoxon signed-rank test. (F) Linear regression analysis between ISI and mean class I HED. (G) Linear regression analysis between the number of unique clonotypes and mean class I HED. (H) Linear regression analysis between the mean size of clonotype expansion and mean class I HED. (I) Linear regression analysis between ISI and mean class II HED. (J) Linear regression analysis between the number of unique clonotypes and mean class II HED. (K) Linear regression analysis between the mean size of clonotype expansion and mean class II HED. r2 goodness-of-fit are reported along with the P value in each box (F-K). (L) Proportion of known complementary determining region 3 (CDR3) specificities in IAA and HC groups (this distribution has been computed in the downsampled dataset). (M) Logarithm of mean frequency of autoreactive clonotypes present in HC and IAA patients. Violin plots showing median and interquartile ranges. Each dot represents the mean frequency/per subject (all the values refer to the nondownsampled dataset in order to capture all the possible recognizable CDR3 sequences). Wilcoxon signed-rank test. (N) Linear regression analysis between frequency of known autoreactive clonotypes in IAA patients and mean class II HED. Each dot represents 1 autoreactive clonotype. Clonotypes with overlapping frequencies are represented by the darkest dots (all the values refer to the nondownsampled dataset). Wilcoxon signed-rank test. R-squared goodness-of-fit are reported along with the P value. (O) Bubble matrix showing the mean frequency of each autoimmune disease-associated clonotype present in the nondownsampled repertoires of IAA and HCs. Each bubble represents the number of clonotypes with known autoimmune specificity (x-axis). The size of each bubble indicates the mean productive frequency (measure of clonal size). Wilcoxon signed-rank test is used to compare the mean frequencies of each specificity between IAA and HC groups. *****P < 10e-6; ****P < 10e-5; P < 10e-4; **P < .001; *P < .01. aa, amino acid; ISI, Inverse Simpson index; ns, nonsignificant.
T-cell receptor analysis in IAA patients. (A) ISI distribution in HC and IAA patients (downsampled dataset). Violin plots showing median and interquartile ranges. Wilcoxon signed-rank test. (B) Number of unique clonotypes in HC and IAA patients (downsampled dataset). Violin plots showing median and interquartile ranges. Wilcoxon signed-rank test. (C) Mean size of expansion of each clonotype of size ≥2 templates in HC and IAA patients (down-sampled dataset). Violin plots showing median and interquartile ranges. Wilcoxon signed-rank test. (D) ISI distribution in HC and IAA patients in DRB1*15:01 carriers (downsampled dataset). Violin plots showing median and interquartile ranges. Wilcoxon signed-rank test. (E) ISI distribution in HC and IAA patients in non-DRB1*15:01 carriers (downsampled dataset). Violin plots showing median and interquartile ranges. Wilcoxon signed-rank test. (F) Linear regression analysis between ISI and mean class I HED. (G) Linear regression analysis between the number of unique clonotypes and mean class I HED. (H) Linear regression analysis between the mean size of clonotype expansion and mean class I HED. (I) Linear regression analysis between ISI and mean class II HED. (J) Linear regression analysis between the number of unique clonotypes and mean class II HED. (K) Linear regression analysis between the mean size of clonotype expansion and mean class II HED. r2 goodness-of-fit are reported along with the P value in each box (F-K). (L) Proportion of known complementary determining region 3 (CDR3) specificities in IAA and HC groups (this distribution has been computed in the downsampled dataset). (M) Logarithm of mean frequency of autoreactive clonotypes present in HC and IAA patients. Violin plots showing median and interquartile ranges. Each dot represents the mean frequency/per subject (all the values refer to the nondownsampled dataset in order to capture all the possible recognizable CDR3 sequences). Wilcoxon signed-rank test. (N) Linear regression analysis between frequency of known autoreactive clonotypes in IAA patients and mean class II HED. Each dot represents 1 autoreactive clonotype. Clonotypes with overlapping frequencies are represented by the darkest dots (all the values refer to the nondownsampled dataset). Wilcoxon signed-rank test. R-squared goodness-of-fit are reported along with the P value. (O) Bubble matrix showing the mean frequency of each autoimmune disease-associated clonotype present in the nondownsampled repertoires of IAA and HCs. Each bubble represents the number of clonotypes with known autoimmune specificity (x-axis). The size of each bubble indicates the mean productive frequency (measure of clonal size). Wilcoxon signed-rank test is used to compare the mean frequencies of each specificity between IAA and HC groups. *****P < 10e-6; ****P < 10e-5; P < 10e-4; **P < .001; *P < .01. aa, amino acid; ISI, Inverse Simpson index; ns, nonsignificant.
Discussion
In IAA, the autoimmune destruction of hematopoietic progenitor and stem cells is an HLA class I- and II-restricted T-cell–mediated process. Here, with a comprehensive immunogenetic approach encompassing deep NGS of HLA region, TCR sequencing, and HSC-specific immunopeptidome binding analysis, we intensively assessed HLA structures involved in disease susceptibility and potentially associated with autoimmune propensity. To that end, we used not only a comparative population of HC but also 2 large disease-control datasets.
The quantitative concept of the HED relies on the divergent allele advantage hypothesis, stipulating that the structural heterogeneity of HLA alleles allows for a wider spectrum of peptides to be presented and thus a higher probability to mount efficient antitumor and anti-infectious responses.39,63-65 Accordingly, a similar principle should apply to autoimmune diseases, with a higher HED reflecting an increased propensity to T-cell–mediated autoimmunity. However, we did not find support for this hypothesis and instead observed that HLA molecules in IAA patients were characterized by a high structural similarity, especially in class II, in part due to enrichment for risk alleles and/or alleles structurally similar to risk alleles. These associations were particularly strong for DRB1 and DQB1 loci. Consistent with previous studies, DRB1*15:01 together with DQB1*06:02 were identified as alleles enriched in IAA and PNH.25,26 A special mention deserves the fact that HED metrics were found to be low, independently of the presence of risk alleles in IAA/PNH setting. This pattern is explained by the global low divergence of class II HLA molecules seen in the BMF cohort. Indeed, in IAA patients the nonrisk alleles were more structurally similar to each other and to the risk alleles and thus may have analogous (albeit not completely overlapping) peptide recognition spectra. This may contribute to decreasing the diversity and increasing the clonal expansion of TCR specificities in IAA repertoire. Further, a lower locus-specific HED was independently associated with disease phenotype when performing generalized linear regression models tracking the additive effect of class II HLA risk alleles. Reinforcing the idea that this pattern may be present across different ethnicities and ancestry groups, we showed reproducibility of such findings in an independent cohort of Finnish IAA/PNH patients. Also, we found the same low HLA divergence pattern in an autoimmune disease characterized by different risk allele associations and in which, of note, DRB1*15:01 is a protective factor.59
Since our genetic models were built on a mixed population and did not allow the confirmation of the class I risk alleles previously identified in a prevalently pediatric White cohort,2 we also performed an ethnicity-stratified subanalysis. Hence, among alleles formerly recognized, we could show only a slightly significant enrichment in B*14:02 in White patients from the North American cohort, and again confirmed the strong association with the class II alleles identified in the main analysis, as well as the low divergence characterizing class II loci. It is possible that the above dissimilarities with the previously reported class I associations2 rely on the different age composition of our study cohort, prevalently composed of adult patients (see supplemental Considerations).
In order to deeper analyze the superstructures involved in the decreased divergence within the antigen-binding sites, we studied the amino acid specificities found in the variable portion of the antigenic groove of DRB1 and DQB1 molecules with a recursive approach. This analysis enabled the identification of a few residues significantly associated with IAA/PNH phenotype, mainly located in pockets involved in antigen and TCR β interactions. By modeling analogous antigens known to be binders of DRB*15:01 and alleles with structural similarity, this analysis allowed us to identify antigen components involved in the preferential self-presentation of BMF patients, potentially associated with impaired T-cell activation.
Consistent with the lower divergence seen in IAA/PNH population, when we analyzed DRB1 and DQB1 binding predictions covering the HSC-specific immunopeptidome, we found that for both loci, HLA genotypes had lower binding capacities in patients compared with healthy individuals, both in homozygous and heterozygous settings. If per divergent allele advantage, immunocompetence is supposed to be enhanced in case of higher HLA divergence, it is plausible that less divergent loci and, per extension, HLA molecules with lower binding capacities (such as DRB1*15:01 and DQB1*06:02-DQA1*01:02) may increase the risk of immunological crossreactivity and molecular mimicry with possible pathogen-associated antigens, triggering autoimmune diseases. As an example of autoimmune disorder with known self-antigenic specificities, in multiple sclerosis, the link among DRB1*15:01, EBV, and central nervous system antigens molecular mimicry is well established, with indirect evidence that impaired CD4+ presentation may elicit aberrant CD8+ responses and autoantibody production.66-69 It is also noteworthy to mention recent data on private clonotypic responses of IAA patients demonstrating the presence of a cluster of converging CDR3 sequences which were potentially epitope-specific but not predicted to be enriched for viral specificities responses.70,71 We attempted to predict crossreactivity across the autoimmune repertoire of the IAA samples using an approach of TCR matching based on homologies among CDR3 sequences. This particular analysis helped in identifying similarities between autoreactive clonotypes and TCR known to recognize pathogen-associated epitopes, underscoring the concrete possibility of crossreactivity. The possible production of autoantibody also seems to fit with the idea that certain self-epitopes of targeted gene products may be presented by DRB1*15:01 and DQB1*06:02 and associated structures.
If risk allele profiles did not impact clinical outcomes, low divergence in class II was associated with an increased probability of malignant progression in IAA/PNH patients. This finding is in line with the idea that antitumor surveillance (previously shown as more efficient in highly divergent class I allele pairs)39 could also encompass HLA class II-restricted T-cell responses.72-74 In this setting, less divergent class II β chains may reduce the neoantigen presentation capabilities configuring an immune escape scenario.
The in silico nature of some of our explorations may represent a drawback of our study. However, immunopeptidomic studies for BMF are far from being straightforward because of the limited number of residual HSCs precluding direct application of proteomic tools for the study of potential antigenic structures.
Despite these limitations, our data demonstrate that in BMF and potentially in other autoimmune disorders, HLA allele configurations with more specific structural patterns and globally lower functional divergence may contribute to decreasing the binding capabilities, especially in class II alleles, potentially enhancing antigenic crossreactivity and, hence, autoimmune propensity.
Analysis of HLA divergence and identification of DRB1 superstructure may be easily translated in clinical practice for better diagnostic and prognostic orientations paving the way for new therapeutical approaches potentially able to modulate the self-antigenic binding capabilities of class II HLA molecules.
Acknowledgments
The authors thank Diego Chowell for his helpful insights and critical revision of the manuscript. The authors also thank the National Institute of Diabetes and Digestive and Kidney Diseases and the Type 1 Diabetes Genetic Consortium that provided the T1DGC Immunochip/HLA Reference Panel used in this study, and John Sidney and Alessandro Sette, who kindly provided the ethnicity information for the subjects from the San Diego population.
This work was supported by National Institutes of Health, National Heart, Lung, and Blood Institute grants R35 HL135795, R01HL123904, R01 380HL118281, R01 HL128425, R01 HL132071, Edward P. Evans Foundation (J.M.), Italian Society of Hematology, Fondation ARC pour la Recherche sur le Cancer, Philippe Foundation, Association HPN France-Aplasie Medullaire/Foundation for Rare Diseases (FFRD) (S.P.), the American-Italian Cancer Foundation (C.G.), VeloSano Pilot Award, and Vera and Joseph Dresner Foundation-MDS (V.V.). European Research Council (M-IMM and STRATIFY projects), Academy of Finland, Sigrid Juselius Foundation, and Cancer Foundation Finland (S.L.; S.M.).
Authorship
Contribution: S.P. designed the study, collected, analyzed, and interpreted the data, performed the bioinformatic and statistical analyses, and wrote the manuscript; C.G. performed NGS experiments, clinical data collection, and participated in the analysis interpretation; S.K., L.T., M.Z., A.K., H.A., Y.G., and B.K.J. helped in sample and data collection; T.L. and V.V. edited the manuscript, helped in data interpretation, and gave helpful intellectual insights during the study; Y.S., B.J.P., N.S.M., and B.K.H. actively participated in patient recruitment, management, and follow-up; S.L. and S.M. provided genotypic data for the Finnish cohort and critically revised the manuscript; C.Y.Y. performed the molecular modeling and analyzed the crystallographic structures helped in drafting the methods inherent to this part; T.A.C. and T.L.L. helped in data interpretation and analytical method development; J.P.M. designed and conceptualized the study, interpreted the data analysis, and edited the manuscript; S.P. and J.P.M. took responsibility for the integrity and the accuracy of the data presented; and all authors reviewed and approved the final version of this manuscript.
Conflict-of-interest disclosure: The authors declare no competing financial interests.
Correspondence: Jaroslaw P. Maciejewski, Lerner Research Institute NE6, Cleveland Clinic, 9620 Carnegie Ave, N Building, NE6-314, Cleveland, OH 44195; e-mail: maciejj@ccf.org.
All the data that support the findings of this study are available within the article and supplemental Appendix. Genotyping and clinical data of IAA and HC cohorts have been deposited in the following repository: https://github.com/SMNPAG/HED-IAA. Access can be requested from maciejj@ccf.org and smnpag@gmail.com. TCR sequencing data of the IAA cohort are available through the ImmuneACCESS platform: https://doi.org/10.21417/SP2021B. TCR sequencing data of the HC cohort are provided with the original study and through the Immune ACCESS platform (https://doi.org/10.21417/B7001Z). Genotypic raw data of the disease-control cohorts can be requested to the authors (MN cohort) and to the National Institutes of Health, National Institute of Diabetes and Digestive and Kidney Diseases (T1D cohort).
There is a Blood Commentary on this article in this issue.
The online version of this article contains a data supplement.
The publication costs of this article were defrayed in part by page charge payment. Therefore, and solely to indicate this fact, this article is hereby marked “advertisement” in accordance with 18 USC section 1734.

This feature is available to Subscribers Only
Sign In or Create an Account Close Modal