

Key Points
Pediatric patients with ITP had increased antibodies to the typically sialylated TF antigen.
Loss of sialic acid causing TF antigen exposure results in increased immune cell surveillance of MKs and thrombocytopenia.

Abstract
Immune thrombocytopenia (ITP) is a platelet disorder. Pediatric and adult ITP have been associated with sialic acid alterations, but the pathophysiology of ITP remains elusive, and ITP is often a diagnosis of exclusion. Our analysis of pediatric ITP plasma samples showed increased anti–Thomsen-Friedenreich antigen (TF antigen) antibody representation, suggesting increased exposure of the typically sialylated and cryptic TF antigen in these patients. The O-glycan sialyltransferase St3gal1 adds sialic acid specifically on the TF antigen. To understand if TF antigen exposure associates with thrombocytopenia, we generated a mouse model with targeted deletion of St3gal1 in megakaryocytes (MK) (St3gal1MK−/−). TF antigen exposure was restricted to MKs and resulted in thrombocytopenia. Deletion of Jak3 in St3gal1MK−/− mice normalized platelet counts implicating involvement of immune cells. Interferon-producing Siglec H–positive bone marrow (BM) immune cells engaged with O-glycan sialic acid moieties to regulate type I interferon secretion and platelet release (thrombopoiesis), as evidenced by partially normalized platelet count following inhibition of interferon and Siglec H receptors. Single-cell RNA-sequencing determined that TF antigen exposure by MKs primed St3gal1MK−/− BM immune cells to release type I interferon. Single-cell RNA-sequencing further revealed a new population of immune cells with a plasmacytoid dendritic cell–like signature and concomitant upregulation of the immunoglobulin rearrangement gene transcripts Igkc and Ighm, suggesting additional immune regulatory mechanisms. Thus, aberrant TF antigen moieties, often found in pathological conditions, regulate immune cells and thrombopoiesis in the BM, leading to reduced platelet count.
Introduction
Bone marrow (BM) megakaryocytes (MKs) maintain the continuous production of circulating platelets to prevent bleeding. Thrombopoiesis and platelet release depends on MK localization at BM sinusoids and the organization of the MK demarcation membrane system, a precursor complex membranous structure essential for proplatelet formation before their release into the bloodstream.1 The mechanisms of platelet production remain under intense investigation.
The Thomsen-Friedenreich antigen (TF antigen), defined as exposure of the underlying Core-1 disaccharide [Galβ(1,3) GalNAc] through loss of its capping sialic acid (Sia), appears in vivo during acute infections with influenza viruses or bacteria.2,3 Exposure of the TF antigen on circulating blood cells, including platelets and red blood cells (RBCs), can lead to severe thrombocytopenia or hemolysis.4,5 Anti–TF antigen “naturally occurring” antibodies are present in almost all sera of adults.6 However, anti-TF are low-titer antibodies with relatively weak hemolyzing capabilities and typically do not cause platelet clearance.7
Immune thrombocytopenia (ITP) is a diagnosis of exclusion in the absence of other causes of thrombocytopenia-inducing disorders.8,9 In 60% of ITP cases, autoantibodies cause increased platelet clearance in spleen or liver.10-12 Therapeutic approaches, including splenectomies, are met with varying success, particularly when considering complete and sustained remission.13 Data show that treatment with the sialidase inhibitor oseltamivir increases platelet count in healthy and thrombocytopenic patients.14-16 Thus, emerging views on ITP present a simplified view in which Sia loss on platelets and MKs leads to ITP.17,18 In humans, genetic mutations involving Sia synthesis and transport, and atypical cell surface sialylation, unrelated to any other genetic mutation, are associated with reduced platelet count, supporting the role of Sia in regulating platelet count.19-24
Immune cells, including classical dendritic cells (cDCs) and subsets of T cells (CD8+, CD4+, and regulatory T cells), can also affect ITP pathogenesis.17 In ITP patient BM samples, CD8+ T cells interact with MKs to inhibit thrombopoiesis.25 Increased interferon (IFN) response, mediated by plasmacytoid dendritic cells (pDCs), also contributes to pediatric ITP pathogenesis by supporting monocyte and T-cell activation.26 As with many other immune cells, cDCs and pDCs express Siglecs (sialic acid–binding immunoglobulin-like lectins), which often contain immunoreceptor tyrosine-based inhibitory motifs that act as immunosuppressors. Whether BM immune cells monitor MKs via glycan–lectin interactions to control platelet production is unclear.
We observed an increase in immunoglobulin G (IgG) antibodies against the sialylated and desialylated TF antigen in pediatric ITP plasma samples. Anti-TF antibodies are not associated with antibody-mediated platelet clearance7; hence we investigated the role of TF antigen exposure in MKs and thrombopoiesis by using a conditional mouse model deficient in St3gal1 in the MK lineage (St3gal1MK−/−). St3gal1 is a sialyltransferase that exclusively acts to sialylate mucin-rich Core-1 O-glycans (Figure 1A).27 Deletion of Jak3 in St3gal1MK−/− mice (ie, DKO) or inhibition of either the canonical pDC receptor Siglec H or the IFN type I (IFN-I) receptor IFNAR partially and transiently elevated platelet count. Single-cell RNA sequencing (scRNAseq) of St3gal1MK−/− BM immune cells showed increased activation of IFN-I pathways. Thus, TF antigen exposure on MKs stimulates IFN-I secretion via Siglec H, suggesting that immune cells, including cells with a pDC-like signature, surveil Sia on MKs to control thrombopoiesis and platelet release.
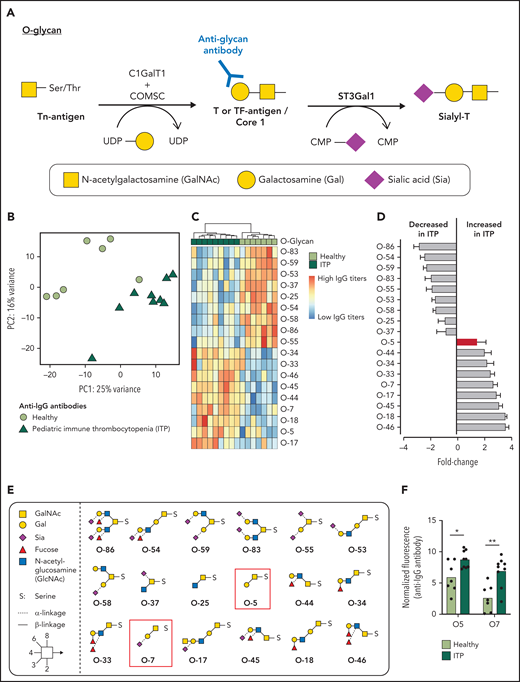
Pediatric ITP patient plasma has increased IgG antibodies against the TF antigen. (A) O-glycan Core 1 synthesis pathway. ST3Gal1 mediates sialylation and capping of the TF antigen. (B) Principal component analysis plot of IgG antibodies binding to a 95-member O-glycan array differentiating healthy plasma (lime green circles) from pediatric ITP plasma (green triangles). (C) Heat map of O-glycans that significantly contribute to separation of IgG antibody-O-glycan binding from healthy (lime green) vs pediatric (green) ITP plasma. (D) Data in panel B shown from decreasing to increasing fold change of normalized binding fluorescence intensity in ITP patient plasma. TF antigen and its sialylated form are noted as a red bar. (E) Structures of O-glycans that significantly contribute to differentiating healthy vs pediatric ITP plasma. TF-antigen (O-5) and its sialylated form (O7) is highlighted in the red box. (F) IgG antibody binding in pediatric patients with ITP to desialylated (O-5) and sialylated (-O-7) Core 1 structure (TF antigen). (F) For comparison of the 2 groups, moderated Student t tests were used to compare healthy vs ITP, and P values were adjusted by using the Benjamini-Hochberg method. *P < 0.05, **P < .01.
Pediatric ITP patient plasma has increased IgG antibodies against the TF antigen. (A) O-glycan Core 1 synthesis pathway. ST3Gal1 mediates sialylation and capping of the TF antigen. (B) Principal component analysis plot of IgG antibodies binding to a 95-member O-glycan array differentiating healthy plasma (lime green circles) from pediatric ITP plasma (green triangles). (C) Heat map of O-glycans that significantly contribute to separation of IgG antibody-O-glycan binding from healthy (lime green) vs pediatric (green) ITP plasma. (D) Data in panel B shown from decreasing to increasing fold change of normalized binding fluorescence intensity in ITP patient plasma. TF antigen and its sialylated form are noted as a red bar. (E) Structures of O-glycans that significantly contribute to differentiating healthy vs pediatric ITP plasma. TF-antigen (O-5) and its sialylated form (O7) is highlighted in the red box. (F) IgG antibody binding in pediatric patients with ITP to desialylated (O-5) and sialylated (-O-7) Core 1 structure (TF antigen). (F) For comparison of the 2 groups, moderated Student t tests were used to compare healthy vs ITP, and P values were adjusted by using the Benjamini-Hochberg method. *P < 0.05, **P < .01.
Materials and methods
Human studies
Clinical data and biologic samples from pediatric patients with ITP were obtained as part of an institutional review board–approved study protocol through Baylor College of Medicine. Whole blood samples were obtained from patients with ITP who had active thrombocytopenia and had not received any disease-modifying therapy at the time of blood draw. Patients are retrospectively defined as acute if their disease resolved in ≤12 months and chronic if disease persisted beyond 1 year. Autoantibody testing was not part of standard of care. Control plasma samples from age-matched healthy donors were obtained from a separate institutional review board; platelet count data are not available. Blood samples were collected in EDTA tubes, and plasma was isolated after centrifugation at 800g for 10 minutes and then stored at −80 degrees. Informed consent was obtained, as per the Declaration of Helsinki.
Animals
C57BL/6J/129 St3gal1fl/fl mice carrying LoxP sites on exon 2 (Jackson Laboratory) were paired with Pf4-Cre mice to delete St3Gal1 in the MK lineage (St3gal1MK−/−) and backcrossed into the C57BL/6J background at least 10 generations. C57BL/6J mice with a targeted knockout in Jak3 were crossed with St3gal1MK−/− mice (DKO). All studies were performed on age- and sex-matched adult mice (8-25 weeks old). Control mice were St3Gal1fl/fl littermates without Pf4-Cre. Animal work was approved by Institutional Animal Care and Use Committees of the Medical College of Wisconsin.
Coculture of pDCs and MKs
To generate pDCs, BM cells were isolated from mice femurs and tibias and cultured for 8 days in RPMI 1640 media with 10% fetal bovine serum, 1% penicillin-streptomycin, and 300 ng/mL FLT3 ligand.28 Generation of pDC was confirmed by flow cytometry analysis, staining positive for B220 and CD11c. BM MKs were cultured as previously described.29 Enriched MKs (1 × 10⁵ cells per mL) were cocultured with pDCs (5 × 10⁵ cells per mL) in RPMI media for 18 hours. Anti–Siglec H monoclonal antibody (mAb) 440c or cytosine triphosphase guanine (CpG)oligodeoxynucleotide (Novusbio) were added at 0.5 mg/mL or 20 μg/mL, respectively. Conditioned media were separated from cell culture by centrifugation and directly assayed with no dilution for IFN-I content using Mouse IFN-α or β High-Sensitivity Enzyme-Linked Immunosorbent Assay Kit. For immunofluorescence staining of cocultures, a 12-mm circular coverslip coated with 200 μL of 17% phenol red free matrigel was used. Cells were fixed after 18 hours of coculture with 10% neutral buffered formalin. Permeabilization, immunofluorescence staining, and analysis were performed as indicated in the following sections.
BM histology and immunofluorescence
Femurs were fixed, embedded, and frozen as previously described.30 Whole longitudinal sections (7 μm) were thawed, rehydrated, and permeabilized in Tris buffered saline (TBS) with 0.1% Tween (TTBS), blocked with 5% bovine serum albumin in TTBS and incubated with corresponding primary antibodies followed by the corresponding secondary antibodies. Fluorescence imaging was performed on a Nikon Eclipse Ti2 or Olympus V120 (whole slide scanning), and confocal images were obtained by using an Olympus FV10i or Olympus FV1000-MPE.
For quantification of mononuclear cells associated with MKs, whole-mount BM femur sections from 3 to 4 mice per genotype were used and 3 to 4 frames per mice of 0.03 mm2-sized frames captured. Using ImageJ (National Institutes of Health), the number of infiltrated MKs over total MKs was calculated and expressed as a percentage. For quantification of proplatelet formation, coverslips (prepared as described earlier) were used and 20 frames (MK culture alone) or 10 frames (with pDC coculture) of 0.6 mm2-sized frames captured. The number of proplatelet-forming MKs over total MKs was calculated and expressed as a percentage. For quantification of bone stromal antigen 2 (BST2)-positive cells and CD4/PF4 (MK) colocalization, whole-mount BM femur sections from 3 mice per genotype mice each were obtained. The entire femur was imaged and stitched by using software on NIS-Elements. Using Imaris software, BST2+, CD4+, and PF4+ cells were enumerated by using consistent area and intensity threshold settings for each cell type. Density over area (BST2 cells per mm2) or colocalization (<0.1 μm distance) was calculated by using Imaris software.
Data analysis
All experiments were performed at least in triplicate, and data were plotted as mean ± standard error of the mean by using Prism8. Statistical significance of data was assessed with GraphPad Prism 8 software, using tests as indicated on the figures. Differences were considered as significant when P < .05. Different levels of significance are indicated as *P < .05, **P < .01, and ***P < .001. No statistical method was used to predetermine sample size.
Further details on experimental procedures are included in the supplemental Materials and methods (available on the Blood Web site).
Results
Pediatric ITP patient plasma has increased antibodies against the TF antigen
We compared binding of IgG and IgM antibodies vs a 95-member O-glycan array in pediatric ITP patient plasma vs healthy age-matched donor plasma. Principal component analysis revealed that IgG antibodies toward glycans in pediatric patients with ITP could be differentiated from healthy controls (Figure 1B) but not IgM (supplemental Figure 1). Multivariate analysis of normalized fluorescence binding values showed that IgG plasma antibody separation was driven by 18 antiglycan antibodies (Figure 1C). Nine glycan structures had significantly decreased IgG antibody binding in ITP patient plasma, corresponding mostly to antibodies against sialylated O-glycans (Figure 1D-E). Nine glycan structures had significantly increased IgG antibodies to O-glycans, including fucosylated structures. Notably, binding to both sialylated (Ig-O7) and desialylated TF-antigen core 1 glycan (Ig-O5) was increased (Figure 1F). Patients with both acute and chronic ITP were included in the data analysis, and they contributed equally to differentiation from healthy samples. Patients with acute and chronic ITP were not differentiated according to IgG or IgM antibody binding (Table 1; supplemental Figure 1).
Patient and control baseline characteristics
| Parameter | Healthy controls | All ITP | Chronic ITP | Acute ITP |
|---|---|---|---|---|
| Age, y | 4-17 (12.0) | 1-17 (8.2) | 3-17 (8.2) | 1-15 (7.9) |
| Platelet count, K/μL | >150-450 | 2-104 (19) | 13-104 (52) | 2-19 (11) |
| Ig-O5 (fluorescence intensity) | 2.5-8.8 (5.3) | 7.3-10.7 (8.8) | 7.3-10.7 (8.8) | 7.5-10.3 (8.9) |
| Ig-O7 (fluorescence intensity) | 0.1-5.8 (2.3) | 2.1-9.6 (7.6) | 6.8-9.6 (8.1) | 2.1-8.5 (5.9) |
Data are presented as range (median) unless otherwise indicated.
Deletion of St3gal1 in MKs causes TF antigen expression and thrombocytopenia
To investigate how TF antigen exposure can lead to low platelet counts, we generated a conditional knockout of the St3gal1 in the MK and platelet lineages (St3gal1MK−/− mice). TF antigen expression was confirmed by measuring binding of peanut agglutinin (PNA) specific for TF antigen. St3gal1MK−/− BM MKs and circulating platelets had a twofold and threefold, respectively, increase in PNA binding compared with control (Figure 2A-B). PNA binding remained unchanged in BM subsets of RBC (Ter119), leukocytes (CD45), and macrophages (CD11b, F4/80) (Figure 2A). PNA binding in St3gal1MK−/− platelets was increased threefold, whereas other lectins (α2,6-Sia-binding Sambucus nigra, type II lactosamine disaccharide [Galb1,4GlcNAc]-binding Ricinus communis agglutinin, and Erythrina crista-galli lectin) remained unchanged (Figure 2B). Thus, in St3gal1MK−/− mice, TF antigen exposure is present and measurable only on MK and platelets.
![St3gal1 deletion in MKs leads to TF antigen expression and thrombocytopenia that is not due to accelerated clearance. (A) Binding of PNA specific for TF antigen in various BM cell types: MKs, RBCs, leukocytes (white blood cells [WBCs]), and myeloid cells. Dashed line at 1 indicates fold, WPQD3. change over controls (n = 5-7). (B) Binding of various lectins (PNA, Sambucus nigra lectin [SNA], Ricinus communis agglutinin [RCA], and Erythrina crista-galli lectin [ECL]) to platelets as evaluated by flow cytometry. Dashed line indicates fold change over controls (n = 3-8). (C) Platelet count in control mice (blue) and St3gal1MK−/− mice (red) (n = 13-14). (D) Endogenous platelet clearance was measured by daily monitoring (via flow cytometry) of the percent circulating biotinylated platelets and fluorescein isothiocyanate–streptavidin (n = 3). (E) Platelet glycoprotein expression was measured by flow cytometry using specific antibodies. Size-normalized mean fluorescence intensity (MFI) from analysis of ST3Gal1MK−/− platelets is shown. Dashed line indicates fold change over controls. (F) MFI of platelet surface IgG measured by using flow cytometry. (G) IgG levels in plasma and BM supernatant. (H) Platelet counts of mice weeks postspenectomy, measured at the indicated time points (n = 3 for both phenotypes). (I) Platelet clearance of fluorescently labeled St3gal1MK−/− platelets transfused into wild-type (WT) or AMR-null mice (n = 3). (J) TPO messenger RNA expression in control and St3gal1MK−/− mouse livers (n = 4-5). (K) Control, St3gal1MK−/−, and St3gal4−/− platelet lysate were subjected to sodium dodecyl sulfate–polyacrylamide gel electrophoresis and proved with anti-GPIbα and anti–β-actin antibodies (n = 3-4). Full blots (uncropped) are shown in supplemental Figure 2. For comparison of the 2 groups (A-B,E-G,J), a 2-tailed unpaired Student t test was performed. The Student t test was performed comparing MFI of WT vs St3gal1MK−/− of the measured parameters (A-B,E). For comparison of 2 groups over a treatment period (D,H-I), a multiple Student t test with Holm-Šídák method correction was performed. *P < .05, **P < .01, ****P < .0001. Only significant changes are annotated.](https://ash.silverchair-cdn.com/ash/content_public/journal/blood/138/23/10.1182_blood.2020008238/3/m_bloodbld2020008238f2.png?Expires=1771337113&Signature=Eo62zUuTkqtroGoeNZBK~mcjH2ClapoNY4v79BsKq88SocdC5ooJNUAMrvv~6jVGf-PI7o4P4tHdl5QRT77AqoAOMrLyGGxQc3wNGJmXlTAkuu9~nIHKKFj9zRrsH68pF-7I5rEI~OtuebBcg9TjfioXW469OYegjHnyGjNFuZfMFlofO2iJnZLMLBeHZFzdXsZKnHGxdhNGBcO-cAsflpf4JL~Hq0frp-YUujnwLIlyO5-TrRnM0CWk0UMI5XiqGGGCpmW8TH9XPlyb4O0oVI~bADXY~HkuTwKoW-K92BEiAt~diP4erX7s3cIA4XSJInBJkGtWgiP~Krn~782P4g__&Key-Pair-Id=APKAIE5G5CRDK6RD3PGA)
St3gal1 deletion in MKs leads to TF antigen expression and thrombocytopenia that is not due to accelerated clearance. (A) Binding of PNA specific for TF antigen in various BM cell types: MKs, RBCs, leukocytes (white blood cells [WBCs]), and myeloid cells. Dashed line at 1 indicates fold, WPQD3. change over controls (n = 5-7). (B) Binding of various lectins (PNA, Sambucus nigra lectin [SNA], Ricinus communis agglutinin [RCA], and Erythrina crista-galli lectin [ECL]) to platelets as evaluated by flow cytometry. Dashed line indicates fold change over controls (n = 3-8). (C) Platelet count in control mice (blue) and St3gal1MK−/− mice (red) (n = 13-14). (D) Endogenous platelet clearance was measured by daily monitoring (via flow cytometry) of the percent circulating biotinylated platelets and fluorescein isothiocyanate–streptavidin (n = 3). (E) Platelet glycoprotein expression was measured by flow cytometry using specific antibodies. Size-normalized mean fluorescence intensity (MFI) from analysis of ST3Gal1MK−/− platelets is shown. Dashed line indicates fold change over controls. (F) MFI of platelet surface IgG measured by using flow cytometry. (G) IgG levels in plasma and BM supernatant. (H) Platelet counts of mice weeks postspenectomy, measured at the indicated time points (n = 3 for both phenotypes). (I) Platelet clearance of fluorescently labeled St3gal1MK−/− platelets transfused into wild-type (WT) or AMR-null mice (n = 3). (J) TPO messenger RNA expression in control and St3gal1MK−/− mouse livers (n = 4-5). (K) Control, St3gal1MK−/−, and St3gal4−/− platelet lysate were subjected to sodium dodecyl sulfate–polyacrylamide gel electrophoresis and proved with anti-GPIbα and anti–β-actin antibodies (n = 3-4). Full blots (uncropped) are shown in supplemental Figure 2. For comparison of the 2 groups (A-B,E-G,J), a 2-tailed unpaired Student t test was performed. The Student t test was performed comparing MFI of WT vs St3gal1MK−/− of the measured parameters (A-B,E). For comparison of 2 groups over a treatment period (D,H-I), a multiple Student t test with Holm-Šídák method correction was performed. *P < .05, **P < .01, ****P < .0001. Only significant changes are annotated.
St3gal1 deletion in MKs leads to TF antigen expression and thrombocytopenia that is not due to accelerated clearance. (A) Binding of PNA specific for TF antigen in various BM cell types: MKs, RBCs, leukocytes (white blood cells [WBCs]), and myeloid cells. Dashed line at 1 indicates fold, WPQD3. change over controls (n = 5-7). (B) Binding of various lectins (PNA, Sambucus nigra lectin [SNA], Ricinus communis agglutinin [RCA], and Erythrina crista-galli lectin [ECL]) to platelets as evaluated by flow cytometry. Dashed line indicates fold change over controls (n = 3-8). (C) Platelet count in control mice (blue) and St3gal1MK−/− mice (red) (n = 13-14). (D) Endogenous platelet clearance was measured by daily monitoring (via flow cytometry) of the percent circulating biotinylated platelets and fluorescein isothiocyanate–streptavidin (n = 3). (E) Platelet glycoprotein expression was measured by flow cytometry using specific antibodies. Size-normalized mean fluorescence intensity (MFI) from analysis of ST3Gal1MK−/− platelets is shown. Dashed line indicates fold change over controls. (F) MFI of platelet surface IgG measured by using flow cytometry. (G) IgG levels in plasma and BM supernatant. (H) Platelet counts of mice weeks postspenectomy, measured at the indicated time points (n = 3 for both phenotypes). (I) Platelet clearance of fluorescently labeled St3gal1MK−/− platelets transfused into wild-type (WT) or AMR-null mice (n = 3). (J) TPO messenger RNA expression in control and St3gal1MK−/− mouse livers (n = 4-5). (K) Control, St3gal1MK−/−, and St3gal4−/− platelet lysate were subjected to sodium dodecyl sulfate–polyacrylamide gel electrophoresis and proved with anti-GPIbα and anti–β-actin antibodies (n = 3-4). Full blots (uncropped) are shown in supplemental Figure 2. For comparison of the 2 groups (A-B,E-G,J), a 2-tailed unpaired Student t test was performed. The Student t test was performed comparing MFI of WT vs St3gal1MK−/− of the measured parameters (A-B,E). For comparison of 2 groups over a treatment period (D,H-I), a multiple Student t test with Holm-Šídák method correction was performed. *P < .05, **P < .01, ****P < .0001. Only significant changes are annotated.
Platelet count in St3gal1MK−/− mice was reduced by 50% compared with controls (Figure 2C), with increased mean platelet volume (MPV) and immature platelet fraction (IPF) (Table 2). RBC and white blood cell counts were normal. St3gal1MK−/− platelet life span (Figure 2D) and expression of the platelet surface receptors glycoprotein IIb (GPIIb), GPIIIa, GPIX, GPV, GPVI, and GPIbα were comparable to controls, being slightly but not significantly reduced (Figure 2E). St3gal1MK−/− mice had normal platelet surface, plasma, and BM supernatant IgG levels compared with controls (Figure 2F-G). We measured IgG and IgM plasma antibodies against the 95-member O-glycan array (supplemental Figure 2). The presence of IgG and IgM plasma antibodies to O-glycans appeared low in mouse plasma, but St3gal1MK−/− plasma had increased IgM antibodies against sialylated (Ig-O7) and desialylated (Ig-O5) TF antigen compared with control, whereas IgG antibodies were indistinguishable (supplemental Figure 2; supplemental Table 1). Spleen resident immune cells can clear platelets marked by antibodies for destruction. However, splenectomy failed to correct the thrombocytopenia in in St3gal1MK−/− mice (Figure 2H).
Hematologic parameters
| Parameter | Control | ST3Gal1MK−/− | Jak3−/− | DKO ST3Gal1MK−/−/Jak3−/− |
|---|---|---|---|---|
| Peripheral blood counts (n = 7-14) | ||||
| RBC (109/mL) | 7.85 ± 0.19 | 7.94 ± 0.18 | 8.02 ± 0.29 | 7.45 ± 0.16 |
| WBC (106/mL) | 6.92 ± 0.59 | 6.95 ± 0.23 | 2.56 ± 0.45** | 3.11 ± 0.44*** |
| Platelet (109/mL) | 1.01 ± 0.04 | 0.50 ± 0.04**** | 1.10 ± 0.06 | 0.87 ± 0.06 |
| Platelet parameters (n = 7-14) | ||||
| MPV, fL | 6.75 ± 0.04 | 7.16 ± 0.08*** | 6.75 ± 0.07 | 7.23 ± 0.08**** |
| IPF, % | 0.20 ± 0.03 | 0.41 ± 0.06* | 0.20 ± 0.06 | 0.47 ± 0.06** |
| BM cell count (n = 5) | ||||
| MK, mm2 | 56 ± 5 | 53 ± 10 | 69 ± 2 | 66 ± 4 |
| LSK, % of BM | 0.29 ± 0.05 | 0.27 ± 0.08 | — | — |
| LK, % of BM | 1.23 ± 0.10 | 1.03 ± 0.10 | — | — |
| PreMegE, % of BM | 0.09 ± 0.01 | 0.11 ± 0.01 | — | — |
| MkP, % of BM | 0.068 ± 0.007 | 0.080 ± 0.008 | — | — |
| BM supernatant (n = 4) | ||||
| IFN-α, pg/mL | 0.066 ± 0.08 | 0.054 ± 0.03 | — | — |
| IFN-β, pg/mL | 1.52 ± 0.36 | 1.86 ± 0.36 | — | — |
Statistical analysis, 1-way analysis of variance; indicated notation is vs controls. Only significant changes are annotated. *P < .05, **P < .01, ****P < .0001.
We previously reported that platelet N-glycan desialylation in the St3gal4-null model led to clearance by the hepatic Ashwell-Morell receptor (AMR) and increased thrombopoietin (TPO) production.31 Transfused ST3Gal1MK−/− platelets were not recognized by the AMR, as evidenced by similar survival in wild-type or AMR-null mice (Figure 2I). Hepatic TPO production, analyzed by quantitative reverse transcription polymerase chain reaction (qRT-PCR), was indistinguishable between ST3Gal1MK−/− mouse and control livers (Figure 2J). Truncated O-glycan on GPIbα resulting in its reduced molecular weight has been implicated in thrombocytopenic patients with Tn syndrome or Bernard-Soulier syndrome.32 GPIbα immunoblotting of platelet lysate from ST3Gal1MK−/− and St3gal4-null platelets had neither truncation nor hydrolysis but rather a slight increase in molecular weights, likely due to reduced negative charge from lack of sialyation (Figure 2K; supplemental Figure 3D-E). Although total GPIbα expression is lowered (supplemental Figure 3F), this action does not lead to changes in platelet half-life. However, the data indicate that sialylation, particularly of the O-glycan variety, plays a role in protein processing and expression.
St3gal1MK−/− MKs and thrombopoiesis are normal
We next investigated BM megakaryopoiesis and thrombopoiesis in the St3gal1MK−/− mice. St3gal1MK−/− mice, compared with control mice, had normal numbers of hematopoietic progenitors (LSK) (Figure 3A), MK progenitors (MkP), and bipotent precursors (PreMegE) (Figure 3B). Although there was a slight increase in plasma TPO in St3gal1MK−/− mice (Figure 3C), comparison of immunofluorescence-stained control and St3gal1MK−/− BM sections exhibited a normal number of mature MKs, identified as large multilobulated CD42b+ cells (Table 2). Because hepatic TPO production was not increased (Figure 2J), it is likely that the increase in plasma TPO is a reflection of lower platelet mass. The modal ploidy class of St3gal1MK−/− MKs was similar to controls at 16N, indicating that endomitosis was not impaired (Figure 3D). MKs from St3gal1MK−/− mice exhibited no obvious abnormalities, with the presence and appearance of alpha granules, mitochondria, and a demarcation membrane system comparable to those in control mice, as judged by using transmission electron microscopy (Figure 3E). Differentiation of MKs from St3gal1MK−/− vs control fetal liver cells showed similar propensity (number of MKs formed) and normal proplatelet formation, as evaluated by immunofluorescence using β-tubulin antibody (supplemental Figure 3A-C).
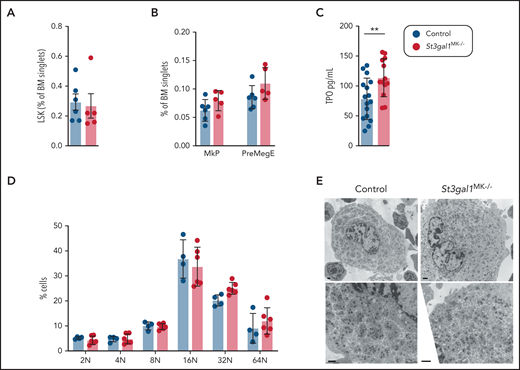
St3gal1-deficient MKs differentiate and mature normally. (A) Percentage of hematopoietic progenitors, defined as lineage negative, cKit+, and Sca-1– cells (LSK) in the BM (n = 5-6). (B) Percentage of MK progenitors MkP (Lineage–, cKit+, Sca-1–, CD150+, and CD41+ cells) and bipotent precursors, PreMegE (Lineage–, cKit+, Sca-1–, CD16/32+, CD105+, CD150– cells) in the BM (n = 5-6). (C) Plasma TPO levels determined by enzyme-linked immunosorbent assay. (D) Flow cytometric quantification of BM MK ploidy in control (blue) and ST3Gal1MK−/− (red) mice (n = 4-6). (E) Transmission electron microscopy images of MKs flushed from control and St3gal1MK−/− BMs. Scale bars, 1 μm. **P < .01.
St3gal1-deficient MKs differentiate and mature normally. (A) Percentage of hematopoietic progenitors, defined as lineage negative, cKit+, and Sca-1– cells (LSK) in the BM (n = 5-6). (B) Percentage of MK progenitors MkP (Lineage–, cKit+, Sca-1–, CD150+, and CD41+ cells) and bipotent precursors, PreMegE (Lineage–, cKit+, Sca-1–, CD16/32+, CD105+, CD150– cells) in the BM (n = 5-6). (C) Plasma TPO levels determined by enzyme-linked immunosorbent assay. (D) Flow cytometric quantification of BM MK ploidy in control (blue) and ST3Gal1MK−/− (red) mice (n = 4-6). (E) Transmission electron microscopy images of MKs flushed from control and St3gal1MK−/− BMs. Scale bars, 1 μm. **P < .01.
Thrombocytopenia in St3gal1MK−/− mice is restored in Jak3-null mice
Neither platelet clearance nor MK maturation caused thrombocytopenia in St3gal1MK−/− mice. Although the cause of pediatric ITP is often unclear, it is believed to be driven by an immune response. Our data identified an increase in antibodies directed toward sialyl-TF and TF antigen in the patients with ITP, suggesting a heightened immune response toward TF antigen structures. To test if TF antigen exposure in St3gal1MK−/− MKs causes an immune response thereby affecting thrombopoiesis, mice were injected with the pan anti-inflammatory corticosteroid dexamethasone. Injections of St3gal1MK−/− mice with dexamethasone restored platelet count to wild-type levels, indicative of inflammation-mediated thrombocytopenia (Figure 4A).
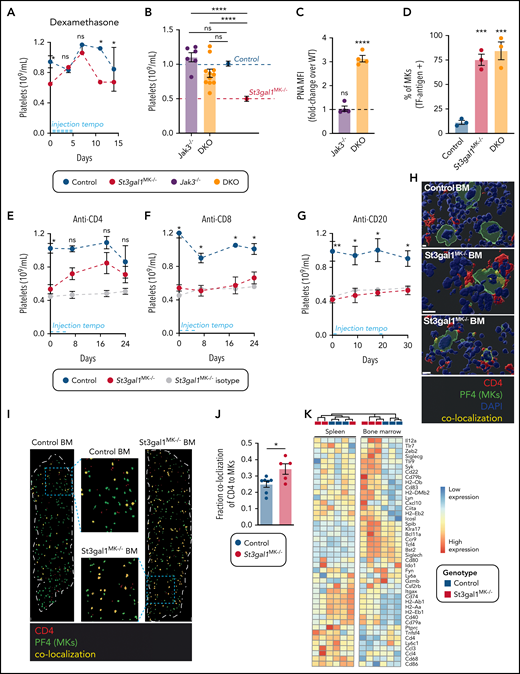
Platelet counts in St3gal1MK−/− mice are normalized by suppression of CD4+ and Jak3-dependent immune cells. ( A) Platelet count during pan–anti-inflammatory treatment using dexamethasone of St3gal1MK−/− control (blue) and St3gal1MK−/− (red) mice (n = 4). Injection tempo is indicated as a light blue line. (B) Platelet count in Jak3−/− (purple) and DKO mice (orange) (n = 6-11. Average control mice platelet count (dashed blue line, blue circle) and St3gal1MK−/− platelet count (dashed red line, red circle) shown. (C) Binding of PNA to Jak3−/− and DKO platelets as evaluated by flow cytometry. Dashed line indicates fold-change over controls (n = 4). (D) Percentage of TF antigen–positive BM MKs as determined by immunofluorescence of whole femur longitudinal sections using anti-GPIbα and anti–TF antigen antibodies (n = 3). Platelet count during antibody-mediated cell depletion treatments of control (white) and St3gal1MK−/− mice (red). Mice were treated with depleting anti-CD4 antibody (E) (n = 8-13), depleting anti-CD8 antibody (F) (n = 3), and depleting anti-CD20 antibody (G) (n = 6-8). Isotype control injections are shown in gray in panels E, F, and G; the antibody injection tempo is indicated as a light blue line. (H) Confocal microscopy of BM sections from control (bottom right) and ST3Gal1MK−/− (2 examples shown) mice. Tissues were stained for PF4 (MKs in green) and CD4 (CD4 immune cells in red). Overlap between PF4 and CD4 is colored in yellow. Scale bars, 10 μm. (I) Immunofluorescence staining of longitudinal whole femur sections from control (left) and ST3Gal1MK−/− (right) mice, and their respective selected enlargement. Tissues were stained for PF4 (MKs in green) and CD4 (CD4 immune cells in red). Overlap between PF4 and CD4 was colored in yellow. Scale bars, 100 μm. (J) Quantification of colocalization, expressed as percentage of PF4+ cells (n = 5-7). (K) A heat map of pDC-related genes expressed by sel-CD4+ spleen (left) and BM (right) cells from controls (black) and St3gal1MK−/− (red) mice. Significantly differentially expressed genes in the BM are indicated in bold. For multiple comparisons (B-D), 1-way analysis of variance with Tukey’s multiple comparison test was performed. Result displayed is comparison with wild-type control, or as indicated by horizontal lines. For comparison of 2 groups over a treatment period (A,E-G), a multiple Student t test with Holm-Šídák method correction was performed. Comparison of control vs St3gal1MK−/− in black (A,E-G). For comparison of 2 groups (panel J), a 2-tailed, unpaired Student t test was performed. *P < .05, **P < .01, ***P < .001, ****P < .0001. DAPI, 4′,6-diamidino-2-phenylindole; MFI, mean fluorescence intensity; ns, not significant.
Platelet counts in St3gal1MK−/− mice are normalized by suppression of CD4+ and Jak3-dependent immune cells. ( A) Platelet count during pan–anti-inflammatory treatment using dexamethasone of St3gal1MK−/− control (blue) and St3gal1MK−/− (red) mice (n = 4). Injection tempo is indicated as a light blue line. (B) Platelet count in Jak3−/− (purple) and DKO mice (orange) (n = 6-11. Average control mice platelet count (dashed blue line, blue circle) and St3gal1MK−/− platelet count (dashed red line, red circle) shown. (C) Binding of PNA to Jak3−/− and DKO platelets as evaluated by flow cytometry. Dashed line indicates fold-change over controls (n = 4). (D) Percentage of TF antigen–positive BM MKs as determined by immunofluorescence of whole femur longitudinal sections using anti-GPIbα and anti–TF antigen antibodies (n = 3). Platelet count during antibody-mediated cell depletion treatments of control (white) and St3gal1MK−/− mice (red). Mice were treated with depleting anti-CD4 antibody (E) (n = 8-13), depleting anti-CD8 antibody (F) (n = 3), and depleting anti-CD20 antibody (G) (n = 6-8). Isotype control injections are shown in gray in panels E, F, and G; the antibody injection tempo is indicated as a light blue line. (H) Confocal microscopy of BM sections from control (bottom right) and ST3Gal1MK−/− (2 examples shown) mice. Tissues were stained for PF4 (MKs in green) and CD4 (CD4 immune cells in red). Overlap between PF4 and CD4 is colored in yellow. Scale bars, 10 μm. (I) Immunofluorescence staining of longitudinal whole femur sections from control (left) and ST3Gal1MK−/− (right) mice, and their respective selected enlargement. Tissues were stained for PF4 (MKs in green) and CD4 (CD4 immune cells in red). Overlap between PF4 and CD4 was colored in yellow. Scale bars, 100 μm. (J) Quantification of colocalization, expressed as percentage of PF4+ cells (n = 5-7). (K) A heat map of pDC-related genes expressed by sel-CD4+ spleen (left) and BM (right) cells from controls (black) and St3gal1MK−/− (red) mice. Significantly differentially expressed genes in the BM are indicated in bold. For multiple comparisons (B-D), 1-way analysis of variance with Tukey’s multiple comparison test was performed. Result displayed is comparison with wild-type control, or as indicated by horizontal lines. For comparison of 2 groups over a treatment period (A,E-G), a multiple Student t test with Holm-Šídák method correction was performed. Comparison of control vs St3gal1MK−/− in black (A,E-G). For comparison of 2 groups (panel J), a 2-tailed, unpaired Student t test was performed. *P < .05, **P < .01, ***P < .001, ****P < .0001. DAPI, 4′,6-diamidino-2-phenylindole; MFI, mean fluorescence intensity; ns, not significant.
Surprisingly, when Jak3-dependent immune cells were knocked-out in St3gal1MK−/− mice (DKO), platelet count was recovered to control levels, with a significant twofold increase compared with St3gal1MK−/− mice (Figure 4B). PNA staining of DKO platelets confirmed that the TF antigen remained increased at levels similar to those of St3gal1MK−/− platelets (Figure 4C). TF antigen–positive MKs were increased by sixfold in the St3gal1MK−/− BMs and DKO BMs compared with control (Figure 4D). Although platelet counts were restored in the DKO, the mean MPV and IPF were indistinguishable between DKO and St3gal1MK−/− mice (Table 2). We are currently unable to explain why both MPV and IPF were unchanged. Subsets of St3gal1MK−/− T cells and macrophages evaluated both in vivo, in vitro, and the latter through immunofluorescence staining of F4/80 in the BM remained unchanged, suggesting they do not contribute to causing thrombocytopenia (supplemental Figure 4).
We depleted CD4-, CD8-, or CD20-expressing cells in St3gal1MK−/− mice using depleting antibodies. Although CD4 depletion increased platelet counts to almost normal levels at day 7, depletion of CD8+ cells (a common coactivator partner of CD4 T cells) and CD20+ cells had no effect on platelet count in either control or St3gal1MK−/− mice (Figure 4E-G). Confocal microscopy of PF4+ MKs on ST3Gal1MK−/− BM sections showed overlap of CD4+ cells within the MK cytoplasm, compared with control BM MKs (Figure 4H; supplemental Videos 1-4). The colocalization of CD4 on MKs was evaluated by whole BM section microscopy (Figure 4I). In control BMs, only 20% of MKs had overlap with CD4+ cells. This was increased significantly by twofold, up to 40%, in St3gal1MK−/− BMs (Figure 4J). In summary, thrombocytopenia in St3gal1MK−/− mice is ameliorated by: (1) dexamethasone application; (2) Jak3-dependent immune cell deletion; and (3) depletion of CD4 cells.
Bulk RNAseq reveals increased pDC genes signature in St3gal1MK−/− BMs
Because CD4+ cell infiltration was apparent in St3gal1MK−/− BMs (Figure 4), and splenectomies had little effect on circulating platelet count (Figure 2), we hypothesized that differences in transcript expression between splenic and BM CD4+ cells would guide mechanistic investigation of thrombopoiesis regulation. We sorted selected CD4+ cells (sel-CD4+) from spleen and BM for bulk RNAseq from control and St3gal1MK−/− mice (supplemental Figure 5A-B). Principal component analysis showed that BM and splenic sel-CD4+ cells are transcriptionally distinct (supplemental Figure 5C). In comparisons according to genotype, sel-CD4+ splenic cells did not differentiate, displaying <0.3% difference of expressed genes (supplemental Table 2). In contrast, control sel-CD4+ BM cells cluster distinctly from St3gal1MK−/− sel-CD4+, differing in 3% of expressed genes, showing that BM resident St3gal1MK−/− MKs significantly affect the transcriptome of sel-CD4+ BM cells. St3gal1 transcripts in all 4 sets of sel-CD4+ BM and spleen cells were intact (supplemental Figure 6A), affirming that the Pf4-targeted deletion of St3gal1 in MKs causes TF antigen exposure only on MKs and causes differences between the St3gal1MK−/− BM sel-CD4+ cell pools.
CIBERSORTx infers cell types from bulk RNAseq expression profiles.33 We selected transcriptional profiles from the Immunological Genome Project (ImmGen)34 to represent CD4+ immune cell subsets, including naive T cell, T memory cell, natural killer T cell, cDCs, pDCs, CD8+ T cell, macrophages, and B memory cells (Table 3; supplemental Figure 5D).17 In splenic sel-CD4+ cells, CIBERSORTx analysis determined that cell compositions were similar between the phenotypes for all analyzed cell types except T memory cells. Notably, in the BM sel-CD4+, pDCs were slightly increased in St3gal1MK−/− BMs (12%) compared with control (8%) (P = .05), whereas T memory cells were lower in St3gal1MK−/− BMs vs control. Splenic pDCs were <1% in both genotypes. We compared the BM sel-CD4+ cells transcriptome vs an exhaustive curated list of pDC-associated genes.35-41 The pDC gene set was upregulated in St3gal1MK−/− BM sel-CD4+ cells (Figure 4K). Our data are in line with reports suggesting that: (1) pDCs can derive from both the common myeloid or lymphoid precursors42; and (2) common lymphoid precursors are severely impaired in Jak3−/− mice.43
CIBERSORTx cellular components
| Cell type | BM | Spleen | ||
|---|---|---|---|---|
| Control | St3gal1MK−/− | Control | St3gal1MK−/− | |
| Plasmacytoid DC | 8.2 ± 1.0 | 12.3 ± 1.7* | 0.5 ± 0.3 | 0.7 ± 0.2 |
| CD4 naive T cell | 10.2 ± 3.3 | 7.8 ± 2.5 | 28.3 ± 3.1 | 24.8 ± 0.8 |
| CD4 T memory cell | 29.4 ± 0.9 | 25.7 ± 0.7* | 12.0 ± 1.6 | 19.3 ± 2.1* |
| CD4 conventional DC | 4.0 ± 0.6 | 4.3 ± 0.7 | 10.4 ± 0.2 | 6.5 ± 2.1 |
| CD4 natural killer T cell | 6.4 ± 3.5 | 2.8 ± 2.2 | 2.3 ± 0.4 | No match |
| CD8 T memory cell | 0.4 ± 0.4 | No match | 1.9 ± 0.6 | No match |
| Macrophage | 1.5 ± 0.3 | 1.9 ± 0.4 | 7.3 ± 2.1 | 8.6 ± 1.3 |
| B memory cell | 39.8 ± 1.2 | 46.9 ± 3.3 | 37.3 ± 1.4 | 40.1 ± 1.5 |
Statistical analysis: a 2-tailed, unpaired Student t test. Only significant changes are annotated. *P < .05.
scRNAseq reveals a unique St3gal1MK−/− BM cell cluster with increased pDC and immunoglobulin rearrangement gene transcripts
To better understand the role of BM immune cells involved in causing thrombocytopenia in St3gal1MK−/− mice, we performed scRNAseq, positively selected for B220+ CD11c+ cells with negative selection of Ter119, CD11b, CD8, and Gr1, an approach that ensured inclusion of broad BM pDC subsets (Figure 5A), from a control and St3gal1MK−/− mouse, respectively. pDCs, characterized by the expression of B220, CD11c, Ly49Q (Klra17), BST2, and Siglec H, are a heterogeneous cell population44 specializing in production and rapid secretion of IFN-I, a negative regulator of thrombopoiesis.45 Sequencing reads over exon 2 of the St3gal1 gene had similar coverage in control and St3gal1MK−/− BM-sorted cells (supplemental Figure 6A). Hence, Pf4-Cre–directed excision does not affect the sorted cells. The immune cell profile changes observed are a result of detecting a change in St3gal1 glycosylation on BM MKs.
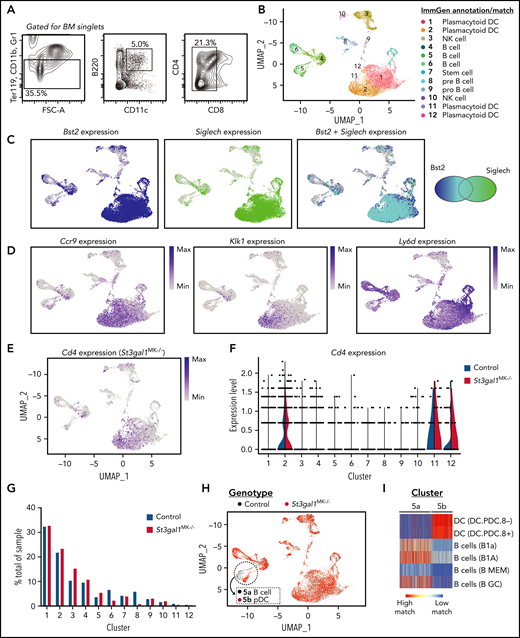
scRNAseq analysis reveals unique pDC subtypes in St3gal1MK−/− mice. (A) Flow cytometry diagram for isolating and sorting BM pDCs (Ter119–, CD11b–, Gr1–, B220+, CD11c+, and CD8–). (B) Uniform Manifold Approximation and Projection (UMAP) plot displaying clusters from isolated pDCs annotated and matched with data from ImmGen. For complete cell identity assignment see supplemental Figure 4C. (C) UMAP feature plot of Bst2 (dark blue, left panel) and Siglech (green, middle panel) show that annotated pDC clusters express transcripts for classic pDC surface markers. The overlap for both transcripts is shown in light blue (right panel), indicated by the Venn diagram. (D) UMAP feature plot of characteristic pDC genes Ccr9, Klk1, and Ly6d show that high expression concentrated in pDC clusters 1, 2, 11, and 12. (E) UMAP feature plot of Cd4 expression in St3gal1MK−/− pDCs. (F) Violin plot of Cd4 expression in control vs St3gal1MK−/− pDC clusters. (G) Quantification calculating percentage of representation in each cell cluster from control (blue) and St3gal1MK−/− (red) genotypes. (H) UMAP plots differentiating pDC clusters from respective control (black) and St3gal1MK−/− (red) genotypes. Cluster 5 can be further resolved into distinct control (5a) and St3gal1MK−/− (5b) subclusters. (I) Subclusters 5a and 5b identified as B cell and pDC-like, respectively, using the ImmGen database as a reference. FSC-A, forward side scatter area.
scRNAseq analysis reveals unique pDC subtypes in St3gal1MK−/− mice. (A) Flow cytometry diagram for isolating and sorting BM pDCs (Ter119–, CD11b–, Gr1–, B220+, CD11c+, and CD8–). (B) Uniform Manifold Approximation and Projection (UMAP) plot displaying clusters from isolated pDCs annotated and matched with data from ImmGen. For complete cell identity assignment see supplemental Figure 4C. (C) UMAP feature plot of Bst2 (dark blue, left panel) and Siglech (green, middle panel) show that annotated pDC clusters express transcripts for classic pDC surface markers. The overlap for both transcripts is shown in light blue (right panel), indicated by the Venn diagram. (D) UMAP feature plot of characteristic pDC genes Ccr9, Klk1, and Ly6d show that high expression concentrated in pDC clusters 1, 2, 11, and 12. (E) UMAP feature plot of Cd4 expression in St3gal1MK−/− pDCs. (F) Violin plot of Cd4 expression in control vs St3gal1MK−/− pDC clusters. (G) Quantification calculating percentage of representation in each cell cluster from control (blue) and St3gal1MK−/− (red) genotypes. (H) UMAP plots differentiating pDC clusters from respective control (black) and St3gal1MK−/− (red) genotypes. Cluster 5 can be further resolved into distinct control (5a) and St3gal1MK−/− (5b) subclusters. (I) Subclusters 5a and 5b identified as B cell and pDC-like, respectively, using the ImmGen database as a reference. FSC-A, forward side scatter area.
![Gene set enrichment analysis shows increase in IFN-I production in BM pDCs of St3gal1MK−/− mice. (A) Dot plot summarizing Gene Set Enrichment Analysis statistics (P adjusted values [p-adj], normalized enrichment scores [NES], and set size) of IFN and IFN-α/β Reactome pathways comparing combined pDC clusters (1, 2, 11, and 12, also show discretely) with non-pDC clusters. Positive (normalized) enrichment scores indicate increased enrichment in St3gal1MK−/−clusters. (B) Representative enrichment plots of IFN gene sets from combined pDC clusters. (C) A heat map of IFN and IFN-α/β reactome genes of each cluster. KO, knockout; WT, wild type.](https://ash.silverchair-cdn.com/ash/content_public/journal/blood/138/23/10.1182_blood.2020008238/3/m_bloodbld2020008238f6.png?Expires=1771337113&Signature=zKDX7A0TvhTJF3sEmMGsq5V0c26WuTsGUVwF91-Jlv9Hzsvb2hDwsSGORtRXtUwNIpAyeUEBycwJhz6YZEj9poojjJozYdUIWZvomWoOpzUr2kz475qJmUdu-xakYpa96Xu2OWc2HsUbSKIY7Oa5QvfWOZPDFnmI9ii16w012b0au1MBjoMoOA2NBq~xlcZIyZC1~Lx-W9g42yoIE0ukZmJicTiIJd--~rs2mDbzHr-8Jb4w2iZQPgdOI3JQ0cbZhyrGn6NlcPjpdu6XCDCD90wsklLTXIzEW8DzDoYMF1pRlF58EJ5kM6~BsH994aFzhK3-8l9~cDzWwA6YD1xI6g__&Key-Pair-Id=APKAIE5G5CRDK6RD3PGA)
Gene set enrichment analysis shows increase in IFN-I production in BM pDCs of St3gal1MK−/− mice. (A) Dot plot summarizing Gene Set Enrichment Analysis statistics (P adjusted values [p-adj], normalized enrichment scores [NES], and set size) of IFN and IFN-α/β Reactome pathways comparing combined pDC clusters (1, 2, 11, and 12, also show discretely) with non-pDC clusters. Positive (normalized) enrichment scores indicate increased enrichment in St3gal1MK−/−clusters. (B) Representative enrichment plots of IFN gene sets from combined pDC clusters. (C) A heat map of IFN and IFN-α/β reactome genes of each cluster. KO, knockout; WT, wild type.
Gene set enrichment analysis shows increase in IFN-I production in BM pDCs of St3gal1MK−/− mice. (A) Dot plot summarizing Gene Set Enrichment Analysis statistics (P adjusted values [p-adj], normalized enrichment scores [NES], and set size) of IFN and IFN-α/β Reactome pathways comparing combined pDC clusters (1, 2, 11, and 12, also show discretely) with non-pDC clusters. Positive (normalized) enrichment scores indicate increased enrichment in St3gal1MK−/−clusters. (B) Representative enrichment plots of IFN gene sets from combined pDC clusters. (C) A heat map of IFN and IFN-α/β reactome genes of each cluster. KO, knockout; WT, wild type.
After clustering the cells, we matched and assigned immune cell identities to the dataset using the ImmGen database as a reference (clusters 1-12) (Figure 5B). Overall, 56% of cells identified as pDCs, specifically clusters 1, 2, 11, and 12. pDC-related genes Bst2, Siglech, Ccr9, Klk1, and Ly6d were highest in these clusters (Figure 5C-D). Cd4 expression (Figure 5E-F) was highest in pDC clusters 2 and 11, and present in cluster 12, corroborating that CD4 depletion alleviated thrombocytopenia (Figure 3E). B cells and their precursors (clusters 4-6, 8-9), natural killer cells (clusters 3 and 10), and hematopoietic stem cells (cluster 7) were identified in the remaining clusters. Representation of control and St3gal1MK−/− genotypes was equally distributed in almost all clusters (Figure 5G), showing that the same cell types were sequenced in both mice.
Cluster 5 segregated into 2 genotype-dependent populations when analyzed at higher resolution (as discussed in the Materials and methods). When re-analyzed as discussed earlier to assign a cell identity, cluster 5a (wild-type) was identified as B cell, whereas 5b (St3gal1MK−/−) segregated to match a pDC type (Figure 5H-I). St3gal1MK−/− MKs give rise to an independent pDC-like population in which gene expression was dominated by immunoglobulin rearrangement gene transcripts Igkc and Ighm (supplemental Table 3), suggesting a role for these cells in antibody production.
St3gal1MK−/− BM pDC clusters have enriched IFN-I gene sets compared with controls
We performed Gene Set Enrichment Analysis comparing combined pDC clusters vs non-pDC clusters between control and St3gal1MK−/− genotypes. Reactome pathways involving IFN (R-HSA-913531) and IFN-α/β (R-HSA-909733) signaling were highly and significantly enriched in pDC clusters (Figure 6A-B). When analyzed individually, pDC clusters 1, 2, and 11 were significantly enriched in IFN production genes. The St3gal1MK−/− unique pDC cluster 5b did not exhibit an increase in IFN-related gene sets compared with all other non-pDC clusters.
IFN regulatory factor (IRF) proteins are positive transcriptional regulators of IFN-I production.46 IRF5 polymorphisms are associated with autoimmune disease susceptibility, including rheumatoid arthritis, systemic and multiple sclerosis, inflammatory bowel disease, and systemic lupus erythematosus.47-49 To further define the IFN-I response, gene heat maps were made for each REACTOME pathway (Figure 6C-D). pDC clusters 1, 2, 11, and 12 showed high expression of IRF transcripts (IRF1, IRF5-9), independent of mouse genotype. Notably, St3gal1MK−/− pDC clusters 1 and 11 were particularly high in expression of IRF5 and IRF9 transcripts compared with controls, suggesting that exposure of the TF antigen on MKs induces a chronic inflammatory state. Expression of IFN-I genes was not detected due to low transcript capture success within the 10X protocol.
Siglec H and IFNAR inhibition transiently ameliorates thrombocytopenia in St3gal1MK−/− mice
IFN-I, made largely of IFN-α and IFN-β, can suppress thrombopoiesis through binding of its common receptor IFNAR on MKs.45,50 IFNAR inhibition (Figure 7A) increased platelet count by 50% by day 7. Control mice platelet count was unaffected by the IFNAR blockade. Siglec H, a member of the Sia-binding Siglec family, is a canonical marker that distinguishes mature pDCs from cDCs.51 Crosslinking of Siglec H with its mAb 440c on isolated pDCs inhibits IFN-I secretion. Administration of anti–Siglec H mAb to St3gal1MK−/− mice transiently and only slightly elevated platelet count by day 6 (Figure 7B). Thus, the contribution of Siglec H remains unclear and needs more investigation to fully support its role in regulating thrombopoiesis in St3gal1MK−/− mice.
![pDCs inhibit thrombopoiesis primarily through secretion of IFN-1 mediated by Siglec H. Platelet count during treatment with IFNAR blockade (A, n = 12) or anti–Siglec H mAb 440c (B, n = 6-7) in control (blue) and St3gal1MK−/− (red) mice. Injection of isotype controls into St3gal1MK−/− (gray, n = 5). Injection tempo indicated as a light blue dotted line. (C) Quantification of BM pDCs from control and St3gal1MK−/− mice evaluated by using flow cytometry (Lin–, BST2+, CD11c+, Siglech+). (D) BM pDCs were isolated with negative selection magnetic cell sorting kit and evaluated for BST2 reactivity by using flow cytometry. (E) A section of immunofluorescence staining of whole-mount BMs from control and St3gal1MK−/− mice using mAb to BST2. Scale bars, 20 μm. (F) Quantification of BST2+ cells in immunofluorescence stained whole-mount BMs in panel D (n = 3). (G) Colocalization of BST2+ cells with MKs (PF4+) in immunofluorescence-stained whole-mount BMs in panel D (n = 3). (H) Scheme of the pDC and MK coculture experimental setup. (I) IFN-β content in supernatant media of wild-type pDC with control (not detected [ND]) or St3gal1MK−/− (red) cultured MKs after 18 hours of coculture. Addition of anti–Siglec H mAb 440c is indicated . The effect of anti–Siglec H on IFN-β production was not measured (NM) with control MKs. (J) Immunofluorescence staining of wild-type (or control) pDCs cocultured with control (left) or St3gal1MK−/− (right) MKs. MKs and pDCs were identified by using an anti-PF4 (green) and anti-BST2 (red) mAb, respectively. Scale bars, 30 μm. (K) Quantification of percentage of MKs that form proplatelets (proPLTs) as determined by in vitro culture. Control (blue) and St3gal1MK−/−(red) MKs differentiated BM-derived cells cultured in the absence (left panel) or presence (right bars) of control pDCs. For comparison of 2 groups over a treatment period (A-B), multiple Student t tests with Holm-Šídák method correction was performed. Comparison of control vs St3gal1MK−/− in black; St3gal1MK−/− vs St3gal1MK−/− isotype control in salmon. For comparison of 2 groups (D-E,G), a 2-tailed, unpaired Student t test was performed. For multiple comparisons (I), 1-way analysis of variance with Tukey’s multiple comparison test was performed. *P < .05, **P < .01. Only significant changes are annotated. DAPI, 4′,6-diamidino-2-phenylindole; FLT3L, FLT3 ligand; ns, not significant.](https://ash.silverchair-cdn.com/ash/content_public/journal/blood/138/23/10.1182_blood.2020008238/3/m_bloodbld2020008238f7.png?Expires=1771337113&Signature=fMPQmAgaZx7J9EfyQByxWud~PdSLYIk4Pkzv581zk3XAqId3YLtSljeEtdHdgZGEnH2qIo9c-6JqFjrc2NCZKEzLyrurWwB5BZ7~9SJjKwv6erwX5r~lCndWZvSqn4voEYKpdLoPgbt6sAFHEJ3Rp9~d9Ylo~pTOD~U3hXpRQQexUYkOMVuAZnyh5Z6LlxQKUDb1heFP3QGuKbdD9rqTVkxlJjdoIRd5VHI72Lm-JrrG4AasHVk3cYYIfrmEo9c-NJWdK-0-nwW~gqMAmC0cBxuCeQF9ofafroBtbc3FOyd9liet9vnTkz4QLG0aTSOONK1C4Go~90ZqHa4eba-10A__&Key-Pair-Id=APKAIE5G5CRDK6RD3PGA)
pDCs inhibit thrombopoiesis primarily through secretion of IFN-1 mediated by Siglec H. Platelet count during treatment with IFNAR blockade (A, n = 12) or anti–Siglec H mAb 440c (B, n = 6-7) in control (blue) and St3gal1MK−/− (red) mice. Injection of isotype controls into St3gal1MK−/− (gray, n = 5). Injection tempo indicated as a light blue dotted line. (C) Quantification of BM pDCs from control and St3gal1MK−/− mice evaluated by using flow cytometry (Lin–, BST2+, CD11c+, Siglech+). (D) BM pDCs were isolated with negative selection magnetic cell sorting kit and evaluated for BST2 reactivity by using flow cytometry. (E) A section of immunofluorescence staining of whole-mount BMs from control and St3gal1MK−/− mice using mAb to BST2. Scale bars, 20 μm. (F) Quantification of BST2+ cells in immunofluorescence stained whole-mount BMs in panel D (n = 3). (G) Colocalization of BST2+ cells with MKs (PF4+) in immunofluorescence-stained whole-mount BMs in panel D (n = 3). (H) Scheme of the pDC and MK coculture experimental setup. (I) IFN-β content in supernatant media of wild-type pDC with control (not detected [ND]) or St3gal1MK−/− (red) cultured MKs after 18 hours of coculture. Addition of anti–Siglec H mAb 440c is indicated . The effect of anti–Siglec H on IFN-β production was not measured (NM) with control MKs. (J) Immunofluorescence staining of wild-type (or control) pDCs cocultured with control (left) or St3gal1MK−/− (right) MKs. MKs and pDCs were identified by using an anti-PF4 (green) and anti-BST2 (red) mAb, respectively. Scale bars, 30 μm. (K) Quantification of percentage of MKs that form proplatelets (proPLTs) as determined by in vitro culture. Control (blue) and St3gal1MK−/−(red) MKs differentiated BM-derived cells cultured in the absence (left panel) or presence (right bars) of control pDCs. For comparison of 2 groups over a treatment period (A-B), multiple Student t tests with Holm-Šídák method correction was performed. Comparison of control vs St3gal1MK−/− in black; St3gal1MK−/− vs St3gal1MK−/− isotype control in salmon. For comparison of 2 groups (D-E,G), a 2-tailed, unpaired Student t test was performed. For multiple comparisons (I), 1-way analysis of variance with Tukey’s multiple comparison test was performed. *P < .05, **P < .01. Only significant changes are annotated. DAPI, 4′,6-diamidino-2-phenylindole; FLT3L, FLT3 ligand; ns, not significant.
pDCs inhibit thrombopoiesis primarily through secretion of IFN-1 mediated by Siglec H. Platelet count during treatment with IFNAR blockade (A, n = 12) or anti–Siglec H mAb 440c (B, n = 6-7) in control (blue) and St3gal1MK−/− (red) mice. Injection of isotype controls into St3gal1MK−/− (gray, n = 5). Injection tempo indicated as a light blue dotted line. (C) Quantification of BM pDCs from control and St3gal1MK−/− mice evaluated by using flow cytometry (Lin–, BST2+, CD11c+, Siglech+). (D) BM pDCs were isolated with negative selection magnetic cell sorting kit and evaluated for BST2 reactivity by using flow cytometry. (E) A section of immunofluorescence staining of whole-mount BMs from control and St3gal1MK−/− mice using mAb to BST2. Scale bars, 20 μm. (F) Quantification of BST2+ cells in immunofluorescence stained whole-mount BMs in panel D (n = 3). (G) Colocalization of BST2+ cells with MKs (PF4+) in immunofluorescence-stained whole-mount BMs in panel D (n = 3). (H) Scheme of the pDC and MK coculture experimental setup. (I) IFN-β content in supernatant media of wild-type pDC with control (not detected [ND]) or St3gal1MK−/− (red) cultured MKs after 18 hours of coculture. Addition of anti–Siglec H mAb 440c is indicated . The effect of anti–Siglec H on IFN-β production was not measured (NM) with control MKs. (J) Immunofluorescence staining of wild-type (or control) pDCs cocultured with control (left) or St3gal1MK−/− (right) MKs. MKs and pDCs were identified by using an anti-PF4 (green) and anti-BST2 (red) mAb, respectively. Scale bars, 30 μm. (K) Quantification of percentage of MKs that form proplatelets (proPLTs) as determined by in vitro culture. Control (blue) and St3gal1MK−/−(red) MKs differentiated BM-derived cells cultured in the absence (left panel) or presence (right bars) of control pDCs. For comparison of 2 groups over a treatment period (A-B), multiple Student t tests with Holm-Šídák method correction was performed. Comparison of control vs St3gal1MK−/− in black; St3gal1MK−/− vs St3gal1MK−/− isotype control in salmon. For comparison of 2 groups (D-E,G), a 2-tailed, unpaired Student t test was performed. For multiple comparisons (I), 1-way analysis of variance with Tukey’s multiple comparison test was performed. *P < .05, **P < .01. Only significant changes are annotated. DAPI, 4′,6-diamidino-2-phenylindole; FLT3L, FLT3 ligand; ns, not significant.
A 35% increase of pDCs in St3gal1MK−/− BMs was measured by using flow cytometry (Figure 7C). BST2 is constitutively expressed on pDCs, but its expression is induced on other cells after IFN exposure.52 Isolated St3gal1MK−/− pDCs had a bimodal distribution of BST2, suggesting higher BST2 expression levels compared with control (Figure 7D). BM immunofluorescence also showed a twofold increase in St3gal1MK−/− BST2-positive cells as well as MK colocalization (Figure 7E-G). IFN-β levels were slightly higher in St3gal1MK−/− BMs compared with control mice (Table 2); however, LSK cells and MkP progenitor numbers remained normal, suggesting that the low levels of IFN-I do not have a global effect on MK maturation and differentiation.53 The increase of BST2 expression and pDCs in St3gal1MK−/− BM pDCs, and amelioration of platelet count by Siglec H mAb and via IFNAR inhibition, point to a partial role of pDC activation and IFN-I in inhibiting platelet release.
pDCs inhibit platelet production by ST3Gal1MK−/− MKs in vitro
To further investigate the role of pDC in regulating thrombopoiesis and stimulating IFN-I production, cocultures of pDCs and MKs were performed. Differentiation of primary wild-type BM with FLT3 ligand enforces pDC differentiation. Primary pDCs were cocultured with BM MKs for 18 hours (Figure 7H). Wild-type pDCs cocultured with St3gal1MK−/− MKs secreted IFN-β but not when cocultured with control MKs (Figure 7I). IFN-α secretion was not detectable (not shown). Addition of anti–Siglec H mAb 440c to pDC-St3gal1MK−/− MK cocultures decreased IFN-β secretion by 50%.
The cocultured pDCs and MKs were fixed and stained for MKs (PF4) and pDCs (BST2). In the absence of pDCs, BM-derived control or St3gal1MK−/− MKs show the same propensity for formation of proplatelets (Figure 7K). In contrast, in the presence of wild-type pDCs, St3gal1MK−/− BM-derived MKs had a decreased propensity to form proplatelets, suggesting that the presence of immune cells, including pDCs, inhibit the formation of proplatelets likely via secretion of IFN-I. Although pDCs increase proplatelet formation by ∼30% when added to wild-type MKs, the role of pDCs in proplatelet production when MKs are normally glycosylated remains unclear. Rather, the data indicate that the proposed suppressive role of pDC-like immune cells is limited to the model of St3gal1MK−/− mice. St3gal1MK−/− MKs were strongly inundated with BST2 staining compared with control MKs, suggesting stimulation with IFN-I via IFNAR expressed by MKs (Figure 7J). The data show IFN-I likely secreted by cocultured pDCs affects BST2 expression by MKs and proplatelet formation in St3gal1MK−/− MKs in vitro.
Discussion
The current analysis of pediatric ITP plasma samples showed increased anti-sialylated and desialylated-TF antigen antibody representation, indicating increased immune response toward both structures. Our data further reveal that platelet production is regulated by Sia moieties on MKs and their interaction with Sia receptors (Siglecs) on pDCs, including Siglec H, which surveil for sialylation changes. Loss of Sia and subsequent exposure of the TF antigen on MK surface triggers IFN-I secretion by immune cells characterized with pDC signature and inhibition of platelet release contributing to the thrombocytopenia in St3gal1MK−/− mice.
ITP in adult and pediatric patients has been associated with loss of sialic acid moieties on platelets.17,18,54 Administration of the sialidase inhibitor oseltamivir elevates platelet counts in healthy and thrombocytopenic patients, including those with ITP, labeling Sia as 1 determinant of platelet count.14-16 The mechanisms of sialic acid loss remain elusive. Microbes use neuraminidases as part of their pathogenicity,55 and bacterial or viral infection often precedes cases of acute pediatric ITP.10 It is tempting to speculate that pathogen-derived neuraminidases deplete MKs of sialic acids and expose the typically cryptic TF antigen to elicit immune response and thrombocytopenia. In hemolytic uremic syndrome, bacterial neuraminidases can expose TF antigen on platelets.56,57 The mechanisms of thrombocytopenia in hemolytic uremic syndrome remain unknown, although autoantibodies to TF antigen are not likely a cause.7 Our data also do not provide evidence for autoantibodies in causing platelet clearance in St3gal1MK−/− mice or patients with ITP.
In addition to antibody-mediated platelet clearance in ITP, cDCs and pDCs contribute to ITP progression and pathology. cDCs contribute to ITP by presenting antigens to T cells,58 whereas pDCs support monocyte FcγR activation and T-cell stimulatory capacity via increased IFN-I and IFN response to cause ITP.26 Indeed, pDCs are specialized IFN-I producers after virus recognition and self-nucleic acids.35 IFN-I secretion can inhibit proplatelet formation and platelet release.45 Our data support a partial role of pDCs in the inhibition of platelet release via IFN-I secretion. Although human pDCs are CD4+, the phenotypic expression of CD4 on mouse pDCs is contingent on locale, and even then, varied.59 Recent findings and our data using scRNAseq clearly showed Cd4+ transcripts in mouse BM pDCs.44 This notion is further supported by the positive effect of CD4+ cell depletion on platelet count in the thrombocytopenic St3gal1MK−/− mice.
Our data support the notion that immune cells with a pDC-like signature, or perhaps pDCs directly, contribute to inhibition of platelet release via IFN-I secretion. This notion is supported by the following: (1) blockade of IFN-I receptor IFNAR in St3gal1MK−/− mice increased the circulating platelet count; (2) pDC IFN-I secretion inhibited proplatelet formation in vitro; and (3) analysis of scRNAseq data revealed an increase in IFN production genes and enrichment in IFN-α/β gene sets in clusters identified as pDCs. Acute IFN-I inflammation induced by injection with polyinosinic:polycytidylic acid and lipopolysaccharide accentuates hematopoietic stem cell bias toward the megakaryocytic lineage, supporting megakaryopoiesis.53 Lack of a global inflammatory signature in the St3gal1MK−/− mice and normal LSK expression indicates that the acute IFN-I inflammation events differ from the chronic exposure of TF antigen and a more localized IFN-I response.
Siglecs regulate innate and adaptive immune systems.60 Unlike most Siglecs that use immunoreceptor tyrosine-based inhibitory motifs, Siglec H associates with DNAX-activation protein 12 (DAP12) upstream of myeloid differentiation primary response 88 protein (MYD88) and tyrosine kinases Lyn and Syk to inhibit IFN-I response in response to Toll-like receptor 9 agonists such as CpG oligonucleotides.51,61,62 The increase of Tlr9, Lyn, and Syk transcripts in sel-CD4+St3gal1MK−/− BM cells suggest Siglec H pathway activation in St3gal1MK−/− mice. Siglec H blockade decreases IFN-I secretion by pDCs in vitro, providing some credence for the role of Siglec H in thrombopoiesis limited to the St3gal1MK−/− mouse model and do not provide Sia as a direct binding partner for Siglec H.63
Common lymphoid progenitors are impaired by Jak3, interleukin-7, and interleukin-7R deficiency.43,64-66 Recovery of St3gal1MK−/− platelet count by Jak3 knockout (DKO) exceeded the platelet count recovery when St3gal1MK−/− mice were treated with anti–Siglec H antibodies or IFNAR blockade. pDCs are heterogeneous with overarching common characteristics that include lymphoid markers; thus, it is possible that Jak3 deletion may affect pDCs,42,44,67 but our data clearly show that additional immune cells and cytokines contribute to the measured thrombocytopenia. This notion is reinforced by the newly formed cluster 5b with pDC with immunoglobulin rearrangement gene transcript Igkc and Ighm signatures in response to a chronic exposure of the TF antigen, possibly bridging innate and adaptive immunity response. In addition, inhibition of IFNAR and Siglec H only partially rescued platelet count in St3gal1MK−/− mice, indicating a more complex role and involvement of immune cells, in addition to pDCs, in fully regulating platelet production and count.
In summary, our data show that immune cells with a pDC-like signature, and perhaps pDCs, partly regulate platelet release through IFN-I secretion by detecting MK O-glycan sialylation status in mice. They shed new light on the role of altered sialylation in patients with thrombocytopenia.
Acknowledgments
The authors gratefully thank H. Falet, W. Cui, and M. Sola-Visner for their helpful discussion and insight, U. Mandell for the anti–TF antigen antibody, and Jon Wieser for his Imaris software analysis expertise.
This work was supported by the National Institutes of Health (NIH), National Heart, Lung, and Blood Institute (NHLBI) (grants R01 HL089224 and P01 HL107146, K.M.H.; K12 HL141954, Project Leader K.M.H.), and BRI Director’s Fellowship Award (M.M.L.-S.). The electron microscopy studies were supported by grants from the Canadian Institutes of Health Research (PJT156095 and PJT153168) and the macrophage studies by the NIH, (National Institute of Allergy and Infectious Diseases (NIAID) (R01, AI1265596); and the NIH, NHLBI, (R01 HL141815). The Jak3-null mice studies were supported by the NIH (NIAID, R01 AI079087; and the NHLBI; R01 HL130724). The Core laboratories at the Blood Research Institute and the Medical College of Wisconsin Genomic Sciences and Precision Medicine Center provided key resources. This work benefitted from data assembled by the ImmGen consortium.
Authorship
Contribution: M.M.L.-S. designed and performed research; collected, analyzed, and interpreted results; and cowrote the manuscript; R.T.B. performed the computational biological analysis; R.G., S.G., L.R., Y.Z., and S.H.G. collected, analyzed, and interpreted results; W.H.A.K. performed the electron microscopy studies; R.A. contributed to the macrophage studies; T.O.K. and J.M.D. contributed to the pediatric ITP patient studies; D.W. designed research, interpreted results, and contributed to the Jak3-null mice studies; K.M.H. designed research, analyzed and interpreted results, and cowrote the manuscript; and authors read, contributed, and approved the writing of the manuscript.
Conflict-of-interest disclosure: The authors declare no competing financial interests.
Correspondence: Karin M. Hoffmeister, 8727 W. Watertown Plank Rd., Wauwatosa, WI 53226; e-mail: khoffmeister@versiti.org; and Melissa M. Lee-Sundlov, 8727 W. Watertown Plank Rd., Wauwatosa, WI 53226; e-mail: mleesundlov@versiti.org.
The data reported in this article have been deposited in the Gene Expression Omnibus database (accession number GSE179067).
The online version of this article contains a data supplement.
There is a Blood Commentary on this article in this issue.
The publication costs of this article were defrayed in part by page charge payment. Therefore, and solely to indicate this fact, this article is hereby marked “advertisement” in accordance with 18 USC section 1734.

This feature is available to Subscribers Only
Sign In or Create an Account Close Modal