

Key Points
The hedgehog pathway is activated in neoplastic MCs and cooperates with the constitutively activated KIT in the onset of mastocytosis.
Hedgehog inhibitors suppress neoplastic MC proliferation by inhibiting hedgehog and KIT downstream signaling pathways.

Abstract
Mastocytosis is a heterogeneous disease characterized by an abnormal accumulation of mast cells (MCs) in 1 or several organs. Although a somatic KIT D816V mutation is detected in ∼85% of patients, attempts to demonstrate its oncogenic effect alone have repeatedly failed, suggesting that additional pathways are involved in MC transformation. From 3 children presenting with both Greig cephalopolysyndactyly syndrome (GCPS, Mendelian Inheritance in Man [175700]) and congenital mastocytosis, we demonstrated the involvement of the hedgehog (Hh) pathway in mastocytosis. GCPS is an extremely rare syndrome resulting from haploinsufficiency of GLI3, the major repressor of Hh family members. From these familial cases of mastocytosis, we demonstrate that the Hh pathway is barely active in normal primary MCs and is overactive in neoplastic MCs. GLI3 and KIT mutations had a synergistic, tumorigenic effect on the onset of mastocytosis in a GCPS mouse model. Finally, Hh inhibitors suppressed neoplastic MC proliferation in vitro and extend the survival time of mice with aggressive systemic mastocytosis (ASM). This work revealed, for the first time, the involvement of Hh signaling in the pathophysiology of mastocytosis and demonstrated the cooperative effects of the KIT and Hh oncogenic pathways in mice with ASM, leading to the identification of new promising therapeutic targets.
Introduction
Mastocytosis is a hematological malignancy characterized by a clonal accumulation of mast cells (MCs) in 1 or more organs. The major subtypes of systemic mastocytosis (SM) are indolent SM (ISM) and advanced SM (advSM), with the latter comprising aggressive SM (ASM), SM associated with hematologic neoplasm, and MC leukemia (MCL).1,2 Neoplastic MCs of 85% to 90% of patients harbor a KIT D816V mutation, leading to the constitutive activation of the tyrosine kinase receptor KIT and thus to proliferation of the cells, independent of stem cell factor (SCF).3 Consequently, tyrosine kinase inhibitors (TKIs) have been used to treat advSM. However, TKIs were, at best, partially effective, suggesting the involvement of other factors in the pathophysiology of the disease.4,5 Further arguments support this hypothesis: (1) there is a broad heterogeneity of clinical symptoms in patients carrying the same KIT D816V mutation; (2) mice in a transgenic model expressing KIT D814V in MCs did not develop ASM and rarely ISM; and (3) among the 100 reported familial cases of mastocytosis, only a few presented with germline KIT mutations (but never KIT D816V, because it induces early embryonic lethality).6,7
AdvSM is associated with additional mutations in epigenetic regulators such as TET2, ASXL1, EZH2, or RUNX1 that promote disease heterogeneity and have a negative impact on the outcome.8-13
Therefore, although present in virtually all patients with mastocytosis, KIT mutations cannot fully account for the phenotypic heterogeneity observed. To identify additional genes potentially involved in the onset of mastocytosis, we focused on familial cases or rare congenital ASM. We identified children presenting with both the very rare Greig cephalopolysyndactyly (GCPS, Mendelian Inheritance in Man 175700) syndrome and mastocytosis. GCPS is an autosomal dominant disorder characterized by macrocephaly and/or polysyndactyly caused by a haploinsufficient heterozygous mutation in GLI3 that affects the hedgehog (Hh) pathway.14-18 To our knowledge, the Hh pathway has never been studied in MCs or mastocytosis.
Hh is a key signaling pathway involved in embryonic development and stem cell homeostasis. Canonical Hh signaling involves a complex network of proteins. Upon SHH, IHH, or DHH ligands binding to their receptor, PTCH1 and SMO are released, leading to the translocation of GLI transcription factor (TF) activators into the nucleus. This activates a plethora of target genes such as AKT, BCL2, c-Myc and cyclin D, all of which are involved in cell proliferation, survival, and self-renewal. The GLI TF family includes GLI1, GLI2, and GLI3. GLI1 and GLI2 are the main activators, whereas GLI3 has a dual role in that it behaves as a repressor in its short form “GLI3R.” When Hh signaling is “off,” GLI2 and GLI3 undergo partial proteasome-mediated proteolysis, generating truncated inhibitory forms that repress target genes. Multiple oncogenic pathways can induce GLIs, independent of PTCH1 and SMO in noncanonical Hh pathways.19,20
As Hh activation has frequently been associated with malignancies, we postulated that mutation in the GLI3 gene is involved in the pathophysiology of mastocytosis. Deciphering the molecular mechanisms leading to mastocytosis in this rare case may help elucidate the pathophysiology of common adult SM.
Methods
A full description of the methods used is in the supplemental Appendix (available on the Blood Web site).
Clinical investigations were conducted according to the principles of the Declaration of Helsinki and approved by the local ethics committee. Written informed consents were obtained for genetic studies and for the photographs and radiograph of patient 1. Animal experiments were performed in accordance with guidelines established by the Institutional Animal Committee (18445-2019011411048971).
Molecular genetics
Genomic DNA was extracted from the peripheral blood. Suspected GLI3 variants were confirmed by Sanger sequencing. DNA from patients 1, 2, and 3 and their parents underwent whole-exome sequencing. All results are available on ERIS (IntegraGen, Evry, France).
Primary fibroblast culture
Primary fibroblasts were obtained from punch biopsies from patient 1 and 3 healthy subjects.
Human MC lines
We used 4 ROSA MC lines originally derived from umbilical cord blood cells: (1) ROSA expressing a KIT wild-type (WT) receptor; (2) ROSA expressing the KIT D816V+ receptor; (3) ROSA expressing KIT with a pediatric Delta417-419InsY mutation; (4) ROSA expressing KIT/D816V and secreting Gaussia luciferase (gluc).21 Only ROSA KIT WT cells are SCF dependent. Two other SCF-independent MC lines were used: (1) HMC1.1 cells carrying a KIT G560V mutation and established from a patient with MCL, and (2) HMC1.2 cells derived from HMC1.1 that spontaneously developed a KIT D816V in addition to the original KIT G560V.22
Primary MCs
We generated MCs from umbilical cord blood CD34+ cells in Iscove’s modified Dulbecco’s medium supplemented with 1% bovine serum albumin in the presence of human SCF (100 ng/mL); interleukin-6 (50 ng/mL); and, during the first week, IL3 (1 ng/mL).
Whole bone marrow (WBM) from patients representing different mastocytosis subtypes were either collected freshly or from nitrogen-frozen vials. Patients and their KIT mutational status are listed in supplemental Table 1. MCs from WBM of MCL2, -3, and -4 were sorted by fluorescence activated cell sorting (FACS) based on FcεR1 and CD117 staining.
In vitro cell proliferation measurement
Time-course proliferation was measured on (1) MC lines (HMC1.1, HMC1.2, ROSA KIT WT/D816V/Delta417-419InsY) and primary MCs of the patient with ASM KIT D816V+ (ASM1) treated with sonidegib (1, 5, 10 and 20 µM for the HMC lines; 20 and 20 µM for the primary MCs and 1, 5,10, 20 and 40 µM for the ROSA lines) or dimethyl sulfoxide (DMSO); (2) HMC1.1, HMC1.2, and primary MCs of the ASM1 patient treated with sonidegib (10 or 20 μM), with or without PKC412 (150 or 200 nM); (3) the same MC lines and primary MCs of the patient with a KIT WT MCL (MCL2) treated with GANT61 (5, 10, and 20 μM) or vismodegib (5, 10 and 20 µM for the primary MCs and 5, 10, 20 and 40 µM for the MC lines). All drugs were from Selleckchem (Houston, TX). The time course of proliferation was determined on HMC1.2 cells transduced with lentiviral vectors expressing GLI3R-tdTomato or tdTomato alone. Cell confluence was measured twice a day over 6 days with a live-cell imaging system (IncuCyte; Essen BioScience). Proliferation (as the percentage of confluence) was plotted against time (in hours).
In vitro cell viability analysis
7-AAD staining was used to assess cell viability by FACS. Cell death of HMC1.1, HMC1.2, ROSA KIT WT/D816V/Delta417-419InsY, primary MCs sorted from a patient with an MCL KIT WT (MCL2) and from a patient with a KIT D816V+ ASM (ASM1) treated with increasing doses of sonidegib (Hh pathway inhibitor), with or without PKC412 (nonspecific c-KIT D816V kinase inhibitor) or GANT61 (Hh pathway inhibitor) was measured after 48 hours of treatment.
Immunoblot analysis
HMC cell lines and primary MCs from patient ASM1 were treated with sonidegib (5, 10, and 20 μM) or DMSO for 48 hours. Western blot analysis was performed with anti-GLI1, GLI2, GLI3, and BCL2. Samples for western analysis included ROSA KIT WT and ROSA KIT D816V cell lines treated with GANT61 (5, 10, and 20 μM) or DMSO for 48 hours and probed with anti-panAKT, mTOR, c-Myc, caspase 3, bcl-xL, and BCL2 antibodies. Western blot analysis was also performed on starved ROSA KIT WT stimulated with 100 ng/mL SCF for 6 and 24 hours with anti-GLI1, -GLI3, and -BCL2 antibodies.
Lentiviral vector production and cell transduction
pRRSLIN-GLI3R-tdTomato and pRRSLIN-control-tdTomato were produced with the pRRSLIN-MND-PGK-tdTomato-WPRE backbone (a gift from François Moreau Gaudry, CHU Bordeaux, Bordeaux, France). pRRL-KIT WT-GFP and pRRL-KIT D816V-GFP plasmids had been produced by our group in previous work.23 After virus production, HMC1.2 cells were transduced with tdTomato lentiviral vectors; positive cells were sorted 72 hours later based on tdTomato staining.
WBM from GLI3 WT and GLI3 Xt+/− mice and sorted MCs derived from WBM from Gli3 WT or Gli3 Xt+/− mice were transduced with KIT D816V-GFP or KIT WT-GFP. Transduction efficacy was assessed 72 hours later based on GFP staining.
Transcriptomic analyses
RNA sequencing (RNA-seq) was performed on RNA extracted from HMC1.2 cells transduced with pRRSLIN-GLI3R-tdTomato or pRRSLIN-control-tdTomato. RNA-seq libraries were prepared using the Universal Plus mRNA-Seq Kit (Nugen). cDNAs were sequenced on a NovaSeq6000 from Illumina. Functional analyses of the resulting lists of genes were performed with Ingenuity Pathway Analysis (IPA)..
GCPS mouse model
C57BL/6J Gli3 WT and Gli3 Xt+/− mice were provided by one of the authors (U.R.).24 WBM from Gli3 WT and Gli3 Xt+/− mice were differentiated into bone marrow MCs (BMMCs) in the presence of 10 ng/mL murine IL-3 ± 10 ng/mL murine SCF (Miltenyi Biotec).WBM of Gli3 WT and Gli3 Xt+/− mice were transduced with lentiviruses expressing KIT D816V-GFP or KIT WT-GFP and cultured in the same medium as BMMCs.
Xenogeneic transplantation of ROSA KIT/D816V-gluc cells in NOD-SCID IL-2R γ−/− mice
Ten million ROSA KIT/D816V-gluc cells were injected into the tail vein of NOD-SCID IL-2R γ−/− (NSG) mice (n = 33 per group) 24 hours after 1.25 Gy X-ray irradiation. Seven weeks after transplantation, xenografted mice were randomly assigned into 2 groups for treatment as follows: a group of mice treated with sonidegib at 80 mg/kg per mouse per day, 5 days a week, and a group of mice treated with placebo (water). Treatment was orally administered daily for 8 weeks. Animal protocol was approved by the local Animal Ethics Committee (B75-10-08).
Measurement of ex vivo gluc activity in peripheral blood
Engraftment was evaluated weekly by measuring luciferase activity in the peripheral blood of the mice (data not shown). Plasma sample (10 μL) was mixed with 100 μL of the gluc substrate coelenterazine (50 μg/mL), followed by the immediate acquisition of photon counts with a luminometer.
Statistical analysis
Quantitative data are presented as the mean ± standard deviation. Statistical significance was determined by using unpaired 2-sample Student t tests. All data were normally distributed, and variance was similar in groups that were compared in statistical tests. The results were considered statistically significant if P < .05.
Results
The Hh signaling pathway is active in abnormal MCs
We identified 3 children from 2 unrelated families with GCPS and mastocytosis. Patient 1 presented with congenital KIT D816V+ ASM involving the skin, BM, liver, spleen, and digestive tract and associated with macrocephaly, syndactyly of the first toe, and duplication of the fifth finger (Figure 1A; supplemental Figure 1). Patients 2 and 3 are siblings and presented with congenital maculopapular cutaneous mastocytosis and duplication of the fifth finger; KIT status could not be assessed in the neoplastic MCs of the 2 children. Germline GLI3 mutations are shown in Figure 1B-C. Germline KIT mutations were not identified in either family. Patient 1 did not bear additional mutations in ASXL1, RUNX, or TET2 genes frequently observed in sporadic advSM.

Clinical and biological features of a patient with GCPS and CM. (A) Patient 1: diffuse CM, macrocephaly, and polydactyly. (B) Pedigrees and mutations of the 3 patients. (C) Structure of GLI3 protein. (D) Immunoblots of GLI3 with fibroblast extracts from patient 1 and 2 healthy controls; relative quantification of GLI3A/GLI3R ratio. (E) Histology showing MC infiltration throughout the dermis of patient 1 (a). Cell infiltrates are positive for CD117 (b), negative or weakly positive for GLI3 (c), positive for GLI1 notably in the nucleus (d), weakly positive for GLI2 (e), and strongly positive for SHH (f). (Fa-f) Histology showing MC infiltration throughout the digestive tract of patient 1 and immunostaining with the same antibodies as for skin. (E-F) Original magnification, ×10 and ×30 (insets).
Clinical and biological features of a patient with GCPS and CM. (A) Patient 1: diffuse CM, macrocephaly, and polydactyly. (B) Pedigrees and mutations of the 3 patients. (C) Structure of GLI3 protein. (D) Immunoblots of GLI3 with fibroblast extracts from patient 1 and 2 healthy controls; relative quantification of GLI3A/GLI3R ratio. (E) Histology showing MC infiltration throughout the dermis of patient 1 (a). Cell infiltrates are positive for CD117 (b), negative or weakly positive for GLI3 (c), positive for GLI1 notably in the nucleus (d), weakly positive for GLI2 (e), and strongly positive for SHH (f). (Fa-f) Histology showing MC infiltration throughout the digestive tract of patient 1 and immunostaining with the same antibodies as for skin. (E-F) Original magnification, ×10 and ×30 (insets).
Primary fibroblasts derived from a skin biopsy of patient 1 (Fib-P1) grew faster than control fibroblasts (CTL-Fib; data not shown). Fib-P1 did not show signs of senescence before passage 35 whereas CTL-Fib stopped proliferating at passages 14 to 16, suggesting that the GLI3 mutation contributes to immortalization and cancer (supplemental Figure 2). The GLI3 mutation was haploinsufficient, leading to lower expression of the long-activating form (GLI3A) and the short repressor form (GLI3R), but with a significantly higher GLI3A/GLI3R ratio, compared with the control (P = .011; Figure 1D). This result supports the higher proliferating and survival capabilities of Fib-P1. Skin sections from patient 1 showed strong expression of CD117/KIT, thus indicating marked infiltration by MCs. These cells expressed high levels of SHH and GLI1, moderate levels of GLI2, and low levels of GLI3, confirming the activation of Hh signaling (Figure 1E). Stained digestive tract sections also showed marked infiltration by MCs strongly expressing CD117, tryptase, and GLI2, a moderate level of GLI1, and no GLI3. In contrast to the skin, lower SHH was detected in this microenvironment (Figure 1F). Thus, in this patient, SHH overexpression of MC-infiltrated tissues was suggestive of autocrine and/or paracrine activation of the canonical Hh pathway in neoplastic MCs.15
In sporadic advanced mastocytosis we observed stronger SHH labeling in the microenvironment of the highly infiltrated BM by MCs, compared with weakly infiltrated ISM (supplemental Figure 3).
We assessed Hh expression in sporadic SM by quantitative reverse-transcription polymerase chain reaction on samples isolated from WBM of patients representing different mastocytosis subtypes (supplemental Table 1), which showed variable but consistent increased GLI1, GLI2, and GLI3) expression in the MCL (n = 4), compared with the ASM (n = 2) and the ISM (n = 3) or in the control BM from congenital mastocytosis (CM) where only the skin MCs are abnormal (Figure 2A), consistent with Hh activation in cancer cells.25 We did not detect significant Hh expression in ISM, because either indolent forms do not strongly activate the Hh pathway or the infiltration by abnormal MCs was too weak to enable GLI TF detection.

The Hh signaling pathway is active in MC lines and in primary MCs from patients with MCL. (A) Relative gene expression of GLI1, GLI2, and GLI3 in WBM from patients with KIT A502_Y503dup MCL (MCL1), KIT WT MCL (MCL2), KIT D816V MCL (MCL3), KIT S501_A502dup MCL (MCL4), KIT D816V ASM (ASM1), or KIT WT ASM (ASM2) and from 3 patients with KIT D816V ISM (ISM1-3) and from 1 patient with KIT D816V CM (CM). (B) Immunofluorescence analysis of primary MCs from patients with MCL2, MCL3, or MCL4 and from 2 healthy controls. Note the increase of GLI1 or GLI2 and GLI3 in patients with MCL compared with healthy controls. (C) Quantification of GLI1, GLI2, and GLI3 expression in all patients. (D) Immunoblots with protein extracts from cord blood–derived MCs (Primary MC1 and MC2) and ROSA KIT D816V, stained with GLI1, GLI12, and GLI13 antibodies. (E) Immunoblots of ROSA and HMC1 cell lines stained with GLI1, GLI12, and GLI13 antibodies. (F) Immunoblots of ROSA KIT WT cells cultured in different conditions: standard, without (−) or with (+) SCF, and stained with GLI1, GLI3, and Bcl2. (G) Relative gene expression of GLI1 and KIT in HMC1.2 stimulated with SAG. (H) Relative quantification of GLI3A/GLI3R ratio. *P < .05, **P < .01, ***P < .001, ****P < .0001. PC, proteolytic cleavage domain; TA, transactivation domains; ZNF, zinc finger domain.
The Hh signaling pathway is active in MC lines and in primary MCs from patients with MCL. (A) Relative gene expression of GLI1, GLI2, and GLI3 in WBM from patients with KIT A502_Y503dup MCL (MCL1), KIT WT MCL (MCL2), KIT D816V MCL (MCL3), KIT S501_A502dup MCL (MCL4), KIT D816V ASM (ASM1), or KIT WT ASM (ASM2) and from 3 patients with KIT D816V ISM (ISM1-3) and from 1 patient with KIT D816V CM (CM). (B) Immunofluorescence analysis of primary MCs from patients with MCL2, MCL3, or MCL4 and from 2 healthy controls. Note the increase of GLI1 or GLI2 and GLI3 in patients with MCL compared with healthy controls. (C) Quantification of GLI1, GLI2, and GLI3 expression in all patients. (D) Immunoblots with protein extracts from cord blood–derived MCs (Primary MC1 and MC2) and ROSA KIT D816V, stained with GLI1, GLI12, and GLI13 antibodies. (E) Immunoblots of ROSA and HMC1 cell lines stained with GLI1, GLI12, and GLI13 antibodies. (F) Immunoblots of ROSA KIT WT cells cultured in different conditions: standard, without (−) or with (+) SCF, and stained with GLI1, GLI3, and Bcl2. (G) Relative gene expression of GLI1 and KIT in HMC1.2 stimulated with SAG. (H) Relative quantification of GLI3A/GLI3R ratio. *P < .05, **P < .01, ***P < .001, ****P < .0001. PC, proteolytic cleavage domain; TA, transactivation domains; ZNF, zinc finger domain.
We then performed immunofluorescence staining on MCs either sorted from 3 patients with MCL or derived from CD34+ (n = 2) and showed stronger GLI1, GLI2, and GLI3 expression in the nucleus and/or cytoplasm of the patient MCs than in the control, corroborating the results of quantitative reverse-transcription polymerase chain reaction (Figure 2B-C). None of the available GLI3 antibodies can distinguish between GLI3A and GLI3R by immunofluorescence; thus, we can only assume that the active GLI3A form was predominantly labeled. Although western blots were not feasible on the few sorted cells from patients, the weak expression of GLI1, GLI2A, and GLI3A activators and the stronger expression of GLI2R and GLI3R repressors in control MCs was confirmed by western blot analysis, which was in agreement with their low proliferation rate (Figure 2D). Because patient cell availability was unpredictable and samples were scarce, we performed most of the molecular studies on human MC lines. ROSA KIT D816V and ROSA KIT Delta417-419InsY lines carrying adult and pediatric KIT mutations, respectively, expressed more GLI1, GLI2, and GLI3A than ROSA KIT WT cells, suggesting that GLI TFs may be KIT targets and that constitutively activated KIT is more prone to transactivate GLI TFs (Figure 2E). In agreement with this hypothesis, stimulation of ROSA KIT WT with SCF induced GLI1, GLI3, and BCL2 (a GLI1 target gene) expression (Figure 2F). Stimulation with SAG, a canonical effector of Hh signaling, activated GLI1 and KIT transcription (Figure 2G). These results demonstrate that the SCF/KIT axis activates GLI genes, and that constitutively activated KIT D816V and KIT Delta417-419InsY mutants overactivate them. KIT mutations enhanced stimulation of GLI expression differently: KIT Delta417-419InsY was more efficient than KIT D816V in ROSA cells, whereas KIT V560G and KIT D816V in HMC1.2 cells were more efficient than KIT V560G alone in HMC1.1 cells (Figure 2E), consistent with their proliferation rates. GLI TF levels appear to correlate with the GLI3A/GLI3R ratio, which in turn was dependent on the KIT mutation (Figure 2E,H). Similar to skin MCs from patient 1, ROSA KIT D816V cells, but not ROSA KIT WT cells, expressed SHH messenger RNA, supporting additional canonical Hh pathway activation via an autocrine process (supplemental Figure 4).
Mutated GLI3 synergizes with KIT D816V to promote tumorigenicity
To unequivocally establish that GLI3 haploinsufficiency contributes to mastocytosis, we used a GCPS mouse model (Gli3Xt-J/Xt-J).24 Gli3 Xt+/− mice expressed less GLI3A and GLI3R and displayed a higher GLI3A/GLI3R ratio compared with Gli3 WT mice (Figure 3A). Although Gli3 Xt+/− and Gli3 WT BMMCs proliferated similarly in the presence of 10 ng/mL IL-3, the addition of 10 ng/mL SCF induced dramatic proliferation of Gli3 Xt+/− BMMCs compared with Gli3 WT BMMCs (Figure 3B). Thus, GLI3 haploinsufficiency led to a higher GLI3A/GLI3R ratio and contributed to excessive proliferation of MCs in vitro when SCF was present, corroborating the high proliferation rate observed with Fib-P1. In line with this, Gli3 Xt+/− BMMCs expressed more p-AKT and less p21 than Gli3 WT BMMCs (Figure 3C). To replicate genetic mutations from patient 1 in murine cells, we transduced Gli3 Xt+/− and Gli3 WT BMMCs with lentiviral vectors expressing KIT D816V or KIT WT. Gli3 Xt+/−KIT D816V BMMCs proliferated faster than all other BMMCs, indicating that GLI3 and KIT mutations have a synergistic tumorigenic effect in MCs (Figure 3D). We obtained similar results when WBM was transduced with the KIT vectors before MC differentiation, demonstrating that MC transformation develops regardless of the stage that KIT mutation occurs (Figure 3E). Interestingly, as observed in Fib-P1, Gli3 Xt+/−KIT D816V and Gli3 Xt+/−KIT WT BMMCs tended to resist senescence better than their respective counterparts (supplemental Figure 5). This finding suggests that GLI3 haploinsufficiency and high GLI3A/GLI3R ratio inhibit apoptosis and enhance proliferation, especially when KIT is mutated, and that GLI3R acts as an antitumorigenic factor.

Mutated GLI3 and KIT D816V act synergistically. (A) Immunoblots of BMMCs from Gli3 WT or Gli3 Xt+/− mice stained with GLI3 antibody; relative quantification of the GLI3A/GLI3R ratio. (B) Proliferation of WBM from Gli3 WT and Gli3 Xt+/− mice and differentiation into MCs with mIL3 +/− mSCF. P-values were calculated at day 21. (C) Immunoblots of BMMCs in mIL3+mSCF, stained with P-AKT, AKT, and p21 antibodies. (D) Time-course of the proliferation of BMMCs after transduction with KIT D816V-GFP or KIT WT-GFP lentiviral vectors. (E) Proliferation of WBM from Gli3 WT and Gli3 Xt+/− mice and differentiation into MCs after transduction with KIT D816V-GFP or KIT WT-GFP vectors. Data are from 3 independent experiments. *P < .05; **P < .01; ***P < .001.
Mutated GLI3 and KIT D816V act synergistically. (A) Immunoblots of BMMCs from Gli3 WT or Gli3 Xt+/− mice stained with GLI3 antibody; relative quantification of the GLI3A/GLI3R ratio. (B) Proliferation of WBM from Gli3 WT and Gli3 Xt+/− mice and differentiation into MCs with mIL3 +/− mSCF. P-values were calculated at day 21. (C) Immunoblots of BMMCs in mIL3+mSCF, stained with P-AKT, AKT, and p21 antibodies. (D) Time-course of the proliferation of BMMCs after transduction with KIT D816V-GFP or KIT WT-GFP lentiviral vectors. (E) Proliferation of WBM from Gli3 WT and Gli3 Xt+/− mice and differentiation into MCs after transduction with KIT D816V-GFP or KIT WT-GFP vectors. Data are from 3 independent experiments. *P < .05; **P < .01; ***P < .001.
GLI3R behaves as a tumor suppressor
To assess the potential antiproliferative effects of GLI3R, we transduced HMC1.2 cells with a lentiviral vector expressing GLI3R-tdTomato. GLI3R drastically inhibited cell proliferation (Figure 4A, left). More than 90% of GLI3R-tdTomato+ cells died within 10 days vs 40% of the control tdTomato+ cells (Figure 4B, right). Inhibition of proliferation and apoptosis were consistently associated with a significant decrease of the proproliferative factor GLI1 and its targets c-MYC and AKT, and the antiapoptotic factor BCL2; conversely, p21 expression increased (Figure 4B-C). To assess the molecular impact of GLI3R expression, we performed RNA-seq analysis of HMC1.2-GLI3R-tdTomato vs HMC1.2-tdTomato. IPA revealed deregulation of clustered cellular functions (Figure 4D; supplemental Figure 6). Cell death, necrosis, and apoptosis were stimulated, whereas viability, cell proliferation, and DNA replication were repressed. We also found that genes involved in MC activation were downregulated when GLI3R was ectopically expressed, notably including tryptase α1, a major MC protease that is secreted upon MC activation. Hence, RNA-seq data confirmed our results, strongly supporting the potential therapeutic effect of GLI3R.
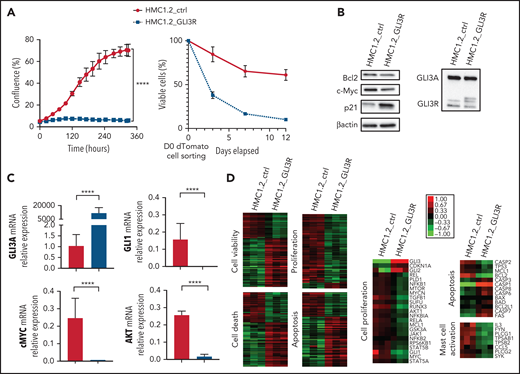
GLI3R behaves as a tumor suppressor. (A) Time course of proliferation and viability for HMC1.2 cells transduced with lentiviral vectors expressing tdTomato-GLI3R or tdTomato-control, by the IncuCyte imaging system. Cell viability was determined by light scatter measurement by FACS. (B) Immunoblot of GLI3, Bcl2, c-Myc, and p21 in HMC1.2 cells transduced with the 2 tdTomato vectors indicated above. (C) Relative gene expression of GLI3, GLI1, AKT, and c-Myc in transduced HMC1.2 cells. Data are from 3 independent experiments. (D) Transcriptional profiling of the transduced HMC1.2 cells using RNA-seq. Differentially expressed genes involved in cell death (z score, 2.58), apoptosis (z score, 3.02), viability (z score, −2.46), and cell proliferation (z score, −2.27) are highlighted by the heat maps (see “Methods”). Selection of 23, 13, and 8 differentially expressed genes, respectively involved in cell proliferation, apoptosis and MC activation is represented. Green and red intensities indicate the degree of downregulation and upregulation, respectively. ****P < .0001.
GLI3R behaves as a tumor suppressor. (A) Time course of proliferation and viability for HMC1.2 cells transduced with lentiviral vectors expressing tdTomato-GLI3R or tdTomato-control, by the IncuCyte imaging system. Cell viability was determined by light scatter measurement by FACS. (B) Immunoblot of GLI3, Bcl2, c-Myc, and p21 in HMC1.2 cells transduced with the 2 tdTomato vectors indicated above. (C) Relative gene expression of GLI3, GLI1, AKT, and c-Myc in transduced HMC1.2 cells. Data are from 3 independent experiments. (D) Transcriptional profiling of the transduced HMC1.2 cells using RNA-seq. Differentially expressed genes involved in cell death (z score, 2.58), apoptosis (z score, 3.02), viability (z score, −2.46), and cell proliferation (z score, −2.27) are highlighted by the heat maps (see “Methods”). Selection of 23, 13, and 8 differentially expressed genes, respectively involved in cell proliferation, apoptosis and MC activation is represented. Green and red intensities indicate the degree of downregulation and upregulation, respectively. ****P < .0001.
The Hh pathway is essential for MC transformation
To assess potential therapeutic applications of Hh antagonists, different doses of sonidegib and GANT61 were tested. Sonidegib, an SMO antagonist used in treatment of basal cell carcinoma, dramatically decreased HMC cell proliferation (70%) and promoted cell death (15%) at a 20-µM concentration (Figure 5A-B).26 These effects involved downregulation of GLI1, decrease in the GLI3A/GLI3R ratio, relative decrease of phospho-STAT3 (S727) acting downstream of mutant KIT, and slight downregulation of BCL2 (P = .066; Figure 5C-D). Exposure to 10 µM GANT61, which targets both canonical and noncanonical Hh pathways, totally inhibited proliferation of HMC lines and patient MCs with KIT WT MCL (supplemental Figures 7 and 8).27 Consistently, mTOR, GLI1, and its targets AKT, BCL2, c-MYC, and BCL-xL, decreased in a dose-dependent manner in response to GANT61, whereas procaspase-3 was activated (supplemental Figure 9). ROSA cell lines were slightly less sensitive (supplemental Figures 7 and 10).

The Hh pathway is essential for MC transformation. (A) Time course of the proliferation of HMC1.1 and HMC1.2 cell lines treated with increasing concentrations of sonidegib or DMSO. Cell confluence was measured by using live-cell imaging (IncuCyte). HMC1 proliferation (percentage confluence) is plotted against time (in hours). (B) Death of HMC1.1 and HMC1.2 cells treated with increasing concentrations of sonidegib or DMSO. (C) Immunoblots of HMC1.2 and HMC1.1 cells treated in the same conditions and stained with GLI1, GLI3, and Bcl2 antibodies. (D) Quantification of P-STAT3 in treated HMC1.2 cells by using a phosphokinase array. (E) Time-course of proliferation of primary MCs obtained from a patient with KIT D816V ASM treated with increasing concentrations of sonidegib or DMSO. (F) Death of primary MCs of a patient with KIT D816V ASM (ASM1) and of a patient with KIT S501_A502dup MCL (MCL4) treated with increasing concentrations of sonidegib or DMSO. (G) Immunoblots of the same patient’s primary MCs treated in the same conditions, stained with GLI3, GLI1, and Bcl2; the corresponding quantification of GLI3A/GLI3R relative protein expression is indicated. Data are from 3 independent experiments. *P < .05; **P < .01; ***P < .001; ****P < .0001.
The Hh pathway is essential for MC transformation. (A) Time course of the proliferation of HMC1.1 and HMC1.2 cell lines treated with increasing concentrations of sonidegib or DMSO. Cell confluence was measured by using live-cell imaging (IncuCyte). HMC1 proliferation (percentage confluence) is plotted against time (in hours). (B) Death of HMC1.1 and HMC1.2 cells treated with increasing concentrations of sonidegib or DMSO. (C) Immunoblots of HMC1.2 and HMC1.1 cells treated in the same conditions and stained with GLI1, GLI3, and Bcl2 antibodies. (D) Quantification of P-STAT3 in treated HMC1.2 cells by using a phosphokinase array. (E) Time-course of proliferation of primary MCs obtained from a patient with KIT D816V ASM treated with increasing concentrations of sonidegib or DMSO. (F) Death of primary MCs of a patient with KIT D816V ASM (ASM1) and of a patient with KIT S501_A502dup MCL (MCL4) treated with increasing concentrations of sonidegib or DMSO. (G) Immunoblots of the same patient’s primary MCs treated in the same conditions, stained with GLI3, GLI1, and Bcl2; the corresponding quantification of GLI3A/GLI3R relative protein expression is indicated. Data are from 3 independent experiments. *P < .05; **P < .01; ***P < .001; ****P < .0001.
Exposure of primary neoplastic MCs sorted from a patient with KIT D816V+ ASM (ASM1) and a patient with KIT S501 A502dup MCL (MCL4) to 20 μM sonidegib induced ±20% cell death (Figure 5E) and growth arrest (Figure 5F) concomitantly with reduction of GLI1, GLI3, and BCL2 expression (Figure 5G, left), whereas the GLI3A/GLI3R ratio was consistently lower (Figure 5G, right). Similar results were obtained with vismodegib, another canonical Hh antagonist (supplemental Figures 11 and 12). These data indicate that GLI TFs and their target genes were activated by both canonical and noncanonical Hh pathways in neoplastic cells from patients. More importantly, we demonstrated the involvement of Hh factors in the tumorigenic process and highlighted the therapeutic effect of Hh antagonists in vitro.
Sonidegib increases the survival time in a mouse model of KIT D816V+ ASM
We assessed the efficacy of Hh antagonists on an mouse model of aggressive ASM/MCL.28 In brief, NSG mice engrafted with ROSA KIT D816V-gluc cells were treated daily with sonidegib at 80 mg/kg. Death induced by tumor invasion occurred significantly later in the sonidegib-treated group (mean, 68.8 days; median, 67 days) than in the control group (mean, 53.7 days, P = .0027; median, 55.5 days, P = .0052), affirming the therapeutic efficacy of Hh antagonists in vivo (Figure 6A-C).

Sonidegib increases the survival time in a mouse model of KIT D816V+ ASM and impairs MC proliferation when combined with midostaurin. (A) Survival analyses of NSG mice treated with sonidegib (n = 33; 80 mg/kg per day) or placebo (ctrl; n = 33) for 8 weeks, starting 7 weeks after transplantation with ROSA KIT D816V-gluc. (B) Mean survival time in NSG mice treated with sonidegib (80 mg/kg per day for 8 weeks). (C) Mean and median death of mice in ctrl vs sonidegib groups. The data are representative of 2 independent experiments. (D) Cell proliferation and death measured by flow cytometry (immunoprecipitation and annexin V) of HMC1.2 cell lines after 72 hours of treatment with sonidegib and/or PKC412. (E) Cell proliferation and death (table) of primary MCs of a patient with a KIT D816V+ ASM after 156 hours of treatment with sonidegib and/or PKC412. **P < .01.
Sonidegib increases the survival time in a mouse model of KIT D816V+ ASM and impairs MC proliferation when combined with midostaurin. (A) Survival analyses of NSG mice treated with sonidegib (n = 33; 80 mg/kg per day) or placebo (ctrl; n = 33) for 8 weeks, starting 7 weeks after transplantation with ROSA KIT D816V-gluc. (B) Mean survival time in NSG mice treated with sonidegib (80 mg/kg per day for 8 weeks). (C) Mean and median death of mice in ctrl vs sonidegib groups. The data are representative of 2 independent experiments. (D) Cell proliferation and death measured by flow cytometry (immunoprecipitation and annexin V) of HMC1.2 cell lines after 72 hours of treatment with sonidegib and/or PKC412. (E) Cell proliferation and death (table) of primary MCs of a patient with a KIT D816V+ ASM after 156 hours of treatment with sonidegib and/or PKC412. **P < .01.
Sonidegib combined with midostaurin impairs MC proliferation
We then assessed whether a dual therapy combining sonidegib with the standard treatment of KIT D816V+ ASM, the nonselective KIT inhibitor midostaurin/PKC412, would be beneficial for ASM treatment. Sonidegib (20 µM) and PKC (200 nM) synergistically impaired growth of the HMC lines (Figure 6D), and patient neoplastic MC proliferation was fully inhibited in response to 10 µM sonidegib and 150 nM PKC within 3 days (Figure 6E).
Discussion
In 2 independent families, we encountered an extremely rare clinical association of a Mendelian disorder, GCPS, caused by GLI3 haploinsufficiency and CM. This association led us to hypothesize a role for GLI3, the major repressor of the Hh family, in the onset of mastocytosis. Deciphering the link between these 2 rare diseases, we demonstrated the involvement of the Hh pathway in the pathophysiology of mastocytosis and a cooperative effect of KIT and Hh oncogenic pathways in ASM.
Investigating the Hh pathway in MCs highlighted its involvement in the common forms of the disease. Indeed, in normal primary MCs, Hh activity appeared to be abrogated by a low GLI3A/GLI3R ratio. In contrast, in tumor MCs, Hh signaling was likely activated through a canonical SHH/GLI pathway resulting from the specific expression of SHH ligand in neoplastic MCs (Figure 1E), the tumor microenvironment (Figure 1F; supplemental Figure 3), and a noncanonical KIT/GLI pathway via constitutively activated KIT. Activation is not 1-way, because SAG transactivates KIT, underscoring a KIT/SHH activation loop (supplemental Figure 13).
We confirmed via the GCPS mouse model that GLI3 haploinsufficiency associated with a high GLI3A/GLI3R ratio promotes MC transformation synergistically with the KIT D816V mutation (Figure 3). GLI3 haploinsufficiency is not the most common driver of Hh activation in cancer20,29,30; canonical activation occurs more often through inhibition of the PTCH repressor or activating mutations of SMO.31
Decreasing the GLI3A/GLI3R ratio through ectopic expression of GLI3R induced the death of neoplastic MCs, indicating the therapeutic potential of GLI3R (Figure 4). In leukemia, the Hh pathway contributes to the development of FLT3-ITD acute myeloid leukemia (AML).17 The GLI3 gene is fully silenced through abnormal hypermethylation in almost all cells of patients with AML; restoration of GLI3R expression suppresses AML growth.16 Thus, our results extend the list of hematopoietic players activating the Hh pathway during a tumor process; however, in contrast to the AML study, neoplastic MCs express GLI3.32 Other tumors involving tyrosine kinases have also featured Hh activation. In gastrointestinal tumors, first thought to be exclusively linked to mutations in KIT or PDGFRA, mutations altering Hh members PTCH1-2, SUFU, GLI1, and SMO were identified independent of the KIT/PDGFRA mutational status.33 Cain et al showed that expression of GLI3R inversely correlated with KIT messenger RNA levels, corroborating our findings.34
Hh activation is not exclusively dependent on KIT mutations in advSM; indeed, among the 4 MCL and 2 patients with ASM investigated, 2 were KIT-WT (Figure 2A-B). Activation could occur, for example, by an autocrine/paracrine loop that activates KIT; via additional events, such as somatic gain- or loss-of-function mutations in genes directly or indirectly regulating GLI3; or via epigenetic modifications, such as those described in ASM including TET2 or EZH2 genes. Additional patients and further molecular investigations will allow for better deciphering of the mechanisms of Hh pathway activation in mastocytosis.
Hh activation could also occur through paracrine signaling related to overexpression of Hh ligands by the tumor microenvironment as, described in other cancers, and we observed in the skin, digestive tract, and BM, or through an autocrine signaling via the tumor MCs themselves, as observed in patient 1 (Figure 1).
More important, we showed for the first time molecular and functional evidence of the synergistic tumor effects of Hh and TK pathways in MCs, highlighting a new therapeutic target in mastocytosis.35,36 We demonstrated the efficacy of sonidegib in vitro on tumoral MC proliferation and death and in vivo in an ASM mouse model (Figures 5 and 6). In AML, Hh signaling is involved in survival and drug resistance; Chaudry et al demonstrated that glasdegib is a potent antiproliferating agent in AML with a significant capacity to overcome therapeutic resistance to the conventional cytotoxic agent cytarabine.16 Although major advances have been made in mastocytosis treatment with TKIs such as midostaurin and more recently avapritinib, which shows remarkable efficacy in ISM and relative efficacy in advSM, the rate of long-term complete responses is still uncertain, and more effective drugs combinations remain to be identified. Combining Hh inhibitors with TKIs represents an interesting therapeutic approach (Figure 6D-E); however, the efficacy of this therapeutic strategy must be validated on a larger number of patient samples. Because overexpression of GLI3R induced cell death by repressing the expression of the antiapoptotic factor BCL2 (Figure 6C), a multidrug treatment approach (ie, with the addition of BCL2 inhibitors) could be considered in the most severe cases.
In summary, deciphering the link between 2 rare diseases occurring in the same patient is a promising approach to shedding light on the pathophysiologic mechanism and identification of potential therapeutic targets in acquired hematological disorders. Our data demonstrate the involvement of at least 2 genes in the onset of advanced mastocytosis. Because monotherapy with midostaurin is partially effective in patients with ASM and sonidegib improves the survival of the ASM mouse model, we expect that their combination would be beneficial, especially given that we have demonstrated the combinatorial efficacy of the 2 drugs in vitro on MC lines and neoplastic MCs.
Acknowledgments
The authors thank Sylvie Fabrega for assisting with virus production, Olivier Pelé for his assistance with cell sorting, Christine Bole for bioinformatics advice and performing the A-seq experiment; and François Moreau Gaudry for providing them with the pRRSLIN-MND-PGK-tdTomato-WPRE backbone. The study is presented on behalf of the French Reference Center for Mastocytosis (CEREMAST) study group.
This work was supported by grants from the French Society of Dermatology, The Mast Cell Disease Society, Inc, The Association pour la Recherche sur le Cancer, La Ligue Contre le Cancer, The Association Laurette Fugain, INSERM Transfert, and the Maladies Rares Immuno-Hématologiques Rare Immunohematologic Disease Network. L.P. was funded by Imagine Institute and the Bettencourt Schueller Foundation. Editorial assistance, in the form of language editing and correction, was provided by XpertScientific Editing and Consulting Services.
Authorship
Contribution: L.M.-C., O.H., and L.P. designed, analyzed, and discussed all the experiments; L.P., E.B., R.R., D.C., S.F., L.L., M.F., M.M., M.T., M.P., P.D., and L.M.-C., designed, performed, analyzed, and discussed the in vitro experiments; E.S. and V.P. performed and analyzed the in vivo experiments; J.B. performed the immunohistochemical experiments; C.G. produced the Gli3 xt+/− embryos from cryopreserved sperm; L.P. drew the figures and wrote “Methods”; N.C. analyzed the bioinformatics data; J.R., L.F., C.M., H.B., A.-F.C., B.B.-M., M.A., C. Livideanu; C. Laurent; and U.R. provided critical biological samples; S.H.-R., P.D., C.B., and O.H. corrected the manuscript; and L.M.-C. and L.P. wrote the manuscript.
Conflict-of-interest disclosure: The authors declare no competing financial interests.
Correspondence: L. Maouche-Chrétien, Imagine Institute, INSERM U1163, 24 Blvd Montparnasse, F-75015 Paris, France; e-mail: leila.maouche@inserm.fr.
Raw data are available at http://www.ebi.ac.uk/arrayexpress/experiments/E-MTAB-9893.
The data sets, including the redacted study protocol, redacted statistical analysis plan, and individual participant data supporting the results of the completed study, will be made available after the publication of the final study results, within 3 months of the initial request, to researchers who provide a methodologically sound proposal. The data will be provided after deidentification, in compliance with applicable privacy laws, data protection, and requirements for consent and anonymizing.
The online version of this article contains a data supplement.
The publication costs of this article were defrayed in part by page charge payment. Therefore, and solely to indicate this fact, this article is hereby marked “advertisement” in accordance with 18 USC section 1734.

This feature is available to Subscribers Only
Sign In or Create an Account Close Modal