

Key Points
CRISPR/Cas9 kinome screen identifies genes involved in ASNase sensitivity.
Ibrutinib synergizes with ASNase by inhibiting the amino acid response pathway via c-Myc– mediated regulation of GCN2.

Abstract
Asparaginase (ASNase) therapy has been a mainstay of acute lymphoblastic leukemia (ALL) protocols for decades and shows promise in the treatment of a variety of other cancers. To improve the efficacy of ASNase treatment, we used a CRISPR/Cas9-based screen to identify actionable signaling intermediates that improve the response to ASNase. Both genetic inactivation of Bruton’s tyrosine kinase (BTK) and pharmacological inhibition by the BTK inhibitor ibrutinib strongly synergize with ASNase by inhibiting the amino acid response pathway, a mechanism involving c-Myc–mediated suppression of GCN2 activity. This synthetic lethal interaction was observed in 90% of patient-derived xenografts, regardless of the genomic subtype. Moreover, ibrutinib substantially improved ASNase treatment response in a murine PDX model. Hence, ibrutinib may be used to enhance the clinical efficacy of ASNase in ALL. This trial was registered at www.clinicaltrials.gov as # NCT02884453.
Introduction
The protein drug asparaginase (ASNase) is a key component of acute lymphoblastic leukemia (ALL) treatment regimens worldwide1 and has shown clinical efficacy in other cancers, such as natural killer (NK)/T-cell lymphoma subtypes, acute myeloid leukemia, and even some solid tumors.2,3 In contrast to genotoxic agents, this metabolic therapy is not associated with long-term adverse effects, a benefit that could be exploited by increasing the efficacy of this drug. ASNase acts by catalyzing the conversion of L-asparagine (Asn) into L-aspartate, depleting Asn from the blood. Because leukemic blasts and some other tumor cells are selectively dependent on exogenous Asn, sustained exposure to ASNase leads to amino acid starvation, a cessation of growth, and ultimately, the induction of apoptosis.1
Despite ASNase being a cornerstone drug of ALL treatment regimens, its clinical efficacy is often compromised due to inactivation of the drug, for instance, by the formation of inhibitory antibodies4 or as a result of therapy violations in response to allergic reactions or treatment-related toxicities. Moreover, incomplete depletion of Asn can occur because of poor penetrance of the drug in the central nervous system (CNS)5,6 or by stromal support in the bone marrow niche.7 Suboptimal depletion at these sanctuary sites may be sufficient to maintain leukemic blasts in a quiescent state rather than induce apoptosis, increasing the chance of relapse. Therefore, obtaining a detailed understanding of the cell intrinsic and extrinsic factors that affect the opposing cellular responses to ASNase is needed to further increase the efficacy of ASNase therapy.
Methods
Reagents
The following plasmids were obtained via Addgene: pS-Pax2 (#12260), pMD2.G (12259), pCW-Cas9 (50661), gRNA library targeting kinases (51044), and pLentiCRISPR-v1 (49535).
For targeted knockout (KO), gRNA sequences (supplemental Table 1, available on the Blood Web site) were cloned into pLentiCRISPRv1. Asparagine synthetase (ASNS) was expressed from pMSCV-hygro. ASNase formulations (Paronal, Spectrila, or Oncospar) were purchased from Takeda (Hoofddorp, The Netherlands), Medac (Wedel, Germany), and Servier Pharmaceuticals, Inc. (Boston, MA), respectively. Ibrutinib, evobrutinib, ARQ531, and general control nonderepressible 2 (GCN2) inhibitor (A-92) were purchased from Selleckchem (Munich, Germany).
CRISPR/Cas9 screen
The use of the sgRNA library was described previously.8 Nalm6 cells were transduced with lentivirus encoding a doxycycline-inducible Cas9. Next, the sgRNA library at an MOI<1 library complexity was confirmed, and Cas9 expression was induced for 2 weeks (2 μg/mL of doxycycline). Then, cells were split into 2 pools and left untreated or exposed to 5 IU/mL of ASNase for 2 weeks. Subsequently, gRNA’s abundance was determined by deep sequencing (see supplemental Methods). Relevant genes were identified using the MAGeCK algorithm (v0.5.3).9
Cell viability assays
Cell viability was determined using the CellTiter 2 96 AQueous One Solution Cell Proliferation (MTS) Assay (Promega, Madison, WI) and flow cytometry was determined using Hoechst 33342 (Sigma Aldrich, Zwijndrecht, The Netherlands) or amine staining (LIVE/DEAD Fixable Dead Cell Stain Sampler Kit, L349630; Thermo Fisher Scientific, Breda, The Netherlands), according to the manufacturer’s instructions.
Colony assay
Cells were counted, and 5000 (Nalm6) or 10 000 (Sem) viable cells were seeded in 1 mL of medium substituted with 0.1% low-melt agar type VII (A-4018; Sigma-Aldrich). Cells were incubated for 1 to 2 weeks until colony growth could be observed. Colonies were counted and stained by using 0.005% crystal violet.
Ex vivo culture of patient-derived xenografts and high throughput viability assay
Reverse phase protein array
Reverse phase protein array (RPPA) analysis was performed as described.13,14 Protein expression data from treated samples were normalized relative to untreated samples and subjected to a principal component analysis. From this, the top 50 proteins that contributed most to principal component one were selected, and unsupervised hierarchical clustering with Ward’s linkage was applied.
RNA sequencing
RNA sequencing, data analysis, and functional analysis (differential gene expression analysis) were performed by NovoGene (Cambridge, United Kingdom) on triplicate samples. mRNA was purified from cell cultures using an RNeasy minikit (74106; Qiagen, Venlo, The Netherlands). Raw data were deposited in the Gene Expression Omnibus repository (GSE169152). Differential expression was analyzed using Venny,15 STRINGv11,16 and ingenuity pathway analysis (Qiagen17).
In vivo study
Animal experiments were approved by the Animal Experimental Committee of Radboud University (RU-DEC-2015-0050 and RU-DEC-2019-0036). NSG mice were randomized into 4 groups (8 mice per group) and injected intrafemorally with 0.5 × 10⁶ viable cells in each femur. Two weeks after transplantation, mice were treated as indicated. Tumor load was determined weekly by flow cytometric detection of human cells by staining for human CD10, CD45, and CD19 and murine CD45 cells. Mice were euthanized after the human CD45+ reached 50% of total CD45+ cells.
Statistical analyses
All statistical analyses were performed using PRISM 6 (GraphPad Software, La Jolla, CA). Detailed methods can be found in the supplemental data.
Results
CRISPR/Cas9 kinome screen identifies genes involved in ASNase sensitivity
To identify actionable modifiers that control the delicate balance between cell survival and apoptosis during ASNase treatment in ALL, we performed a CRISPR/Cas9–based loss-of-function screen in the pre-B ALL cell line Nalm6 (Figure 1A). We transduced cells with a previously described lentiviral vector system to express a doxycycline-inducible Cas9 (supplemental Figure 1A) and an sgRNA library targeting all kinases encoded in the human genome (507) with 10 distinct sgRNAs per gene8 and confirmed that library complexity was sufficiently maintained (supplemental Figure 1B). Of the kinases present in our pool of cells, 89% were targeted by at least 6 individual sgRNAs (not shown). To identify genes essential for the response to ASNase, we compared sgRNA frequencies in the pool of cells treated with 5 IU/mL of ASNase to control cells using massively parallel sequencing. Under these conditions, ∼35% cell death was observed after 2 weeks of culture.
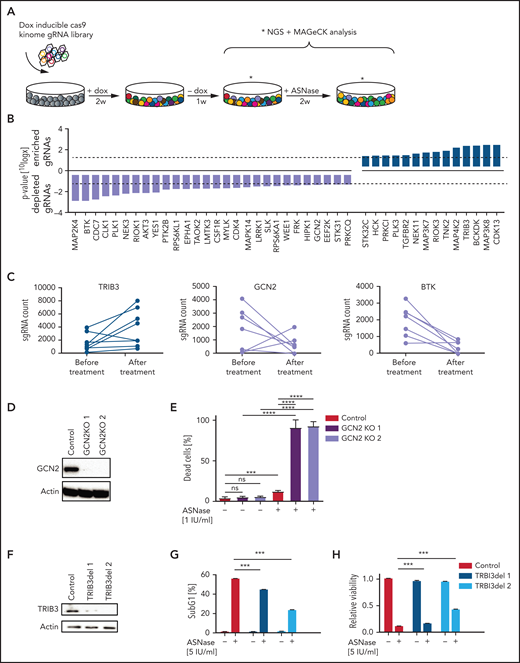
CRISPR/Cas9-based kinome screen identify modifiers of ASNase sensitivity in BCP-ALL. (A) Schematic representation of our screening strategy. Nalm6 cells were transduced stepwise with a doxycycline-inducible Cas9 and a kinome sgRNA library. Cells were cultured for 2 weeks in the presence of 2 μg/mL of doxycycline to induce Cas9 expression and 1 week in the absence of doxycycline. Then, cells were treated for 2 weeks with 5 IU/mL of ASNase, DNA was isolated and subjected to massively parallel sequencing, and results were analyzed using the MAGeCK algorithm. (B) Gene list of expressed gRNA targets that significantly modulate ASNase response, ranked by P value calculated using the MAGeCK algorithm. (C) Counts of individual gRNAs targeting TRIB3, GCN2, and BTK, respectively, before and after ASNase treatment. (D,F) Immunoblot analysis of TRIB3 or GCN2 protein expression in cells upon CRISPR/Cas9-based targeting of GCN2 or TRIB3, respectively. (E) ASNase-induced cell death as determined by quantification of cells positive for amine-reactive dyes using flow cytometry in Nalm6 WT and Nalm6 GCN2-deleted cells after a 3-day treatment with 1 IU/mL of ASNase. Each bar represents a mean of 3 independent experiments. ***P < .001; **P < .01; ***P < .05 (2-tailed, unpaired Student t test). (G) ASNase-induced cell death as determined by quantification of cells in subG1 phase using flow cytometry of Hoechst-stained cells. Bars represent mean ± standard error of the mean (SEM) of n = 3 independent experiments. ***P < .001; **P < .01; ***P < .05 (2-tailed, unpaired Student t test). (H) Cell viability as measured by MTT in Nalm6 WT, and TRIB3del cells after treatment with the indicated dose of ASNase. Bars represent mean ± SEM of n = 3 independent experiments. ***P < .001; **P < .01; ***P < .05 (2-tailed, unpaired Student t test).
CRISPR/Cas9-based kinome screen identify modifiers of ASNase sensitivity in BCP-ALL. (A) Schematic representation of our screening strategy. Nalm6 cells were transduced stepwise with a doxycycline-inducible Cas9 and a kinome sgRNA library. Cells were cultured for 2 weeks in the presence of 2 μg/mL of doxycycline to induce Cas9 expression and 1 week in the absence of doxycycline. Then, cells were treated for 2 weeks with 5 IU/mL of ASNase, DNA was isolated and subjected to massively parallel sequencing, and results were analyzed using the MAGeCK algorithm. (B) Gene list of expressed gRNA targets that significantly modulate ASNase response, ranked by P value calculated using the MAGeCK algorithm. (C) Counts of individual gRNAs targeting TRIB3, GCN2, and BTK, respectively, before and after ASNase treatment. (D,F) Immunoblot analysis of TRIB3 or GCN2 protein expression in cells upon CRISPR/Cas9-based targeting of GCN2 or TRIB3, respectively. (E) ASNase-induced cell death as determined by quantification of cells positive for amine-reactive dyes using flow cytometry in Nalm6 WT and Nalm6 GCN2-deleted cells after a 3-day treatment with 1 IU/mL of ASNase. Each bar represents a mean of 3 independent experiments. ***P < .001; **P < .01; ***P < .05 (2-tailed, unpaired Student t test). (G) ASNase-induced cell death as determined by quantification of cells in subG1 phase using flow cytometry of Hoechst-stained cells. Bars represent mean ± standard error of the mean (SEM) of n = 3 independent experiments. ***P < .001; **P < .01; ***P < .05 (2-tailed, unpaired Student t test). (H) Cell viability as measured by MTT in Nalm6 WT, and TRIB3del cells after treatment with the indicated dose of ASNase. Bars represent mean ± SEM of n = 3 independent experiments. ***P < .001; **P < .01; ***P < .05 (2-tailed, unpaired Student t test).
Remarkably, although we did not observe any significant gRNA losses in the control cells after 2 weeks of unchallenged culturing (data not shown), also in the treated cell population the relative frequency of most sgRNAs remained largely unaffected (supplemental Figure 1C-D). The MAGeCK algorithm9 was used to prioritize the few genes of which sgRNAs were selectively enriched or depleted during treatment. This analysis yielded 20 genes for which loss of function appeared to be associated with resistance (enriched gRNAs), whereas gRNAs for 31 genes were selectively depleted during treatment, suggesting that loss of these kinases enhances sensitivity to ASNase (Figure 1B; supplemental Figure 1E). A total of 7 of those 51 identified genes was subsequently eliminated because expression of these gene products was undetectable in Nalm6 cells, as determined after RNA sequencing (supplemental Figure 1F).
The cellular responses to amino acid starvation have been described in detail18 (supplemental Figure 1G). Uncharged tRNAs activate the cellular amino acid sensor eukaryotic translation initiation factor 2 α kinase 4, better known as GCN2, to phosphorylate the eukaryotic initiation factor 2 (eIF2). This leads to a global suppression of protein translation, causing cells to arrest in G1 of the cell cycle.19 At the same time, eIF2-independent translation of activating transcription factor 4 (ATF4) increases. This nutrient stress-induced transcription factor controls a wide range of adaptive genes within the amino acid response (AAR) pathway to maintain cellular homeostasis in response to amino acid starvation. However, upon sustained nutrient stress, ATF4 will start a transcriptional program that favors the induction of apoptosis.18
Consistent with its central role in activating the AAR, we found that sgRNAs targeting GCN2 were selectively depleted in response to ASNase exposure (Figure 1B-C; supplemental Figure 1E). Moreover, other kinases that control translation, such as eukaryotic elongation factor 2 kinase20 and RPS6KL1, also known as P90RSK,21 were identified as potential modifiers of ASNase therapy response (supplemental Figure 1H). These results illustrate that translational control in response to ASNase-induced nutrient starvation is key to survival and suggest that targeting these kinases may enhance treatment efficacy (supplemental Figure 1G).
Conversely, sgRNAs targeting the pseudokinase Tribbles 3 (TRIB3), a proapoptotic target gene of ATF4,22 were enriched upon selection, suggesting that loss of TRIB3 contributes to ASNase resistance (Figure 1B-C; supplemental Figure 1E).
We used targeted CRISPR/Cas9-mediated mutation of GCN2 and TRIB3 to validate the results from our screen. Single cell clones of GCN2 and unselected pools of TRIB3 targeted cells were generated, and KO was confirmed on western blot (Figure 1D,F). Wild-type (WT) and targeted cells were exposed to ASNase and DNA fragmentation, and membrane integrity was determined by flow cytometry as a measure of cell death, whereas metabolic activity was used to determine cell viability. Whereas deletion of GCN2 indeed sensitized cells to ASNase treatment (Figure 1E), consistent with its proapoptotic function, TRIB3-deleted Nalm6 cells were more resistant to ASNase treatment (Figure 1G-H; supplemental Figure 1I). We conclude that our reverse genetics screening approach can be successfully used to (1) delineate pathways that contribute to ASNase therapy resistance, and (2) identify targets to modulate therapy response.
Bruton’s tyrosine kinase protects against ASNase-induced apoptosis
In addition to regulators (or effectors) of protein translation, we identified a number of kinases implicated in cell survival that can be targeted to enhance the apoptosis induction in response to ASNase, including the Src-like kinase Yes1, the Ser-Thr kinase AKT3, and Bruton’s tyrosine kinase (BTK) (Figure 1B-C). The latter one is a key component of the B-cell antigen receptor (BCR) signaling pathway and is essential for B-cell development and survival.23 BTK is predominantly expressed in cells of hematopoietic origin, although ectopic expression in various solid tumors has been reported.24 The BTK inhibitor ibrutinib has shown impressive clinical efficacy in the treatment of mature B-cell malignancies.25 Both its restricted expression pattern and the availability of a clinical grade inhibitor prompted us to investigate a potential synergy between BTK inhibition and ASNase therapy. First, we used CRISPR/Cas9 to generate single cell clones of Nalm6 fully deficient for BTK and studied the response to ASNase (Figure 2A-B; supplemental Figure 2A). In control cells, exposure to ASNase induced cell cycle arrest (supplemental Figure 2B) without induction of apoptosis (Figure 2A,C; supplemental Figure 2C). In contrast, ASNase efficiently killed BTK KO cells (Figure 2A,C; supplemental Figure 2B-C). Similarly, an increase in ASNase-induced apoptosis was seen in Sem cells deficient for BTK relative to control cells (supplemental Figure 2D-E).
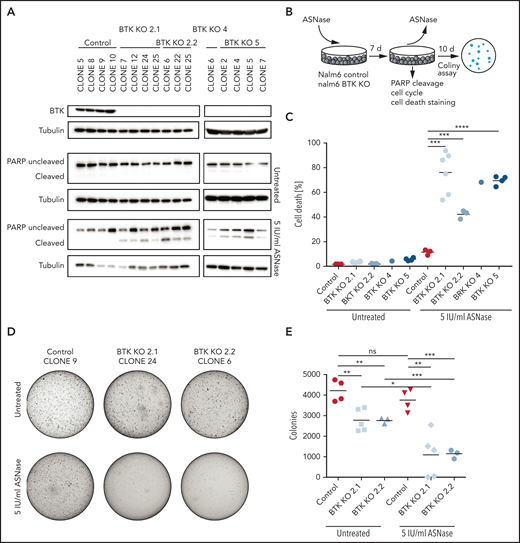
Targeted KO of BTK sensitizes BCP-ALL cell lines to ASNase. (A) Immunoblot analysis of BTK protein expression in single cell clones upon CRISPR/Cas9-based targeting of BTK and apoptosis induction as measured by immunoblot analysis of PARP in Nalm6 WT and Nalm6 BTK-deleted cells after a 7-day treatment with 5 IU/mL of ASNase. Representative blot of 3 independent experiments. (B) Schematic overview of experimental procedure. Nalm6 WT and Nalm6 BTK-deleted cells were treated with 5 IU/mL of ASNase for 7 days, followed by direct evaluation of apoptosis or recovery capacity in a clonogenic assay after washout of the ASNase. (C) ASNase-induced cell death as determined by quantification of cells positive for amine-reactive dyes using flow cytometry in Nalm6 WT and Nalm6 BTK-deleted cells after a 7-day treatment with 5 IU/mL of ASNase. Each data point represents a mean of 1 clone of 3 independent experiments. Mean of all clones is indicated by line. ***P < .001; **P < .01; ***P < .05 (2-tailed, unpaired Student t test). (D-E) Clonogenic proliferation assay of Nalm6 WT and Nalm6 BTK-deleted cells. After a 7-day treatment with 5 IU/mL of ASNase 5000 viable (trypan blue–negative) cells from each sample were seeded in soft agar. Recovery capacity was determined by quantification of colonies. Representative of 3 independent experiments. ***P < .001; **P < .01; ***P < .05 (2-tailed, unpaired Student t test).
Targeted KO of BTK sensitizes BCP-ALL cell lines to ASNase. (A) Immunoblot analysis of BTK protein expression in single cell clones upon CRISPR/Cas9-based targeting of BTK and apoptosis induction as measured by immunoblot analysis of PARP in Nalm6 WT and Nalm6 BTK-deleted cells after a 7-day treatment with 5 IU/mL of ASNase. Representative blot of 3 independent experiments. (B) Schematic overview of experimental procedure. Nalm6 WT and Nalm6 BTK-deleted cells were treated with 5 IU/mL of ASNase for 7 days, followed by direct evaluation of apoptosis or recovery capacity in a clonogenic assay after washout of the ASNase. (C) ASNase-induced cell death as determined by quantification of cells positive for amine-reactive dyes using flow cytometry in Nalm6 WT and Nalm6 BTK-deleted cells after a 7-day treatment with 5 IU/mL of ASNase. Each data point represents a mean of 1 clone of 3 independent experiments. Mean of all clones is indicated by line. ***P < .001; **P < .01; ***P < .05 (2-tailed, unpaired Student t test). (D-E) Clonogenic proliferation assay of Nalm6 WT and Nalm6 BTK-deleted cells. After a 7-day treatment with 5 IU/mL of ASNase 5000 viable (trypan blue–negative) cells from each sample were seeded in soft agar. Recovery capacity was determined by quantification of colonies. Representative of 3 independent experiments. ***P < .001; **P < .01; ***P < .05 (2-tailed, unpaired Student t test).
To further substantiate these findings, we performed washout experiments in which cells were allowed to recover by reseeding in soft agar or normal growth medium in the absence of the drug (Figure 2B). Although control Nalm6 cells recovered and ensued proliferation, resulting in the formation of colonies, BTK KO cells showed a strongly reduced ability to recover from ASNase therapy (Figure 2D-E; supplemental Figure 2C,F). We conclude that when challenged with ASNase, BTK is essential for survival of ALL cells.
The BTK inhibitor ibrutinib potentiates ASNase-induced apoptosis in B-cell progenitor ALL cell lines
The availability of FDA-approved BTK inhibitors opens the possibility for combination therapies exploiting the synergy between ASNase and loss of BTK function. Therefore, we tested ibrutinib/ASNase combinations in different B-cell precursor–ALL cell lines (Figure 3A; supplemental Figure 3A). At concentrations at which treatments with ASNase and ibrutinib as a single agent were effective at inhibiting proliferation but were unable to induce cell death, the combination of the 2 drugs potently induced apoptosis (Figure 3B; supplemental Figure 3B-D). To further test this premise, we repeated the earlier described washout experiments. Cells treated with ASNase or ibrutinib alone grew out to form colonies, whereas cells treated with ASNase and ibrutinib were effectively eradicated by the treatment (Figure 3C-D), even after only 3 days of treatment (supplemental Figure 3E).
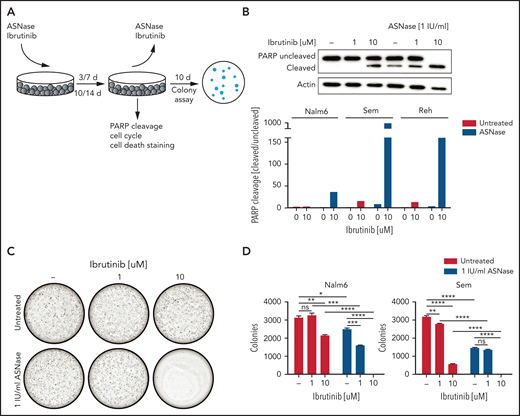
The BTK inhibitor ibrutinib potentiates ASNase-induced apoptosis. (A) Schematic overview of the experimental procedure. BCP-ALL cell lines were treated with ASNase, ibrutinib, or a combination of both for 7 days, followed by direct evaluation of apoptosis or recovery capacity in a clonogenic assay after washout of the ASNase. (B) Apoptosis induction as measured by immunoblot analysis of PARP in BCP-ALL cell lines. Nalm6, Sem, and Reh cells were treated with indicated doses of ASNase and ibrutinib. Representative of 3 independent experiments. (C-D) Clonogenic proliferation assay of Nalm6 and Sem cells. After 7 days’ treatment with indicated doses of ibrutinib and ASNase 5000 to 10 000 viable (trypan blue–negative) cells from each sample were seeded in soft agar. Recovery capacity was determined by quantification of colonies. Bars represent mean ± SEM of n = 3 replicates of 1 experiment. Representative of 3 independent experiments. ***P < .001; **P < .01; ***P < .05 (2-tailed, unpaired Student t test).
The BTK inhibitor ibrutinib potentiates ASNase-induced apoptosis. (A) Schematic overview of the experimental procedure. BCP-ALL cell lines were treated with ASNase, ibrutinib, or a combination of both for 7 days, followed by direct evaluation of apoptosis or recovery capacity in a clonogenic assay after washout of the ASNase. (B) Apoptosis induction as measured by immunoblot analysis of PARP in BCP-ALL cell lines. Nalm6, Sem, and Reh cells were treated with indicated doses of ASNase and ibrutinib. Representative of 3 independent experiments. (C-D) Clonogenic proliferation assay of Nalm6 and Sem cells. After 7 days’ treatment with indicated doses of ibrutinib and ASNase 5000 to 10 000 viable (trypan blue–negative) cells from each sample were seeded in soft agar. Recovery capacity was determined by quantification of colonies. Bars represent mean ± SEM of n = 3 replicates of 1 experiment. Representative of 3 independent experiments. ***P < .001; **P < .01; ***P < .05 (2-tailed, unpaired Student t test).
We also tested ASNase/ibrutinib combination in 4 different T-ALL cell lines (supplemental Figure 4). In 3 of these cell lines, ibrutinib potentiated ASNase-induced cell death, similar to our results in BCP-ALL cell line models. However, in 1 T-ALL cell line (HBP-ALL), we did not observe synergy, which may relate to the fact that it was already highly sensitive to ASNase as a single agent.
Moreover, similar effects were seen with second-generation BTK inhibitors (evobrutinib, ARQ531) (supplemental Figure 5A,C,E-F,H). Of note, the Src-like kinase YES1, a known off-target of both ibrutinib and ARQ531, and Fyn-related Src family tyrosine kinase (FRK), a known off-target of ibrutinib, were also identified as sensitizers from our screen (Figure 1B), suggesting that the inhibition of these off-targets may also contribute to the observed synergism. Indeed, ibrutinib retained some potentiating effect on ASNase-induced killing in BTK KO cells (supplemental Figure 5B), which is in agreement with the fact that we also observed increased ASNase-induced apoptosis in YES1 KO cells compared with WT cells (supplemental Figure 5D). However, the effects of YES1 KO on ASNase-induced cell killing were smaller than those seen in the BTK KOs.
We conclude from these experiments that treatment of ALL cell lines with either ASNase or BTK inhibitors as a single agent induces a state of cellular quiescence, allowing cells to resume proliferation after the treatment is ended, whereas combining the 2 drugs efficiently induces cell death.
Ibrutinib potentiates ASNase-induced apoptosis of ALL xenografts across cytogenetic subtypes
To validate our results in cells that more closely reflect primary human leukemia, we used patient-derived xenografts grown on feeder layers of immortalized bone marrow stroma cells.11 Previously, we showed that the ex vivo response to treatment accurately reflects the sensitivity to in vivo treatment.11 We performed co-titration experiments using 10 different concentrations of ASNase and ibrutinib and their combinations, resulting in a 10 × 10 matrix. Of note, these treatment conditions did not affect the viability or proliferation rate of the stromal feeder layer (supplemental Figure 5I). A panel of 38 B-ALL xenografts was incubated for 3 and/or 7 days before automated microscopy-based image analysis was used to quantify living cells (Figure 4A). We used the SynergyFinder12 to plot the data in interaction landscapes and calculated synergy using the zero interaction potential. In approximately 90% of patient-derived xenografts, ibrutinib synergized with ASNase (Figure 4B). These effects appeared to be largely independent of the ALL subtype (supplemental Table 2). Importantly, these synergistic interactions were also observed at a clinically relevant dose of 1 to 100 nM (Figure 4C). Three of the 5 xenografts that were unresponsive to the combination appeared to be extremely responsive to ASNase as a single agent (as exemplified in Figure 4C, sample SK-5942D), which could explain the lack of synergy in these cases. Notably, primary ALL cells of a rare primary refractory patient could be sensitized to ASNase treatment ex vivo using ibrutinib (Figure 4D). Primary cells obtained from a patient with T-ALL were also responsive to the combination treatment (supplemental Figure 5J).
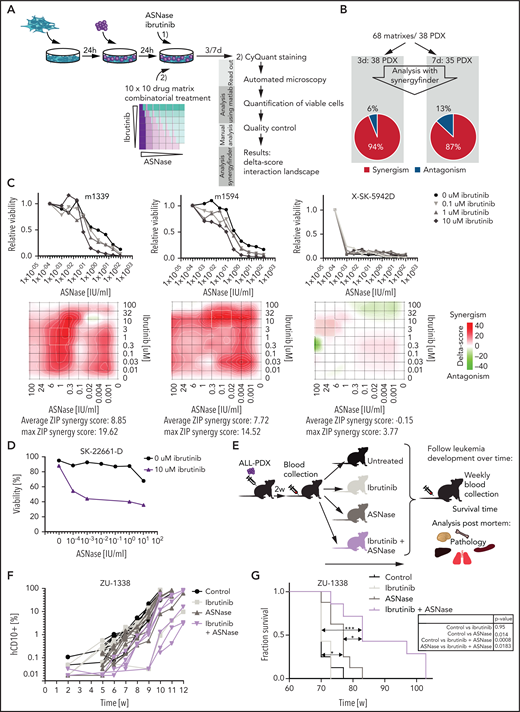
Ibrutinib synergizes with ASNase treatment in a large panel of ALL PDX ex vivo and induces a delay in leukemia development in vivo. (A) Schematic overview representing the workflow used to determine ex vivo drug responses in PDX samples. ALL-PDX samples were seeded on hTERT-immortalized mesenchymal stem cells and treated with ASNase, ibrutinib, or combinations of both. After 3 and 7 days of incubation, cell death was analyzed by automated microscopy using a live cell staining using CyQuant (synergy matrix). (B) Overview of the calculated drug interactions between ASNase and ibrutinib in the PDX samples. (C) Dose-response curves and synergy matrix plots showing δ-scores of 3 representative ALL PDX samples treated with drug matrix of ASNase and ibrutinib (upper panel). (D) ASNase-induced cell death as determined by quantification of cells positive for amine-reactive dyes using flow cytometry in a primary refractory ALL patient sample. Cells were seeded on hTERT-immortalized mesenchymal stem cells and treated with indicated doses of ASNase in the presence or absence of 10 μM of ibrutinib. (E) Schematic overview of the experimental procedure. NSG mice were engrafted with 2 ALL-PDX 2 weeks before start of treatment with vehicle, 300 IU/kg of ASNase (days 1, 4, and 7), 25 mg/kg of ibrutinib (days 1 to 9), or a combination of both. Leukemia development was followed over time by weekly determination of the percentage of human CD10+, CD45+, and CD19+ cells in the blood. Postmortem, histological analysis of organs was executed. (F) Leukemia development as determined by percentage of human CD10 cells detected by flow cytometry in peripheral blood samples of mice treated with ibrutinib, ASNase, or a combination of both. Lines represent percentage of human CD10+ cells in 1 mouse. (G) Survival analysis of mice of different treatment groups. ***P < .001; **P < .01; ***P < .05 (log-rank (Mantel-Cox) test).
Ibrutinib synergizes with ASNase treatment in a large panel of ALL PDX ex vivo and induces a delay in leukemia development in vivo. (A) Schematic overview representing the workflow used to determine ex vivo drug responses in PDX samples. ALL-PDX samples were seeded on hTERT-immortalized mesenchymal stem cells and treated with ASNase, ibrutinib, or combinations of both. After 3 and 7 days of incubation, cell death was analyzed by automated microscopy using a live cell staining using CyQuant (synergy matrix). (B) Overview of the calculated drug interactions between ASNase and ibrutinib in the PDX samples. (C) Dose-response curves and synergy matrix plots showing δ-scores of 3 representative ALL PDX samples treated with drug matrix of ASNase and ibrutinib (upper panel). (D) ASNase-induced cell death as determined by quantification of cells positive for amine-reactive dyes using flow cytometry in a primary refractory ALL patient sample. Cells were seeded on hTERT-immortalized mesenchymal stem cells and treated with indicated doses of ASNase in the presence or absence of 10 μM of ibrutinib. (E) Schematic overview of the experimental procedure. NSG mice were engrafted with 2 ALL-PDX 2 weeks before start of treatment with vehicle, 300 IU/kg of ASNase (days 1, 4, and 7), 25 mg/kg of ibrutinib (days 1 to 9), or a combination of both. Leukemia development was followed over time by weekly determination of the percentage of human CD10+, CD45+, and CD19+ cells in the blood. Postmortem, histological analysis of organs was executed. (F) Leukemia development as determined by percentage of human CD10 cells detected by flow cytometry in peripheral blood samples of mice treated with ibrutinib, ASNase, or a combination of both. Lines represent percentage of human CD10+ cells in 1 mouse. (G) Survival analysis of mice of different treatment groups. ***P < .001; **P < .01; ***P < .05 (log-rank (Mantel-Cox) test).
Similar to the cell line models, the more selective BTK inhibitor evobrutinib synergized with ASNase to induce apoptosis in ALL-PDXs (supplemental Figure 5E,G). Consistent with our earlier observations, ibrutinib was more potent, however, most likely due to its broader off-target effects, favoring the use of ibrutinib for clinical purposes in this setting.
Ibrutinib/ASNase combination therapy delays leukemia development and prolongs survival in vivo
We next tested whether the combination of ASNase and BTK inhibition would be effective at concentrations that are manageable in vivo. Therefore, nonconditioned immunocompromised mice were transplanted with patient-derived BCP-ALL cells. After engraftment, mice were treated with vehicle, ibrutinib, or ASNase alone or in combination (Figure 4E). Unfortunately, a known adverse effect of a clinically effective dose of ASNase in these mouse models is weight loss26 (supplemental Figure 6A), which limited the duration of the treatment to 9 days. After treatment, leukemia development was measured by flow cytometry (Figure 4F; supplemental Figure 6B-C), and mice were euthanized when the leukemic clone expanded to >50% of the total number of leukocytes. Mice treated with ibrutinib alone did not benefit from the treatment, whereas mice treated with ASNase alone initially showed suppression of leukemia development. However, this response was not durable, and the delay in leukemia development lasted approximately as long as the treatment (7 days; supplementary Figure 6D). This is in accordance with our in vitro data showing that 1-week exposure to ASNase effectively inhibits cell growth without the widespread induction of apoptosis. Importantly, despite the use of only a single, short block of treatment, we observed a significant delay in leukemia development and survival when using the combination treatment, indicating that BTK inhibition strongly synergizes with ASNase to induce leukemic cell death in vivo (Figure 4G).
BTK signaling intersects with the AAR
To determine how inhibition of BTK synergizes with ASNase, we performed RNA sequencing (supplemental Figure 7A) to investigate which genes are affected in response to ASNase, ibrutinib, or a combination. To be able to adapt to amino acid shortage, cells induce the AAR upon ASNase treatment. We hypothesized that the addition of ibrutinib would suppress this effect, preventing the cells from adequately responding. To test this hypothesis, we performed pathway analysis on the genes that are induced upon ASNase treatment but suppressed by the combination treatment in 2 cell lines (Figure 5A). Many of the identified mRNAs were mapped to pathways involved in amino acid metabolism (supplemental Figure 7B-C). In addition, upstream regulator analysis,17 which allows identification of transcription factors acting upstream of differentially expressed target genes, predicted that the activity of ATF4 and other AAR target genes (GCN2, PERK, ERN1) to be suppressed by the combination treatment (Figure 5B; supplemental Table 4).17 Conversely, TRIB3, the proapoptotic effector of the AAR, which we also identified in our CRISPR/CAS9 screen, appeared to be activated by the combination treatment (Figure 5B). Moreover, many of the genes that are suppressed by ASNase but activated by the combination treatment are targets of P53 (Figure 5A-B). This finding suggests that the combination treatment suppresses the cytoprotective effect of the AAR, forcing these cells into apoptosis.
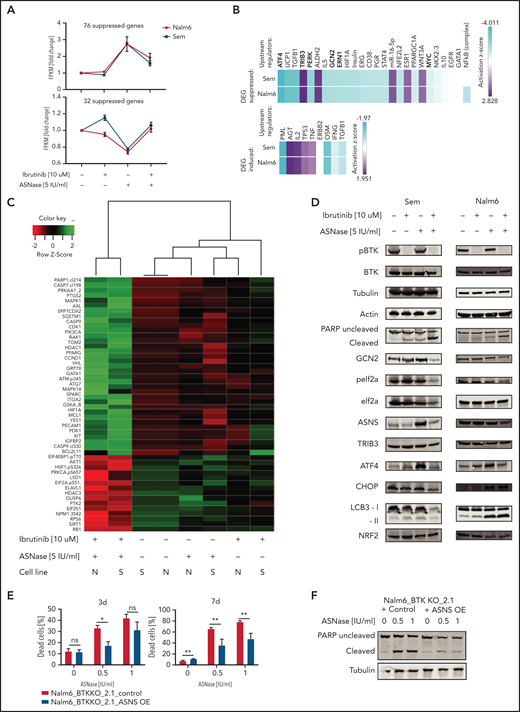
BTK signaling intersects with the amino acid stress response pathway. (A) Fold induction of fragments per kilobase million (FPKM) values of RNA expression of genes upregulated (upper panel) or downregulated (lower panel) in response to ASNase treatment while suppressed (upper panel) or induced (lower panel) when combined with ibrutinib. RNA expression in Nalm6 and Sem cells treated with ASNase, ibrutinib, or a combination of both was determined by RNA sequencing. (B) Upstream regulators of gene products identified in panel (A) determined by Ingenuity software. (C) Protein expression in Nalm6 and Sem cells treated with ASNase, ibrutinib, or a combination of both as determined by RPPA. Quantified protein expression levels from treated samples were normalized relative to untreated samples and subjected to principal component analysis. The top 50 proteins that contributed most to the difference between the treatments (PC1) were selected, and unsupervised hierarchical clustering with Ward’s linkage was applied. (D) Immunoblot analysis of protein expression. Nalm6 and Sem cells were treated for 72 hours (Sem) or 96 hours (Nalm6) with indicated doses of ASNase and ibrutinib. Representative of 3 independent experiments is shown. (E) Cell death determined by quantification of cells positive for amine-reactive dyes using flow cytometry. Nalm6 BTK KO control cells or cells made to express an ASNS transgene were treated with indicated doses of ASNase. Each bar represents a mean of 3 independent experiments. ***P < .001; **P < .01; ***P < .05 (2-tailed, unpaired Student t test). (F) Apoptosis induction, measured by immunoblot analysis of PARP in Nalm6 BTK KO control cells or cells with ASNS overexpression. Cells were treated with indicated doses of ASNase. A representative of 3 independent experiments is shown.
BTK signaling intersects with the amino acid stress response pathway. (A) Fold induction of fragments per kilobase million (FPKM) values of RNA expression of genes upregulated (upper panel) or downregulated (lower panel) in response to ASNase treatment while suppressed (upper panel) or induced (lower panel) when combined with ibrutinib. RNA expression in Nalm6 and Sem cells treated with ASNase, ibrutinib, or a combination of both was determined by RNA sequencing. (B) Upstream regulators of gene products identified in panel (A) determined by Ingenuity software. (C) Protein expression in Nalm6 and Sem cells treated with ASNase, ibrutinib, or a combination of both as determined by RPPA. Quantified protein expression levels from treated samples were normalized relative to untreated samples and subjected to principal component analysis. The top 50 proteins that contributed most to the difference between the treatments (PC1) were selected, and unsupervised hierarchical clustering with Ward’s linkage was applied. (D) Immunoblot analysis of protein expression. Nalm6 and Sem cells were treated for 72 hours (Sem) or 96 hours (Nalm6) with indicated doses of ASNase and ibrutinib. Representative of 3 independent experiments is shown. (E) Cell death determined by quantification of cells positive for amine-reactive dyes using flow cytometry. Nalm6 BTK KO control cells or cells made to express an ASNS transgene were treated with indicated doses of ASNase. Each bar represents a mean of 3 independent experiments. ***P < .001; **P < .01; ***P < .05 (2-tailed, unpaired Student t test). (F) Apoptosis induction, measured by immunoblot analysis of PARP in Nalm6 BTK KO control cells or cells with ASNS overexpression. Cells were treated with indicated doses of ASNase. A representative of 3 independent experiments is shown.
To further corroborate our findings, we performed an RPPA analysis, in which we evaluated expression and/or activation state of 235 key cancer-related proteins in response to treatment.13 Using this platform, we compared the RPPA proteome from Nalm6 and Sem cells that were either left untreated or exposed to ASNase or ibrutinib as a single agent or in combination (Figure 5C). Although each single treatment only had moderate effect on protein expression in both cell lines, the combination treatment profoundly affected protein expression/phosphorylation, consistent with the observed strong synergy between both drugs (Figure 5C). In line with our previous results, pro-apoptotic activators such as cleaved caspase (7 and 9) or PARP and Bcl2L11 (Bim) were only mildly affected by single agent treatment but strongly increased when the 2 drugs were combined. In accordance with our transcriptomic data, the combination treatment specifically affected expression and phosphorylation of several proteins involved in the AAR, including the phosphorylated form of the translation factor eIF2α, suggesting that ibrutinib suppresses the ability of cells to mount the AAR (Figure 5C), a finding further verified by western blotting (Figure 5D). Moreover, this analysis also identified other AAR proteins affected by the ASNase/ibrutinib combination treatment, including ATF4, asparagine synthetase [glutamine-hydrolyzing] (ASNS) (Figure 5D). Furthermore, ASNase-induced apoptosis in BTK-deleted cells could be rescued by overexpression of ASNS (Figure 5E-F), confirming that the suppression of the AAR is responsible for the induction of cell death in BTK-deficient cells.
Based on the observation that many of the affected genes/proteins act downstream of GCN2, we hypothesized that ibrutinib might suppress GCN2 function. Indeed, targeted KO (Figure 1E) as well as pharmacological inhibition could phenocopy the effects of ibrutinib on the response to ASNase (supplemental Figure 8A). Furthermore, ibrutinib almost completely lost its potentiating effect on ASNase-induced killing in GCN2 KO cells, which underscores its central role in ibrutinib’s effects on ASNase-induced cell death (supplemental Figure 8B).
To obtain further insight into how BTK inhibition suppresses the GCN2-ATF4 axis, we repeated the upstream regulator analysis using all genes that were differentially expressed between ASNase and the combination treated cells. This analysis identified c-Myc as the most prominently suppressed transcription factor (Figure 6A). Of note, activity of BRD4, a known cofactor and activator of c-Myc, was also predicted to be suppressed in 1 of the cell lines, whereas activity of MXD1, a protein antagonizing the activity of c-Myc, was found activated.
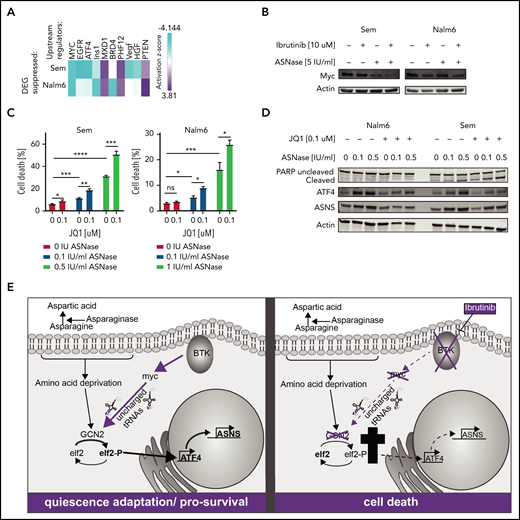
Loss of BTK potentiates ASNase-induced apoptosis by repression of GCN2 activity mediated by c-Myc. (A) Upstream regulators of genes differentially expressed in Nalm6 and Sem treated with ASNase alone vs treatment with ASNase and ibrutinib, determined by Ingenuity software. (B) Immunoblot analysis of c-Myc protein expression. Nalm6 and Sem cells were treated for 72 hours (Sem) or 96 hours (Nalm6) with indicated doses of ASNase and ibrutinib. (C) Cell death determined by quantification of cells positive for amine-reactive dyes using flow cytometry. Nalm6 and Sem cells were treated with indicated doses of JQ1 and/or ASNase for 3 days (Sem) or 6 days (Nalm6). Each bar represents a mean of 3 independent experiments. ***P < .001; **P < .01; ***P < .05 (2-tailed, unpaired Student t test). (D) Immunoblot analysis of PARP, ATF4, ASNS, and actin. Nalm6 and Sem cells were treated for 72 hours with indicated doses of ASNase and JQ1. (E) Working model explaining the synergistic interaction of BTK inhibition and ASNase treatment. In response to ASNase treatment, cells upregulate the AAR pathway via GCN2 to adapt to nutrient stress. BTK inhibition renders cells incapable of activating c-Myc, thus preventing activation of the GCN2-ATF4 axis. As a consequence, cells cannot mount an appropriate amino acid stress response and eventually die.
Loss of BTK potentiates ASNase-induced apoptosis by repression of GCN2 activity mediated by c-Myc. (A) Upstream regulators of genes differentially expressed in Nalm6 and Sem treated with ASNase alone vs treatment with ASNase and ibrutinib, determined by Ingenuity software. (B) Immunoblot analysis of c-Myc protein expression. Nalm6 and Sem cells were treated for 72 hours (Sem) or 96 hours (Nalm6) with indicated doses of ASNase and ibrutinib. (C) Cell death determined by quantification of cells positive for amine-reactive dyes using flow cytometry. Nalm6 and Sem cells were treated with indicated doses of JQ1 and/or ASNase for 3 days (Sem) or 6 days (Nalm6). Each bar represents a mean of 3 independent experiments. ***P < .001; **P < .01; ***P < .05 (2-tailed, unpaired Student t test). (D) Immunoblot analysis of PARP, ATF4, ASNS, and actin. Nalm6 and Sem cells were treated for 72 hours with indicated doses of ASNase and JQ1. (E) Working model explaining the synergistic interaction of BTK inhibition and ASNase treatment. In response to ASNase treatment, cells upregulate the AAR pathway via GCN2 to adapt to nutrient stress. BTK inhibition renders cells incapable of activating c-Myc, thus preventing activation of the GCN2-ATF4 axis. As a consequence, cells cannot mount an appropriate amino acid stress response and eventually die.
Indeed, we observed a decrease in protein expression of c-Myc in response to ibrutinib, particularly when combined with ASNase (Figure 6B), which cannot be fully explained by changes in mRNA expression (supplemental Figure 8C). Myc is known to play a prominent role in fueling cancer metabolism to sustain cell growth and proliferation. It was shown recently, that c-Myc activates GCN2 by increasing the presence of newly synthesized uncharged tRNAs,27 leading to upregulation of ATF4. Furthermore, c-Myc is intimately linked to BCR signaling.28,29 Whereas overexpression of c-Myc enhances BCR signaling,30 inhibition of c-Myc can be used to prevent or overcome ibrutinib resistance.31 The notion that ibrutinib suppresses c-Myc function in solid tumors32,33 has led to the development of clinical trials studying the efficacy of ibrutinib in Myc-transformed tumors. To confirm a role for c-Myc in the suppression of the GCN2-ATF4 pathway in response to ibrutinib, we investigated whether loss of c-Myc activity would mirror the effects of ibrutinib on ASNase-induced apoptosis. Therefore, we used the BET bromodomain inhibitor JQ1 to target BRD4 activity and, by proxy, the c-Myc transcriptional activity.34 Similar to ibrutinib, JQ1 potentiated ASNase-induced apoptosis by preventing activation of ATF4 and ASNS (Figure 6C-D).
Conversely, we investigated whether ectopic expression of c-Myc would blunt the apoptosis-potentiating effect that ibrutinib has on ASNase treatment. As we observed that sustained overexpression of c-Myc was incompatible with cell proliferation, we introduced a doxycycline inducible c-Myc gene in Nalm6 and Sem cells by lentiviral transduction. Cells were pretreated for 1 day with doxycycline to induce expression of c-Myc (supplemental Figure 8D) before the addition of ibrutinib, ASNase, or a combination of both. Indeed, in c-Myc–overexpressing cells, a reduction in cell death was observed in response to the combination treatment relative to control cells (supplemental Figure 8E). Together, our findings support a model in which BTK signaling modifies the AAR by regulation of c-Myc, which in turn controls GCN2 activity (Figure 6E). Future experiments will have to provide more insights regarding the exact molecular mechanisms behind this regulation.
Discussion
Amino acid deprivation has recently gained interest as a therapeutic intervention, even beyond hematological malignancies.2,3 The successful application of these metabolic therapies may allow less intensive use of classical chemotherapeutics such as DNA-damaging agents, reducing the potential risk of long-term adverse effects or the occurrence of secondary malignancies. In this study, we show the potential of combining amino acid depletion with small molecule inhibitors that further sensitize tumor cells to this form of treatment. A CRISPR/Cas9-based loss-of-function screen allowed us to identify BTK as a therapeutic target that strongly enhances the clinical efficacy of ASNase. Inhibition of BTK function, either by gene disruption or by pharmacological inhibition, synergizes with ASNase treatment to induce leukemic cell death. This effect is seen in cell lines and xenografts of pediatric BCP-ALL samples across cytogenetic subtypes as well as in some T-ALL models. In contrast to treatment with ASNase or ibrutinib as a single agent, which appears to induce a reversible state of cellular quiescence, the combination therapy effectively kills the leukemic cells. The lack of cell killing at clinically relevant doses of ASNase is somewhat surprising, but it may relate to the relative short treatment duration (between 3 and 7 days) that was used in most of our experiments and the fact that ASNase in a patient is given in combination with other therapies.
Our findings further indicate that inhibition of BTK signaling interferes with c-Myc function. As a result of the reduced c-Myc–induced proteotoxic stress, GCN2 kinase activity, a critical regulator of the AAR pathway, is suppressed.27 The exact mechanism by which loss of BTK activity acts to inhibit c-Myc remains to be fully resolved, although our results favor a posttranscriptional mechanism. We demonstrate that the observed inhibition of GCN2 protein activity and the resulting decrease in eIF2 phosphorylation limits the ability of leukemic cells to activate ATF4 and adapt to amino acid deprivation.
GCN2 is an essential regulator of the cellular response to amino acid limitation in all tissues. Although the use of a GCN2 inhibitor has been explored in preclinical studies,35 observations in GCN2 KO mice suggest that loss of GCN2 function enhances the risk of treatment-related morbidities such as liver toxicity and pancreatitis.36,37 In contrast, BTK expression in healthy individuals is largely restricted to the hematopoietic compartment and therefore allows tissue-specific treatment. Ibrutinib is currently used for the treatment of indolent B-cell malignancies, particularly chronic lymphocytic leukemia, and is generally well tolerated. Moreover, the addition of ibrutinib did not enhance the toxic effects of ASNase.
Recently, a potential clinical use of ibrutinib in pre–BCR-positive ALL was suggested.38 Despite the fact that BTK function is mostly associated with pre-BCR signaling, it has other functions independent of the BCR.39 One of the intriguing observations of our study is the finding that the combination therapy is effective across BCP-ALL subtypes, regardless of B-cell maturation status or the presence of an active pre-BCR and may therefore be more broadly applicable.
Combining ibrutinib with ASNase in the treatment of BCP-ALL may have several additional benefits. Leukemic cell infiltration of the CNS poses a challenge for successful treatment, for instance, because of the limited penetrance of therapeutic compounds through the blood-brain-barrier (BBB). Although the therapeutic protein ASNase will not cross the BBB, it is effective in lowering asparagine levels in the cerebrospinal fluid through exchange with the blood. However, depletion in the cerebrospinal fluid can be incomplete, creating a sanctuary site that allows leukemic cells to survive.5,40 Importantly, ibrutinib was shown to cross the BBB.41-43 Therefore, we hypothesize that ASNase/ibrutinib combination therapy may also effectively reduce the threshold for ASNase-induced apoptosis in the CNS.
Moreover, in patients with chronic lymphocytic leukemia, ibrutinib treatment leads to transient lymphocytosis, forcing the leukemic cells out of the bone marrow as a result of repression of expression of adhesion receptors.44 Because the bone marrow microenvironment has been recognized as a potential protective niche that supports leukemic cell survival during ASNase treatment, this could provide an additional therapeutic benefit. Finally, because ibrutinib was shown to inhibit allergic response,45 it may also prevent the formation of inhibitory antibodies or immune cell–related toxicities, the most frequently occurring adverse effects of ASNase treatment.4
In summary, our study shows that that inhibition of BTK signaling effectively suppresses the AAR, sensitizing BCP-ALL cells to ASNase-induced apoptosis. Because ectopic expression of BTK has been reported in a variety of other tumor types responsive to ASN depletion,46,47 the results from our study may have clinical implications beyond B-cell malignancies.
Acknowledgments
The authors thank Didier Trono for providing psPAX2 (Addgene plasmid 12260) and pMD2.G (Addgene plasmid 12259), Eric Lander and David Sabatini for providing pCW-Cas9 (Addgene plasmid 50661), Human CRISPR enriched pooled library (Addgene 51044), Feng Zhang for providing plentiCRISPR, and Irene Paassen and Jarno Drost for providing pCW-myc.
This work was supported, in part, by research funding from Dutch Cancer Society (KWF; grant 10072 and grant 11249), a young investigator grant from Radboudumc (M.B.), a short-term European Molecular Biology Organization (EMBO) fellowship (M.B.) (6870, ASTF 626-2016), Swiss National Science Foundation (SNF; grant 310030-182269) (B.B., J.-P.B.), Fondation Panacée, (B.B., J.-P.B.), Stiftung Kinderkrebsforschung Schweiz (B.B., J.-P.B.), and Sophienstiftung (B.B., J.-P.B.).
Authorship
Contribution: M.B. and L.T.v.d.M. designed and performed experiments and analyzed and interpreted data and wrote the manuscript; F.N.v.L. interpreted the data and wrote the manuscript; F.N.v.L. and L.T.v.d.M. initiated the project and supervised the work; D.S.v.I.S. performed experiments presented in Figure 4E-G and supplemental Figure 6; J.Y. analyzed the data presented in Figure 1B-C and supplementary Figure 1B-E; R.H. and J.P.M. supported analysis of the data presented in Figure 4B-C and supplemental Figures 5F-H and 7; R.P.K. supervised work presented in Figure 1B-C and supplemental Figure 1B-E; S.J., M.P.D., B.B., and J.-P.B. supervised the work presented in Figure 4A-C; T.M.T. and B.M.T.V. performed experiments presented in supplemental Figure 5D; and F.W.H. and S.M.K. performed and analyzed data presented in Figure 5C.
Conflict-of-interest disclosure: L.T.v.d.M. and F.N.v.L. are inventors on a patent application that describes the use of amino acid depleting agents in combination with amino acid depletion sensitizers (USSN 62/725 313). The remaining authors declare no competing financial interests.
Correspondence: Frank N. van Leeuwen, Heidelberglaan 25, Research Building, 3rd Floor, Room 3-4K1, 3584 CS Utrecht, The Netherlands; e-mail: F.N.vanleeuwen@prinsesmaximacentrum.nl.
The online version of this article contains a data supplement.
The publication costs of this article were defrayed in part by page charge payment. Therefore, and solely to indicate this fact, this article is hereby marked “advertisement” in accordance with 18 USC section 1734.

This feature is available to Subscribers Only
Sign In or Create an Account Close Modal