

Key Points
SOX11+ MCL has a tumor microenvironment with reduced number of immune cells and down-modulation of genes involved in antitumor response.
CD70 is overexpressed in SOX11+ MCL associated with increased Treg cell infiltration, high proliferation, and aggressive clinical course.

Abstract
Mantle cell lymphoma (MCL) is a mature B-cell neoplasm with a heterogeneous clinical and biological behavior. SOX11 oncogenic expression contributes to the aggressiveness of these tumors by different mechanisms, including tumor and stromal cell interactions. However, the precise composition of the immune cell microenvironment of MCL, its possible relationship to SOX11 expression, and how it may contribute to tumor behavior is not well known. Here, we performed an integrative transcriptome analysis of 730 immune-related genes combined with the immune cell phenotype analysis by immunohistochemistry in SOX11+ and SOX11− primary nodal MCL cases and non-neoplastic reactive lymph nodes. SOX11+ MCL had a significant lower T-cell intratumoral infiltration compared with negative cases. A reduced expression of MHCI/II-like and T-cell costimulation and signaling activation related transcripts was significantly associated with poor clinical outcome. Moreover, we identified CD70 as a SOX11 direct target gene, whose overexpression was induced in SOX11+, but not SOX11− tumor cells by CD40L in vitro. CD70 was overexpressed in primary SOX11+ MCL and it was associated with an immune unbalance of the tumor microenvironment characterized by increased number of effector regulatory T (Treg) cell infiltration, higher proliferation, and aggressive clinical course. CD27 was expressed with moderate to strong intensity in 76% of cases. Overall, our results suggest that SOX11 expression in MCL is associated with an immunosuppressive microenvironment characterized by CD70 overexpression in tumor cells, increased Treg cell infiltration and downmodulation of antigen processing, and presentation and T-cell activation that could promote MCL progression and represent a potential target for tailored therapies.
Introduction
Mantle cell lymphoma (MCL) is considered one of the most aggressive B-cell lymphoid neoplasms with short median overall survival (OS) (3-5 years).1-3 However, several studies have identified a subset of patients with an indolent evolution that are characterized by a leukemic non-nodal presentation, frequently associated with splenomegaly. Contrary to most conventional MCL, these cases do not express the transcription factor sex determining region Y-box 11 (SOX11).4-7 SOX11 contributes to MCL oncogenesis and aggressive behavior through several mechanisms that include blocking the B-cell differentiation program, activation of the B-cell receptor (BCR) signaling pathway, and regulating different interactions between tumor cells and the microenvironment.8-14 Some studies have shown that the number of CD4+ T cells in peripheral blood and tumor infiltrate of MCL positively correlate with low proliferation, indolent disease, and favorable outcome.15,16 On the other hand, CD40/CD40L interactions seem to promote MCL proliferation and survival.17,18 However, the precise composition of the immune cell microenvironment of MCL, its possible relationship to SOX11 expression, and how it may contribute to tumor behavior is not well known.19,20 To address these issues, we have performed an integrative immune-transcriptome and immune-cell phenotype analysis in primary MCL to identify immunological mediators of MCL progression.
Methods
Patients and samples
A series of 64 formalin-fixed paraffin-embedded (FFPE) lymph node tissue samples from patients diagnosed with MCL and obtained previous to any treatment was included for immunohistochemistry (IHC) studies. Fourteen of these cases (11 SOX11+ and 3 SOX11−, with high tumor cell content [>80%]), and 6 nonneoplastic reactive lymph nodes (RLNs), diagnosed as follicular and/or paracortical lymphoid hyperplasia (negative for Epstein-Barr virus and other specific diseases), were used for gene expression analysis with the NanoString PanCancer Immune Profiling Panel. Tumor cell content in all primary MCL samples was evaluated by cyclin D1 IHC staining (supplemental Figure 1A, on the Blood Web site).
All cases were diagnosed according to the 2017 World Health Organization classification of lymphoid neoplasms.1 Clinicopathological features of all patients are shown in supplemental Table 1. All patients with SOX11+ MCL were treated with chemotherapy at diagnosis. For the survival analysis, only those patients with SOX11+ MCL treated with rituximab-containing regimens were considered, whereas patients who received allogeneic stem cell transplantation were excluded to avoid differences in overall survival associated with this treatment. SOX11− MCL cases are enriched in cases with high proliferation and blastoid cytological variant, most of them with mutations in TP53 and more aggressive behavior. The study was approved by the Institutional Review Board of the Hospital Clínic, Barcelona, Spain.
Immunohistochemical studies
Immunohistochemical stainings were performed on 2-µm-thick FFPE tissues using specific antibodies (supplemental Table 2). Tonsil sections were used as controls. Intratumoral immune cell populations were quantified using a digital image analysis system, as previously described.21,22 Stained sections were digitalized and 5 photographic images of representative intratumoral areas, as previously described.22 The numbers of positive stained intratumoral cells were counted with an Olympus Cell-B Basic Imaging Software. CD27 staining was qualitatively evaluated as negative/weak, moderate, and strong in comparison with the strong T-cell staining and also quantitatively using an image analysis system (supplemental Methods). Single and double IHC protocols and details on histopathological evaluations and analysis are provided in the supplemental Methods.
Gene expression analysis
The NanoStringCounter PanCancer Immune Profiling Panel was studied according to the manufacturer's instructions (NanoString Technologies, Inc, Seattle, WA). For this study, we used messenger RNA (mRNA) from 14 FFPE untreated nodal MCL biopsies (11 SOX11+ and 3 SOX11−) and 6 RLNs used as control samples. Nucleic acids were extracted from 10-µm sections of FFPE biopsies using the QIAGEN AllPrep DNA/RNA FFPE Kit (QIAGEN, Hilden, Germany) after deparaffinization, according to the manufacturer instructions. The quality and concentration were assessed using a NanoDrop spectrophotometer (Thermo Fisher Scientific, Inc, Waltham, MA). The nCounter Analysis System was used to examined the predicted immune cell content, determined by the expression of specific immune subtype cell markers (Figure 1; supplemental Methods). The NanoString gene expression profiling (GEP) data are available at GEO under accession number GSE141539.
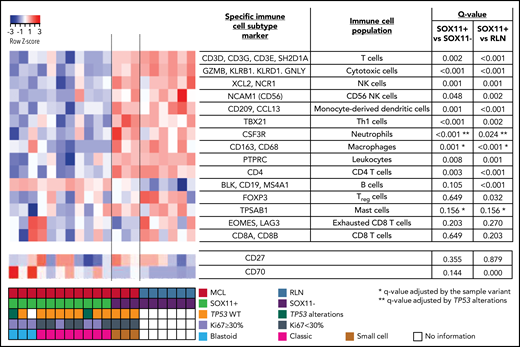
NanoString-based immune cell content in nodal MCLs. (A) Heatmap showing scaled (z score) raw abundance of different immune cell populations, and CD27 and CD70 mRNA expression, using the nCounter Analysis System, comparing the NanoString immune GEP of 11 SOX11-positive (SOX11+) and 3 negative (SOX11−) nodal MCLs, and 6 nontumoral reactive lymph nodes (RLN) samples. Red indicates high abundance; blue indicates low abundance. Genes used as specific immune cell subtype markers to determine different immune cell populations and the adjusted P values are indicated in the right part of the heatmap. P value correction was performed independently for immune cell populations and for individual genes. The comparisons in the macrophages, mast cells, and neutrophils immune cell populations were adjusted by potential confounding factors (*blastoid/pleomorphic cytological variant for the first 2 and **TP53 alterations for the latter) (supplemental Figure 1D-F). Molecular features of MCL cases are shown at the bottom.
NanoString-based immune cell content in nodal MCLs. (A) Heatmap showing scaled (z score) raw abundance of different immune cell populations, and CD27 and CD70 mRNA expression, using the nCounter Analysis System, comparing the NanoString immune GEP of 11 SOX11-positive (SOX11+) and 3 negative (SOX11−) nodal MCLs, and 6 nontumoral reactive lymph nodes (RLN) samples. Red indicates high abundance; blue indicates low abundance. Genes used as specific immune cell subtype markers to determine different immune cell populations and the adjusted P values are indicated in the right part of the heatmap. P value correction was performed independently for immune cell populations and for individual genes. The comparisons in the macrophages, mast cells, and neutrophils immune cell populations were adjusted by potential confounding factors (*blastoid/pleomorphic cytological variant for the first 2 and **TP53 alterations for the latter) (supplemental Figure 1D-F). Molecular features of MCL cases are shown at the bottom.
We also used the previously published GEP datasets of untreated patients with MCL: GSE7091023 and GSE93291.24 The GSE70910 dataset contains the GEP of 53 SOX11+ primary MCL samples extracted from 41 patients with MCL (34 samples from unpurified lymph nodes, 4 CD19+ purified lymphoma cells from lymph nodes, and 15 CD19+ purified cells from leukemic peripheral blood samples). We used these data to establish whether the immune genes differentially modulated in SOX11+, SOX11− nodal MCLs, and RLNs, identified by our NanoString-based immune panel, were expressed by tumor and/or nonmalignant cells present in the lymph node microenvironment and if they were modulated in the nodal and peripheral blood compartments. The GSE93291 dataset contains the GEP and survival data from 122 SOX11+ nodal MCL. We used these data to analyze the prognostic impact of different parameters identified in this study. Detailed information of the processing and analysis of these 2 datasets is described in the supplemental Methods.
CD40L-mediated in vitro activation of CD70 expression in MCL cell lines
Stable transduced Z138 SOX11-knockdown (Z138SOX11KD), JVM2 ectopically overexpressing SOX11 (JVM2SOX11+), and their respective control (Z138CT and JVM2CT) MCL cell line models, previously generated by our group,8,12 were used for in vitro experiments. All MCL cell lines were seeded at 106 cell/mL and incubated for 6 hours with phosphate buffer saline (CD40L at 50 ng/mL [Sigma], transforming growth factor-β [TGF-β] 20 ng/mL [Biolegend], or anti-immunoglobulin M [IgM] 10 µg/mL [Southern Biotech]),25 to activate the BCR. Subsequently, CD70 mRNA and protein expression was analyzed by reverse transcriptase quantitative polymerase chain reaction (RT-qPCR) and flow cytometry (FC), respectively. Details of the RT-qPCR and FC experiments information are provided in the supplemental Methods.
Statistical analysis
Independent sample Student t test was used to compare continuous variables between groups. Linear models were used to adjust for confounding variables and evaluate the independent association of multiple variables with a continuous dependent variable. Pearson correlation was used to measure the association between continuous variables. The log-rank test and Cox regression were used to measure the association of categorical and continuous variables, respectively, with OS from time of sampling. Cox regression was used to evaluate the independent prognostic value of multiple variables. All numeric variables were included as continuous variables in the multivariate models, except for SOX11 positivity (cutoff = 10%). Survival analyses and differential expression analyses were performed using R (v3.6.3). Additional statistical analyses are detailed in the supplemental Methods.
Results
SOX11+ nodal MCLs are characterized by a down-modulation of immune cell populations
To characterize the immunological ecosystem of the MCL tumor microenvironment (TME), we analyzed the expression of 730 genes related to the innate and adaptive immune system in 11 SOX11+ and 3 SOX11− MCL and 6 RLNs. Using the nCounter Analysis System, we examined the predicted immune cell content, determined by the expression of specific immune subtype cell markers (Figure 1). These data showed that the immune cell subtype scores of most immune cell populations were reduced in SOX11+ compared with SOX11− MCL and RLNs. On the contrary, the B-cell content score (CD19, BLK, and MS4A1 [CD20]), was slightly increased in SOX11+ MCLs. We excluded differences in the tumor cell content between SOX11+ and SOX11− MCLs because they had a similarly high number of CD20 and cyclin D1+ cells (supplemental Figure 1A-C). Given that several SOX11+ cases had adverse risk features absent in the 3 SOX11− cases (Ki67 >30%, blastoid/pleomorphic cytological variant, and TP53 alterations), we adjusted the comparisons of the immune cell scores by these features when needed. Specifically, the macrophage and mast cell signatures were up and down, respectively, in blastoid/pleomorphic cases and the neutrophil score was down in cases with TP53 alterations. None of the immune cell population scores was significantly influenced by the Ki67 index (supplemental Figure 1D-F). The adjusted comparisons showed virtually the same differences between SOX11+, SOX11−, and RLN cases (Figure 1). The downregulation of CD19 mRNA in SOX11− MCL cases (supplemental Figure 1G), which could explain the greater B-cell content score in SOX11+ MCLs, was consistent with our previous observed down-modulation of CD19 upon SOX11 silencing in MCL cell lines.8
We next evaluated the clinical impact of the downregulation of these immune cell population in primary MCL cases using the GEP data of 122 SOX11+ nodal MCL samples (GSE93291).24 Only a low T-cell population score was associated with significant shorter OS of the patients (supplemental Figure 1H).
To confirm these observations, we evaluated different immune cell populations by IHC in SOX11+ and SOX11− cases, including the 14 nodal MCLs studied by NanoString (Figure 2A-B). The number of CD4+ T cells, the CD4+/CD8+ T-cell ratio, and granzyme B+ cytotoxic cells were significantly lower in SOX11+ MCL, concordantly with the observations by the GEP nCounter Analysis (Figure 1). Intratumoral LAG3+, CD56+, and CD163+ cells were scarce in the majority of cases and were not significantly different between SOX11+ and SOX11− MCL (supplemental Figure 2A-B).
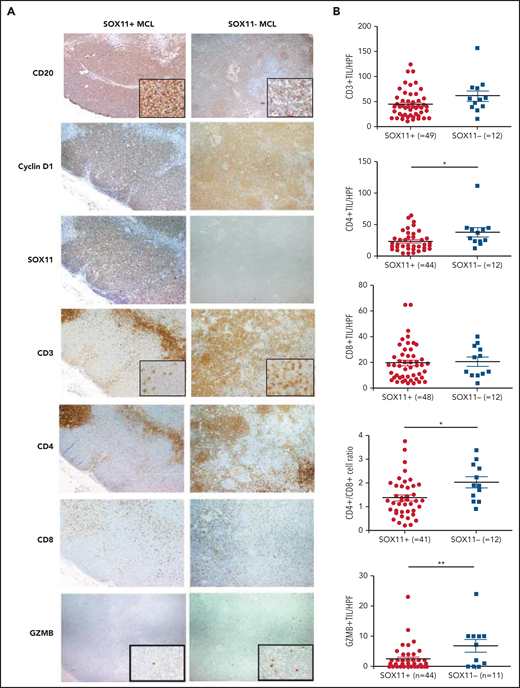
Decreased infiltration of CD3+, CD4+, and granzyme-B+ tumor-infiltrating lymphocytes (TILs) in SOX11+ compared with SOX11− nodal MCL primary cases. (A) Representative histological sections from SOX11+ and SOX11− nodal MCLs stained with specific anti-human CD20, cyclin D1, SOX11, CD3, CD4, CD8, and granzyme B (GZMB) antibodies (×40). Pictures contain insets with magnification (×200). (B) IHC quantifications of CD3+, CD4+, CD8+, and GZMB+ TILs and CD4+/CD8+ T-cell ratio in SOX11+ and SOX11− nodal MCLs. The significance of difference was determined by independent-samples Student t test: *P < .05, **P < .01. HPF, number of cells per high-power field (×400).
Decreased infiltration of CD3+, CD4+, and granzyme-B+ tumor-infiltrating lymphocytes (TILs) in SOX11+ compared with SOX11− nodal MCL primary cases. (A) Representative histological sections from SOX11+ and SOX11− nodal MCLs stained with specific anti-human CD20, cyclin D1, SOX11, CD3, CD4, CD8, and granzyme B (GZMB) antibodies (×40). Pictures contain insets with magnification (×200). (B) IHC quantifications of CD3+, CD4+, CD8+, and GZMB+ TILs and CD4+/CD8+ T-cell ratio in SOX11+ and SOX11− nodal MCLs. The significance of difference was determined by independent-samples Student t test: *P < .05, **P < .01. HPF, number of cells per high-power field (×400).
Immune GEP reveals changes in the TME that may influence the antitumor immune response in SOX11+ MCL
We then explored the differential modulation of specific immune-regulatory genes and pathways in MCL using the NanoString GEP of SOX11+, SOX11− MCL, and RLNs. We observed that 190 of the 730 (26%) genes were significantly downregulated, whereas only 24 (3%) genes were upregulated in SOX11+ compared with SOX11− MCLs and RLNs (supplemental Figure 3A-B; supplemental Tables 3 and 4). Few genes were differentially expressed between SOX11− nodal MCL and RLNs (supplemental Figure 3C; supplemental Table 5). The differential expression of these genes was not influenced by the adverse risk factors (blastoid/pleomorphic variant, TP53 alterations, or high Ki67 index) (supplemental Figure 3D-F).
To determine whether the downregulated genes in SOX11+ MCL (Figure 3A-B) were expressed in tumor or microenvironment cells, we reanalyzed the expression of these 190 genes in the previously published data of 34 unpurified nodal MCLs, 4 CD19+ purified lymph nodes, and 15 CD19+ purified cells from peripheral blood SOX11+ MCL samples (GSE70910).23 In this analysis, the expression of 124 of the 190 (65%) genes was significantly higher in the unpurified nodal samples than in the purified CD19+ cells from nodal or peripheral blood samples (supplemental Figure 4A-B; supplemental Table 6), suggesting that these genes must be mainly expressed by nonmalignant cells present in the lymph node microenvironments (Figure 3C). These 124 genes were significantly enriched in gene ontology pathways related to cytokine–cytokine receptor interactions, cell adhesion molecules, T-cell costimulation and signaling activation, and natural killer cell-mediated cytotoxicity (supplemental Table 7). To determine the possible clinical impact of the downregulation of these pathways, we generated a set of scores averaging the expression of the genes in each pathway and then evaluated their association with the outcome of 122 patients with SOX11+ MCL (GSE93291).24 A low score of the T-cell costimulation and signaling activation pathway (supplemental Figure 4C-D), but not of the other pathways, was associated with significant shorter OS of the patients (Figure 3D; supplemental Table 7).
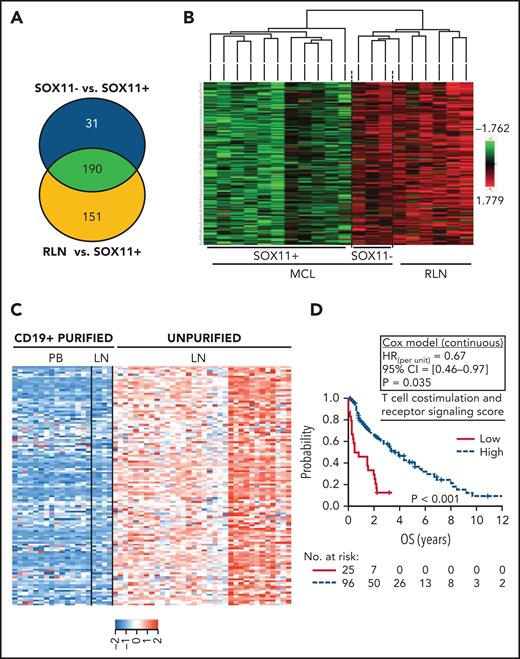
Downregulation of transcripts related to T-cell costimulation, activation, and receptor signaling pathway DAVID annotated functions in SOX11+ nodal MCLs is associated with worse outcome. (A) Venn diagram showing the overlap between the NanoString-based statistically significant downregulated genes in SOX11+ compared with SOX11− nodal MCL (221 genes; blue circle) and SOX11+ compared with RLNs (341 genes; yellow circle). Genes with an adjusted P < .15 were considered. (B) Heatmap showing common 190 significant downregulated genes in SOX11+ compared with SOX11− nodal MCLs and RLNs. Red represents increased scaled expression and green reduced expression. (C) Heatmap illustrating the scaled expression of 124 genes, significantly downregulated in SOX11+ compared with SOX11− nodal MCLs and RLNs, in the previously published data of 34 unpurified nodal MCL (unpurified LN), 4 CD19+ purified cells from the same LN and 15 CD19+ purified cells from the peripheral blood (PB) samples of SOX11+ MCLs (GSE70910). Red represents increased expression and blue decreased expression. (D) Kaplan-Meier curve and Cox regression showing the association of the T-cell costimulation, activation, and receptor signaling score with OS, using 121 nodal MCL cases previously published (GSE93291) (see supplemental Methods). The score was calculated as the average expression of the genes included in the corresponding T-cell ontology functions (supplemental Table 7) by the Database for Annotation, Visualization and Integrated Discovery (DAVID) software. High values were defined by Maxstat (cutoff point = 7.6). Log-rank test P value, hazard ratio (HR) with 95% confidence interval (CI), and Cox regression P value are shown. LN, lymph node.
Downregulation of transcripts related to T-cell costimulation, activation, and receptor signaling pathway DAVID annotated functions in SOX11+ nodal MCLs is associated with worse outcome. (A) Venn diagram showing the overlap between the NanoString-based statistically significant downregulated genes in SOX11+ compared with SOX11− nodal MCL (221 genes; blue circle) and SOX11+ compared with RLNs (341 genes; yellow circle). Genes with an adjusted P < .15 were considered. (B) Heatmap showing common 190 significant downregulated genes in SOX11+ compared with SOX11− nodal MCLs and RLNs. Red represents increased scaled expression and green reduced expression. (C) Heatmap illustrating the scaled expression of 124 genes, significantly downregulated in SOX11+ compared with SOX11− nodal MCLs and RLNs, in the previously published data of 34 unpurified nodal MCL (unpurified LN), 4 CD19+ purified cells from the same LN and 15 CD19+ purified cells from the peripheral blood (PB) samples of SOX11+ MCLs (GSE70910). Red represents increased expression and blue decreased expression. (D) Kaplan-Meier curve and Cox regression showing the association of the T-cell costimulation, activation, and receptor signaling score with OS, using 121 nodal MCL cases previously published (GSE93291) (see supplemental Methods). The score was calculated as the average expression of the genes included in the corresponding T-cell ontology functions (supplemental Table 7) by the Database for Annotation, Visualization and Integrated Discovery (DAVID) software. High values were defined by Maxstat (cutoff point = 7.6). Log-rank test P value, hazard ratio (HR) with 95% confidence interval (CI), and Cox regression P value are shown. LN, lymph node.
The same analysis was performed for the 66 genes (35% of the 190) without significant expression differences between the unpurified and purified nodal samples (supplemental Table 6). Those genes were significantly enriched in gene ontology pathways related to cytokine–cytokine receptor interactions and antigen processing and presentation. A low score of the later was associated with shorter OS of the patients (supplemental Table 8).
Together, these results suggest that the TME composition in SOX11+ nodal MCLs is characterized by a decreased infiltration of immune cells and a down-modulation of gene sets involved in an effective antitumoral immunity, with a negative impact on the outcome.
CD70 is upregulated in SOX11+ MCL
Most of the 24 upregulated transcripts in SOX11+ MCL (supplemental Tables 3 and 4) have been previously shown to be dysregulated in several aggressive lymphomas (eg, CD70, CD79B),26-28 or in MCL cell lines upon SOX11 silencing (eg, PAX5, CD24).8CD79A, CD19, and BLNK, PAX5 direct target genes in normal B-cell differentiation,29 were upregulated in SOX11+ MCL. These results suggest that CD79A, CD19, and BLNK could be also upregulated by PAX5 in SOX11+ MCL (Figure 4A-B). Interestingly, the levels of the immune checkpoint CD70 were significantly higher in CD19+ purified from lymph nodes than in unpurified lymph nodes or purified peripheral blood samples, suggesting that CD70 expression in tumor cells could be mediated by interactions with the TME (Figure 4C; supplemental Figure 5A-C; supplemental Table 9).
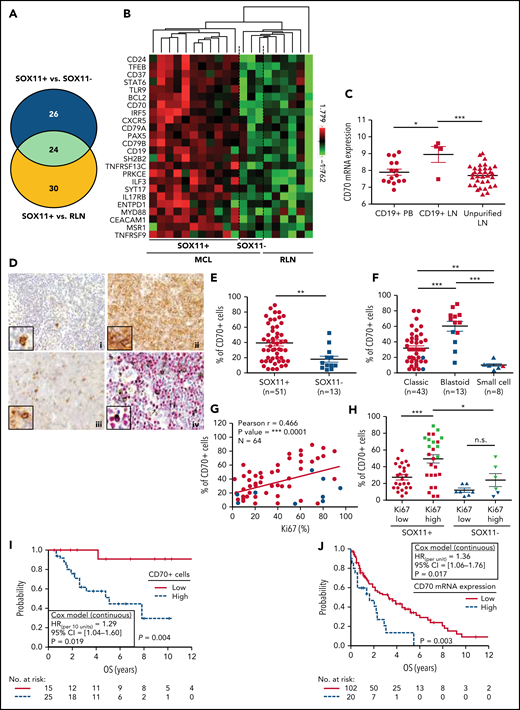
CD70 overexpression in nodal MCLs. (A) Venn diagram showing the overlap between the NanoString-based statistically significant upregulated genes in SOX11+ compared with SOX11− nodal MCLs (50 genes; blue circle) and SOX11+ compared with RLNs (54 genes; yellow circle). (B) Heatmap showing the scaled expression levels of common 24 significant upregulated genes in SOX11+ compared with SOX11− nodal MCLs and RLNs. Red represents increased expression and green reduced expression. Genes with an adjusted P value (Q-value) < .15 were considered. (C) CD70 mRNA expression levels in unpurified lymph node MCL samples (unpurified LN; n = 34), CD19+ purified cells from LN samples (CD19+ LN; n = 4) and peripheral blood samples (CD19+ PB; n = 15) (GSE70910). *q value < .05, ***q value < .001. (D) Representative histological sections from (i) an RLN sample, (ii) SOX11+, and (iii) SOX11− nodal MCL biopsy, stained with specific anti-human CD70 antibody (×100). A double IHC staining with anti-human CD70 (brown) and (iv) anti-human cyclin D1 (red) antibodies (×100) was performed in the same SOX11− nodal MCL case as in (iii) to confirm the expression of CD70 by tumor cells (black arrows). Pictures contain insets with magnification (×400). (E) IHC quantifications of CD70+ cells in our series of SOX11+ (n = 51) and SOX11− (n = 13) nodal MCL primary samples. (F) IHC quantification of CD70 expression in nodal samples according to classic, blastoid/pleomorphic, or small cell MCL variants. (G) Positive correlation between CD70+ and Ki67+ cells, quantified by IHC in our series of nodal MCL. SOX11+ MCL are indicated in red, whereas SOX11− MCLs are in blue. Graphs show Pearson correlation coefficient (r), P value, and number of cases analyzed (N). (H) IHC quantification of CD70 expression in nodal MCL samples according to high (Ki67 >30%) and low (Ki67 ≤30%) proliferation rates in our series of SOX11+ (red) and SOX11− (blue) primary MCL cases. MCL cases diagnosed as blastoid/pleomorphic cytological variant are highlighted in green. The significance of differences was determined by independent samples Student t test: *P < .05, **P < .01, ***P < .001. (I) Kaplan-Meier curve and Cox regression showing the association of CD70+ cells, quantified by IHC using our series of SOX11+ nodal MCL primary samples (n = 40), with OS. (J) Kaplan-Meier curve and Cox regression showing the association of CD70 mRNA expression with OS, using previously published GEP from nodal samples and clinical data from 122 nodal SOX11+ MCL primary cases (GSE93291). High values were defined by Maxstat (cutoff point IHC = 25%, cutoff point mRNA = 9.9). Log-rank test P values, hazard ratios (HR) with 95% confidence interval (CI), and Cox regression P values are shown.
CD70 overexpression in nodal MCLs. (A) Venn diagram showing the overlap between the NanoString-based statistically significant upregulated genes in SOX11+ compared with SOX11− nodal MCLs (50 genes; blue circle) and SOX11+ compared with RLNs (54 genes; yellow circle). (B) Heatmap showing the scaled expression levels of common 24 significant upregulated genes in SOX11+ compared with SOX11− nodal MCLs and RLNs. Red represents increased expression and green reduced expression. Genes with an adjusted P value (Q-value) < .15 were considered. (C) CD70 mRNA expression levels in unpurified lymph node MCL samples (unpurified LN; n = 34), CD19+ purified cells from LN samples (CD19+ LN; n = 4) and peripheral blood samples (CD19+ PB; n = 15) (GSE70910). *q value < .05, ***q value < .001. (D) Representative histological sections from (i) an RLN sample, (ii) SOX11+, and (iii) SOX11− nodal MCL biopsy, stained with specific anti-human CD70 antibody (×100). A double IHC staining with anti-human CD70 (brown) and (iv) anti-human cyclin D1 (red) antibodies (×100) was performed in the same SOX11− nodal MCL case as in (iii) to confirm the expression of CD70 by tumor cells (black arrows). Pictures contain insets with magnification (×400). (E) IHC quantifications of CD70+ cells in our series of SOX11+ (n = 51) and SOX11− (n = 13) nodal MCL primary samples. (F) IHC quantification of CD70 expression in nodal samples according to classic, blastoid/pleomorphic, or small cell MCL variants. (G) Positive correlation between CD70+ and Ki67+ cells, quantified by IHC in our series of nodal MCL. SOX11+ MCL are indicated in red, whereas SOX11− MCLs are in blue. Graphs show Pearson correlation coefficient (r), P value, and number of cases analyzed (N). (H) IHC quantification of CD70 expression in nodal MCL samples according to high (Ki67 >30%) and low (Ki67 ≤30%) proliferation rates in our series of SOX11+ (red) and SOX11− (blue) primary MCL cases. MCL cases diagnosed as blastoid/pleomorphic cytological variant are highlighted in green. The significance of differences was determined by independent samples Student t test: *P < .05, **P < .01, ***P < .001. (I) Kaplan-Meier curve and Cox regression showing the association of CD70+ cells, quantified by IHC using our series of SOX11+ nodal MCL primary samples (n = 40), with OS. (J) Kaplan-Meier curve and Cox regression showing the association of CD70 mRNA expression with OS, using previously published GEP from nodal samples and clinical data from 122 nodal SOX11+ MCL primary cases (GSE93291). High values were defined by Maxstat (cutoff point IHC = 25%, cutoff point mRNA = 9.9). Log-rank test P values, hazard ratios (HR) with 95% confidence interval (CI), and Cox regression P values are shown.
To confirm the high expression of CD70 in tumor cells, we performed IHC staining in 64 nodal MCLs (51 SOX11+ and 13 SOX11−), including the 14 nodal MCLs studied by NanoString. We observed a significant correlation between CD70 protein and mRNA expression levels (supplemental Figure 5D). By double staining of CD70 and cyclin D1, we confirmed the expression of CD70 by tumor cells (Figure 4D). High CD70 protein expression in the whole series was significantly associated with SOX11 positivity, blastoid/pleomorphic morphology, and high Ki67 proliferative index (Figure 4D-H). Remarkably, in SOX11+ cases CD70 protein was more expressed in high proliferative tumors than in lower ones (P < .001). Although a similar tendency was seen in SOX11− cases, the difference was not statistically significant (P = .169) (Figure 4H). In addition, CD70 expression levels were significantly lower in SOX11− than in SOX11+ MCL with high proliferation (P < .05) (Figure 4H). To further evaluate the contribution of SOX11 expression, blastoid/pleomorphic morphology, and Ki67 index to CD70 expression, we performed a multivariate analysis with these 3 variables. SOX11 positivity and blastoid/pleomorphic variant were independently and strongly associated with CD70 positivity (both P > .001), whereas the influence of Ki67 was weaker (P = .076) (supplemental Table 10).
To evaluate the possible clinical impact of CD70 overexpression, we analyzed the correlation of CD70 protein levels with OS in SOX11+ MCLs in patients treated with immunochemotherapy (n = 40). Remarkably, high CD70 expression was significantly associated with reduced OS (Figure 4I). This relationship between high CD70 expression and worse outcome was also confirmed in the independent cohort of 122 SOX11+ MCL with available mRNA expression (GSE93291) (Figure 4J).24 Together, these results suggest that CD70 overexpression in MCL could be playing a role in the pathogenesis and aggressiveness of this disease.
We performed pairwise multivariate Cox regression models to evaluate the possible independent prognostic value of CD70 protein expression, in presence of other high-risk features in our SOX11+ MCL cases. The prognostic effect of CD70 levels was independent of TP53 alterations (P = .022) and blastoid/pleomorphic variant (P = .002). CD70 and Ki67 had a similar prognostic effect that was not independent of each other (supplemental Table 11).
SOX11-mediated CD70 expression in MCL cells is activated by CD40L in vitro
To determine whether SOX11 could be directly involved in the regulation of CD70 transcription, we revisited our previously published chromatin immunoprecipitation (ChIP) data on MCL cell lines8 and identified a CD70 locus (1393-1119 bp upstream of the transcription start site), as statistically significant SOX11-binding site (supplemental Figure 6). ChIP-qPCR experiments showed fold enrichment of the CD70 locus in the ChIPs of SOX11+ cell line (Z138 wild type [WT] and JVM2SOX11+12 and Z138CT [red]) DNAs over their inputs, with a highly significant enrichment compared with non-SOX11-expressing cell lines (JVM2CT and Z138SOX11KD8 [blue]) (Figure 5A-B).
![SOX11-dependent CD70 expression is induced by CD40L in vitro in MCL cells. ChIP-qPCR experiments showing the enrichment of specific CD70 loci (1393-1119 pb upstream of the transcription start site), identified by SOX11 specific ChIP-chip experiments in (A) 2 SOX11+ MCL cell lines, Z138 wild-type (Z138WT) and JVM2SOX11+, and its control SOX11− MCL cell line (JVM2CT)12 and (B) in Z138 SOX11-knockdown (Z138SOX11KD) and its SOX11+ control (Z138CT) MCL cell line,8 were used for SOX11-specific ChIP-qPCRs experiments. DNA enrichment is displayed as fold change relative to its respective input chromatin and JVM2CT and Z138SOX11KD enrichment, respectively. (C) RT-qPCR quantification of CD70 mRNA levels (D) and FC quantification of CD70 protein expression levels analyzed in our stable transduced cell lines Z138CT/Z138SOX11KD incubated with vehicle (phosphate-buffered saline [PBS]) or 50 ng/mL CD40L, for 6 hours. Results are represented as fold change in CD40L-treated cells relative to PBS-treated cells. The significance of difference was determined by independent samples Student t test: *P < .05, **P < .01, ***P < .001.](https://ash.silverchair-cdn.com/ash/content_public/journal/blood/138/22/10.1182_blood.2020010527/9/m_bloodbld2020010527f5.png?Expires=1769124168&Signature=QNRxkbzSJrTT6Dx6FbzRwvHQ8j3PrhegJALwdBYmXOdAqcIDHXYgrbatzmo9kI2UNS0OibWI6cGomL6jinvJNs~ErNVxsEVx~91muJASmmAkRtNLdoajGAqHQb~tEK9jV1lvdlEp5MM6qAuR9IB9OjhYnCfzDBoYPLWK14eZp-6lIekOSYyv~mIewpNZ0qfWI4LfOhFtCE1dtxb6pHf12igJl-8LYf~REJj7nvkIxkAwRSLOwN-vCM8tVeyjzWrWpYjdsUxG9eNvwG3LtRCYLp9X1Y9fbGN0VszEo6udgFnoQSyGOEvftVz783IfpqxCoUr2m-VY4JWsrYKjk-4XBA__&Key-Pair-Id=APKAIE5G5CRDK6RD3PGA)
SOX11-dependent CD70 expression is induced by CD40L in vitro in MCL cells. ChIP-qPCR experiments showing the enrichment of specific CD70 loci (1393-1119 pb upstream of the transcription start site), identified by SOX11 specific ChIP-chip experiments in (A) 2 SOX11+ MCL cell lines, Z138 wild-type (Z138WT) and JVM2SOX11+, and its control SOX11− MCL cell line (JVM2CT)12 and (B) in Z138 SOX11-knockdown (Z138SOX11KD) and its SOX11+ control (Z138CT) MCL cell line,8 were used for SOX11-specific ChIP-qPCRs experiments. DNA enrichment is displayed as fold change relative to its respective input chromatin and JVM2CT and Z138SOX11KD enrichment, respectively. (C) RT-qPCR quantification of CD70 mRNA levels (D) and FC quantification of CD70 protein expression levels analyzed in our stable transduced cell lines Z138CT/Z138SOX11KD incubated with vehicle (phosphate-buffered saline [PBS]) or 50 ng/mL CD40L, for 6 hours. Results are represented as fold change in CD40L-treated cells relative to PBS-treated cells. The significance of difference was determined by independent samples Student t test: *P < .05, **P < .01, ***P < .001.
SOX11-dependent CD70 expression is induced by CD40L in vitro in MCL cells. ChIP-qPCR experiments showing the enrichment of specific CD70 loci (1393-1119 pb upstream of the transcription start site), identified by SOX11 specific ChIP-chip experiments in (A) 2 SOX11+ MCL cell lines, Z138 wild-type (Z138WT) and JVM2SOX11+, and its control SOX11− MCL cell line (JVM2CT)12 and (B) in Z138 SOX11-knockdown (Z138SOX11KD) and its SOX11+ control (Z138CT) MCL cell line,8 were used for SOX11-specific ChIP-qPCRs experiments. DNA enrichment is displayed as fold change relative to its respective input chromatin and JVM2CT and Z138SOX11KD enrichment, respectively. (C) RT-qPCR quantification of CD70 mRNA levels (D) and FC quantification of CD70 protein expression levels analyzed in our stable transduced cell lines Z138CT/Z138SOX11KD incubated with vehicle (phosphate-buffered saline [PBS]) or 50 ng/mL CD40L, for 6 hours. Results are represented as fold change in CD40L-treated cells relative to PBS-treated cells. The significance of difference was determined by independent samples Student t test: *P < .05, **P < .01, ***P < .001.
Several publications have demonstrated that TGF-β, BCR, or CD40L stimuli regulate CD70 expression in normal and malignant hematopoietic cells.30-32 To analyze whether extrinsic factors could induce the expression of CD70 in MCL, we treated in vitro SOX11+ (Z138CT) and SOX11-knockdown (Z138SOX11KD) stable transduced MCL cells,8 with exogenous CD40L, TGF-β, and IgM, as BCR stimuli. Using RT-qPCR and FC experiments, we observed that exogenous CD40L significantly increased CD70 mRNA and protein expression only in SOX11+ Z138CT but not in Z138SOX11KD MCL cell lines (Figure 5C-D). On the contrary, CD70 expression was not induced when the same cells were treated with exogenous TGF-β or IgM (data not shown). Together, these results suggest that CD70 expression in MCL cells is co-regulated by SOX11 and extrinsic factors from its nodal TME.
CD70 overexpression in tumor cells correlates with increased intratumoral Treg cells
Aberrant expression of CD70 has been observed in different tumors favoring immune escape through the induction of intratumoral Treg cells or/and T-cell anergy, exhaustion, or apoptosis of anti-tumor effector T cells.33-35 To determine the presence of Treg cells in nodal MCL TME and its possible association with CD70 expression, we first analyzed the levels of the Treg cell transcription factor FOXP3 in relation to total CD3 mRNA in the cases examined by NanoString. We observed a significant higher FOXP3/CD3 mRNA ratio in SOX11+ than negative MCLs, suggesting a greater infiltration of Treg cells in relation to the total T-cell population in SOX11+ MCLs (supplemental Figure 7A). In addition, the FOXP3/CD3 mRNA ratio had a positive correlation with CD70 mRNA levels (supplemental Figure 7B). To confirm these results, we quantified the number of intratumoral FOXP3+ and CD3+ T cells in tissue sections by IHC and observed a similar significant higher FOXP3+/CD3+ cell ratio in SOX11+ tumors (supplemental Figure 7C). Similarly, the FOXP3+/CD3+ cell ratio significantly correlated to the number of CD70+ cells in these cases (supplementary Figure 7D).
Because most Treg cells are a subpopulation of CD4+ T cells, we quantified the relative number of Treg cells within the total CD4+ T cells (FOXP3+/CD4+ T-cell ratio) detected by IHC. We observed a higher number of intratumoral FOXP3+ cells and FOXP3+/CD4+ T-cell ratio in SOX11+ than in SOX11− MCLs (Figure 6A-B). Effector Treg cells coexpress the FOXP3 transcription factor and the CTLA4 transmembrane protein. Using double IHC staining, we observed that most intratumoral FOXP3+ cells coexpressed CTLA4 in nodal MCLs (Figure 6A), confirming that they correspond to effector Treg cells. Interestingly, the number of intratumoral effector Treg cells (FOXP3+ CTLA4+ T cells) and the FOXP3+ CTLA4+/CD4+ T-cell ratio were higher in SOX11+ than SOX11− MCLs (Figure 6A,C). Furthermore, FOXP3+/CD4+ cells and FOXP3+ CTLA4+/CD4+ T-cell ratios had a positive correlation with the number of CD70+ tumor cells in primary nodal MCLs (Figure 6D-E). Remarkably, high FOXP3+/CD4+ and FOXP3+/CD3+ cell rations were associated with worse OS (Figure 6F; supplemental Figure 7E). Moreover, FOXP3/CD3 mRNA levels were associated with worse outcome in the independent cohort of 122 SOX11+ MCL primary cases (GSE93291)24 (supplemental Figure 7F). Concordantly with the broadly described immunosuppressive role of Treg cells through the inhibition of cytotoxic T and NK cells,36-39 we also observed significant lower T and NK cytotoxic cell-related markers and lower number of granzyme B+-cytotoxic tumor infiltrated lymphocytes (TIL) in SOX11+ compared with SOX11− MCL (Figure 1; Figure 2A-B).
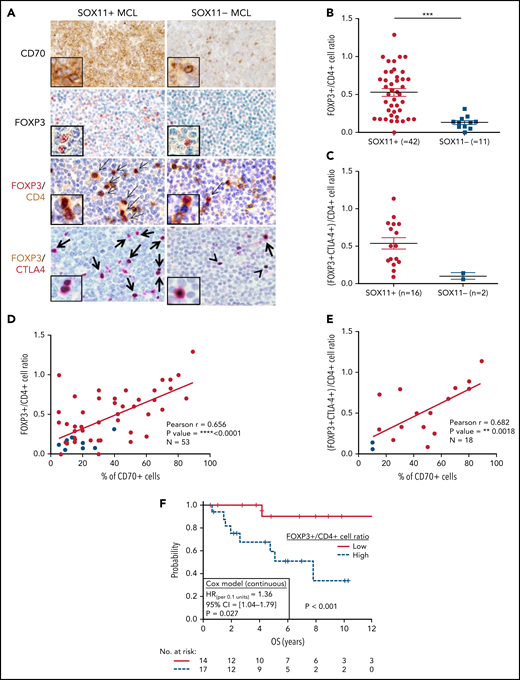
High number of intratumoral Treg CELLS correlates with high numbers of CD70+ cells in SOX11+ nodal MCLs, and it is associated with shorter OS of MCL patients. (A) Representative histological sections from SOX11+ and SOX11− nodal MCL primary sample stained with specific anti-human CD70 and FOXP3 antibodies (×100) and with double IHC staining with anti-FOXP3 (red) and CD4 (brown); and FOXP3 (brown) and CTLA-4 (red) (×200), insets (×400). Double-positive cells are marked by black arrows, whereas single-positive cells are marked by a black arrowhead. (B) IHC quantification of FOXP3+/CD4+ T-cell ratio in SOX11+ and SOX11− nodal MCLs. (C) IHC quantifications of (FOXP3+CTLA4+)/CD4+ T-cell ratio in SOX11+ and SOX11− nodal MCLs. (D-E) Positive correlation between CD70+ cells and FOXP3+/CD4+ T-cell ratio (D) and CD70+ cells and (FOXP3+CTLA4+)/CD4+ T-cell ratio (E) in SOX11+ (red) and SOX11− (blue) nodal MCLs, quantified by IHC in our series of nodal MCL (E). Graphs show Pearson correlation coefficient (r), P value, and number of cases analyzed (N). (F) Kaplan-Meier curve and Cox regression showing the association of FOXP3+/CD4+ cell ratio, quantified by IHC in our series of SOX11+ nodal MCL, with OS. High values were defined by Maxstat (cutoff point = 0.40). Log-rank test P value, hazard ratio (HR) with 95% confidence interval (CI), and Cox regression P value are shown.
High number of intratumoral Treg CELLS correlates with high numbers of CD70+ cells in SOX11+ nodal MCLs, and it is associated with shorter OS of MCL patients. (A) Representative histological sections from SOX11+ and SOX11− nodal MCL primary sample stained with specific anti-human CD70 and FOXP3 antibodies (×100) and with double IHC staining with anti-FOXP3 (red) and CD4 (brown); and FOXP3 (brown) and CTLA-4 (red) (×200), insets (×400). Double-positive cells are marked by black arrows, whereas single-positive cells are marked by a black arrowhead. (B) IHC quantification of FOXP3+/CD4+ T-cell ratio in SOX11+ and SOX11− nodal MCLs. (C) IHC quantifications of (FOXP3+CTLA4+)/CD4+ T-cell ratio in SOX11+ and SOX11− nodal MCLs. (D-E) Positive correlation between CD70+ cells and FOXP3+/CD4+ T-cell ratio (D) and CD70+ cells and (FOXP3+CTLA4+)/CD4+ T-cell ratio (E) in SOX11+ (red) and SOX11− (blue) nodal MCLs, quantified by IHC in our series of nodal MCL (E). Graphs show Pearson correlation coefficient (r), P value, and number of cases analyzed (N). (F) Kaplan-Meier curve and Cox regression showing the association of FOXP3+/CD4+ cell ratio, quantified by IHC in our series of SOX11+ nodal MCL, with OS. High values were defined by Maxstat (cutoff point = 0.40). Log-rank test P value, hazard ratio (HR) with 95% confidence interval (CI), and Cox regression P value are shown.
CD27 expression in nodal MCL
Given the costimulatory effect of CD70-CD27, we also studied CD27 expression in these tumors. The NanoString GEP data showed similar CD27 mRNA levels in SOX11+, SOX11− nodal MCL and RLN samples (Figure 1) and similarly expressed in purified and unpurified tumor cells samples (supplemental Figure 8A). We then studied CD27 protein expression in 51 (40 SOX11+ and 11 SOX11−) nodal MCL by IHC and observed that CD27 protein expression was virtually negative or very low in 12 cases (24%), moderate in 22 (43%), and strong in 17 (33%) compared with the strong staining of T cells (Figure 7A). These results are relatively similar to previous CD27 studies in MCL.27,40 A quantitative evaluation showed that CD27 expression was not related to SOX11 or CD70 expression, Ki67 proliferative index, or the outcome of the patients (Figure 7B-C; supplemental Figure 8B-D).
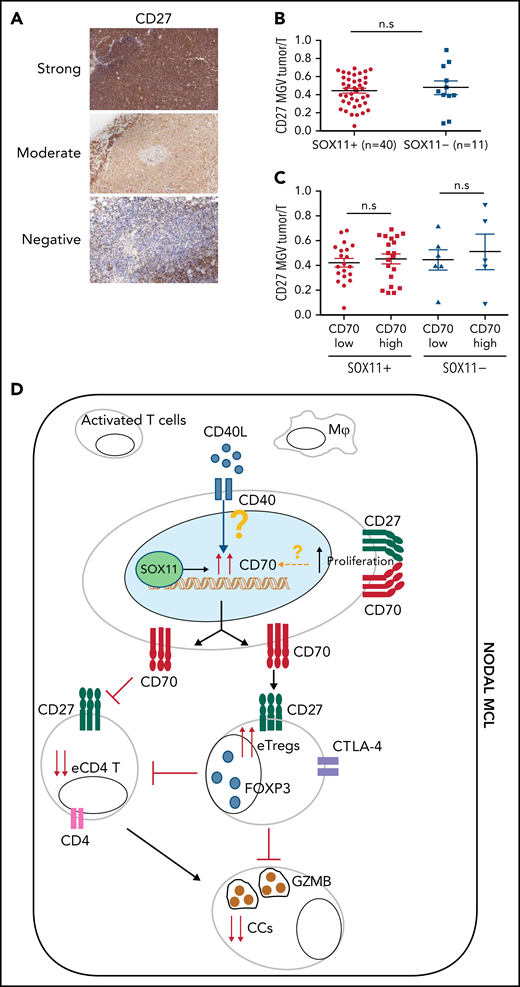
CD27 in MCLs. (A) Representative histological sections with strong, moderate, and negative CD27 IHC staining in SOX11+ nodal MCL primary sample. (B-C) Mean gray value (MGV) quantification of CD27 staining (see supplemental Methods) in SOX11+ (n = 40) and SOX11− (n = 11) nodal MCLs (B) and in cases with low and high CD70 expression (C). The significance difference was determined by independent samples Student t test: n.s., not significant. (D) Immune evasion mechanism model of SOX11/CD70/Treg cells axis in nodal MCLs. Our results show that SOX11 binds to a regulatory region of CD70. CD40L present in nodal MCL niches, probably in macrophages (Mф) and/or activated T cells, induces the expression of CD70 in SOX11-expressing MCL cells. The association of CD70 expression with blastoid/pleomorphic variants and high proliferation suggest that other factors may also influence CD70 expression in MCLs. CD70 favors tumor cell survival and proliferation, as well as the infiltration and/or induction of effector Treg (eTreg) cells, probably through the activation of the CD27/CD70 signaling pathway. SOX11-mediated CD70 expression in MCLs could promote apoptosis, anergy, or exhaustion of T cells, reducing the number of activated/effector T cells (eTC), in nodal MCL TMEs. At the same time, increased Treg cells could impair the infiltration of eTC and inhibit the cytotoxicity of effector immune cells (CCs). CD70/Treg cells immune evasion mechanism could favor tumor cell survival, drug resistance, and relapse, frequently seen in MCL.
CD27 in MCLs. (A) Representative histological sections with strong, moderate, and negative CD27 IHC staining in SOX11+ nodal MCL primary sample. (B-C) Mean gray value (MGV) quantification of CD27 staining (see supplemental Methods) in SOX11+ (n = 40) and SOX11− (n = 11) nodal MCLs (B) and in cases with low and high CD70 expression (C). The significance difference was determined by independent samples Student t test: n.s., not significant. (D) Immune evasion mechanism model of SOX11/CD70/Treg cells axis in nodal MCLs. Our results show that SOX11 binds to a regulatory region of CD70. CD40L present in nodal MCL niches, probably in macrophages (Mф) and/or activated T cells, induces the expression of CD70 in SOX11-expressing MCL cells. The association of CD70 expression with blastoid/pleomorphic variants and high proliferation suggest that other factors may also influence CD70 expression in MCLs. CD70 favors tumor cell survival and proliferation, as well as the infiltration and/or induction of effector Treg (eTreg) cells, probably through the activation of the CD27/CD70 signaling pathway. SOX11-mediated CD70 expression in MCLs could promote apoptosis, anergy, or exhaustion of T cells, reducing the number of activated/effector T cells (eTC), in nodal MCL TMEs. At the same time, increased Treg cells could impair the infiltration of eTC and inhibit the cytotoxicity of effector immune cells (CCs). CD70/Treg cells immune evasion mechanism could favor tumor cell survival, drug resistance, and relapse, frequently seen in MCL.
Finally, we used the larger cohort of 122 SOX11+ MCL samples (GSE93291)24 to evaluate the independent prognostic value of the 4 mRNA variables associated with outcome (T-cell costimulatory, activation and receptor signaling average score, CD70 expression, Ki67 index, and FOXP3/CD3 mRNA ratio). A multivariate Cox regression model identified Ki67 index and the FOXP3/CD3 mRNA ratio as potential independent risk factors of OS (P < .05) (supplemental Table 12).
Discussion
Here, we have characterized the immunological ecosystem of nodal SOX11+ and SOX11− MCL. We identified a significant decrease of immune cell populations and downregulation of several genes related to effective T-cell functions in SOX11+ compared with SOX11− MCLs. SOX11+ MCL also had significant lower numbers of CD4+ TILs, suggesting that these tumors may have a deficit in T-cell trafficking and/or infiltration that may hamper the antitumor immune response. Interestingly, lower expression of genes related to the T-cell population and T-cell costimulatory and signaling activation pathways and MHC class I/II-like were significantly associated with reduced OS. These findings are concordant with previous observations relating reduced CD4+ T cells in tissues or blood of patients with MCL and the aggressiveness of the tumors.15,16
Interestingly, we also identified the significant upregulation of CD70 in SOX11+ MCL that correlated with blastoid/pleomorphic morphology, high proliferation, and poor outcome of patients, suggesting that CD70 expression may play a role in the aggressiveness of this disease. These findings expand previous observations of CD70 expression in several B-cell neoplasms including occasional MCL.26,27,41-44 The overexpression in more aggressive forms of MCL is concordant with CD70 overexpression in aggressive lymphomas such as diffuse large B-cell lymphoma (DLBCL), Burkitt lymphoma, or follicular lymphoma grade 3, whereas the lower expression in SOX11− MCL parallels the expression in low-grade lymphomas. However, CD70 alterations in DLBCL and Burkitt lymphoma are complex. On 1 hand, these lymphomas may inactivate CD70 by homozygous gene deletions, mutations, and promoter hypermethylation,45-50 but also some cases have gene overexpression associated with shorter OS in DLBCL.26,50 Interestingly, the situation in MCL seems different since similar to DLBCL CD70 overexpression is associated with aggressive behavior but contrary to DLBCL, we have not detected CD70 inactivating mutations or deletions in our recent whole genome sequencing analysis of MCL.51
CD70 expression in normal and neoplastic lymphoid cells may be induced by different mechanisms including TGF-β, CD40L, and TLR stimuli, among others.30-32,52,53 We have shown that CD70 expression in MCL is upregulated in vitro by CD40L as in other lymphoid cells, but only in SOX11+ cells, suggesting that in this lymphoma CD70 expression may be co-regulated by exogenous stimuli in the presence of SOX11. The significant lower expression of CD70 observed in SOX11− MCL, including blastoid and highly proliferative cases compared with SOX11+ tumors, supports the role of SOX11 in facilitating CD70 expression. However, the increased CD70 levels in blastoid/pleomorphic variants and highly proliferative SOX11+ tumors also suggest that other factors must be involved in CD70 upregulation. The mechanisms modulating CD70 expression in aggressive lymphomas may be heterogeneous and may depend on tumor subtype. For instance, in germinal center B-cell DLBCL, CD70 expression is primarily influenced by its genomic status, whereas in the activated B-cell subtype, it related to promoter methylation.50 On the other hand, CD70 interacts with CD27 in a costimulatory axis, and CD70 binding may induce a reverse signaling promoting proliferation in tumor cells.26,41 We have confirmed the high expression of CD27 in MCL that may participate in the costimulation of CD70-CD27 downstream pathways, providing survival and proliferative signals to tumor cells.26,27,41
CD70 overexpression in tumor cells promotes immune evasion by inducing Treg differentiation and proliferation, T-cell apoptosis, anergy, or exhaustion.33-35 In line with these ideas, we observed a higher infiltration of intratumoral effector Treg cells in SOX11+ than SOX11− nodal MCLs and a positive correlation between CD70 overexpression in tumor cells and higher numbers of intratumoral Treg cells. Concordantly, SOX11+ MCL had a significant lower infiltration of CD4+ T cells and granzyme B+ cytotoxic cells than SOX11− tumors. Moreover, we observed that higher intratumoral Treg cells were associated with shorter OS. Together, these results suggest that Treg cells intratumoral infiltration could play an essential role in tumor progression by decreasing the infiltration and/or activation of effector cytotoxic cells in SOX11+ nodal MCLs. Together, our results suggest that CD70 and Treg cells could be new potential therapeutic targets in patients with MCL to overcome the sanctuary of TME niches, which promote tumor progression.54-57
Overall, this study suggests that SOX11+ MCL have an immunosuppressive TME with a global reduction of effective antitumor immune cells (Figure 7D). Moreover, CD70 is overexpressed in aggressive MCL and this upregulation may be modulated, at least in part, by microenvironment factors combined with SOX11 expression. CD70 could promote CD70-CD27 downstream proliferative signals on tumor cells and Treg cells that in turn may hamper the infiltration and/or activation of effective T and cytotoxic cells. The association of CD70 overexpression with a higher Treg cells intratumor infiltration, tumor proliferation, aggressive clinical behavior, and worse outcome suggests that CD70/Treg axis may represent a novel target for immunotherapy strategies in patients with MCL.
Acknowledgments
The authors are indebted to the HCB-IDIBAPS Biobank-Tumor Bank and Hematopathology Collection for sample procurement and to the Genomics core facility for the technical help, to Rosó Mares for her technical support, and to S. Ruiz for her logistics assistance.
This work was supported by the Ministerio de Ciencia, Innovación y Universidades (MICIU) (grants RTI2018-099793-B-I00 [V.A.] and RTI2018-094274-B-I00 [E.C.]), cofinanced by the Sub-Directorate General for Evaluation and the European Regional Development Fund; Fondo Europeo de Desarrollo Regional (FEDER;“Una manera de hacer Europa”), Generalitat de Catalunya Suport Grups de Recerca (AGAUR 2017-SGR-1482 [V.A.] and 2017-SGR-1142 [E.C.]), Fundació La Marató de TV3 (75/C/2019 [V.A.]), and the National Institutes of Health, National Cancer Institute “Molecular Diagnosis, Prognosis, and Therapeutic Targets in Mantle Cell Lymphoma” (grant 1P01CA229100 [E.C.]). P.B. was supported by the Asociación Española Contra el Cancer” (AECC; Investigadores 2018 Fellowship, INVES18042AMAD). L.V. was supported by Colciencias (Colombian Department of Science, Technology and Innovation) from the Government of Colombia (International Doctoral Fellowship grant 728-2015). M.S.-G. was supported by the Agencia de Gestió d’Ajuts Universitaris i de Recerca (AGAUR; investigador novell; FI2018, RH041713). E.C. is an Academia Researcher of the “Institució Catalana de Recerca i Estudis Avançats” (ICREA) of the Generalitat de Catalunya, CERCA Programme/Generalitat de Catalunya. This work was developed at the Centro Esther Koplowitz (CEK), Barcelona, Spain.
Authorship
Contribution: P.B. performed NanoString and in vitro experiments and analysis; L.V., I.R.-C., C.M., and G.F. performed IHC experiments and analysis; M.-L.R. and M.S.-G. performed ChIP-qPCR and RT-qPCR experiments; P.B., L.V., G.C., M.S.-G., and F.N. performed statistical analyses; E.G. and A.L.-G. collected clinical data; S.B. and A.N. collected MCL molecular data; P.E. analyzed immune cell markers in MCL; E.C., A.M., W.K., and L.Q.-M. identified MCL tumors; E.C. analyzed IHC data; V.A. designed and supervised experiments; P.B., L.V., E.C., and V.A. analyzed data; P.B., L.V., E.C., and V.A. wrote the manuscript; and all authors discussed the results and commented on the manuscript.
Conflict-of-interest disclosure: The authors declare no competing financial interests.
Correspondence: Virginia Amador, Centre Esther Koplowitz (CEK), C/Rosselló 149-153, 08036 Barcelona, Spain; e-mail: vamador@clinic.cat.
The online version of this article contains a data supplement.
The publication costs of this article were defrayed in part by page charge payment. Therefore, and solely to indicate this fact, this article is hereby marked “advertisement” in accordance with 18 USC section 1734.

This feature is available to Subscribers Only
Sign In or Create an Account Close Modal